

Integration of genetic and clinical information to improve imputation of data missing from electronic health records
- PMID: 31329892
- PMCID: PMC6748821
- DOI: 10.1093/jamia/ocz041
Integration of genetic and clinical information to improve imputation of data missing from electronic health records
Abstract
Objective: Clinical data of patients' measurements and treatment history stored in electronic health record (EHR) systems are starting to be mined for better treatment options and disease associations. A primary challenge associated with utilizing EHR data is the considerable amount of missing data. Failure to address this issue can introduce significant bias in EHR-based research. Currently, imputation methods rely on correlations among the structured phenotype variables in the EHR. However, genetic studies have shown that many EHR-based phenotypes have a heritable component, suggesting that measured genetic variants might be useful for imputing missing data. In this article, we developed a computational model that incorporates patients' genetic information to perform EHR data imputation.
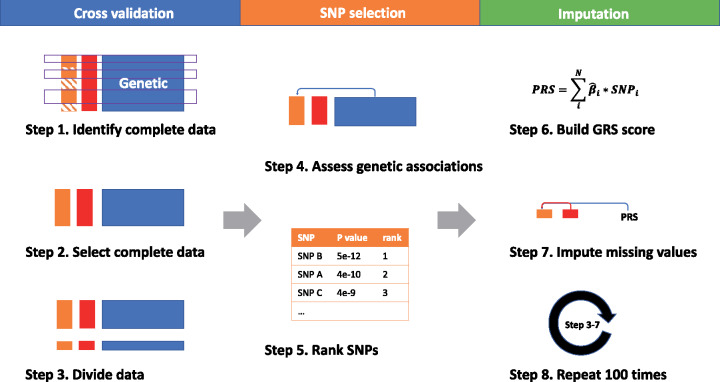
Materials and methods: We used the individual single nucleotide polymorphism's association with phenotype variables in the EHR as input to construct a genetic risk score that quantifies the genetic contribution to the phenotype. Multiple approaches to constructing the genetic risk score were evaluated for optimal performance. The genetic score, along with phenotype correlation, is then used as a predictor to impute the missing values.
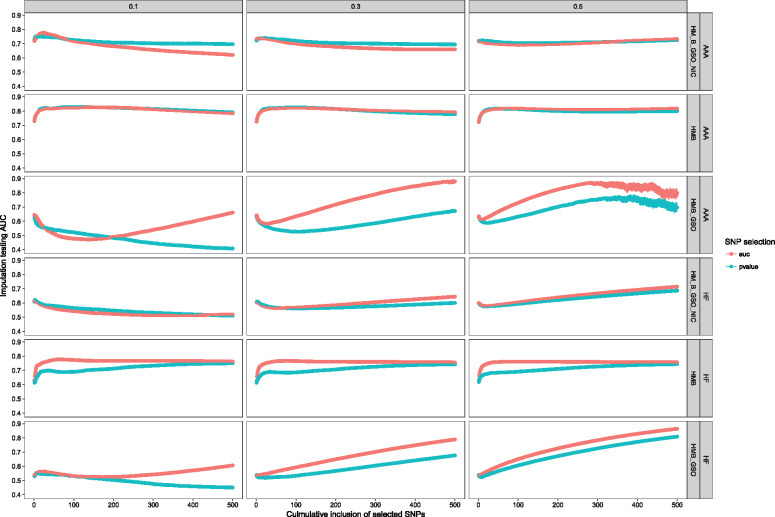
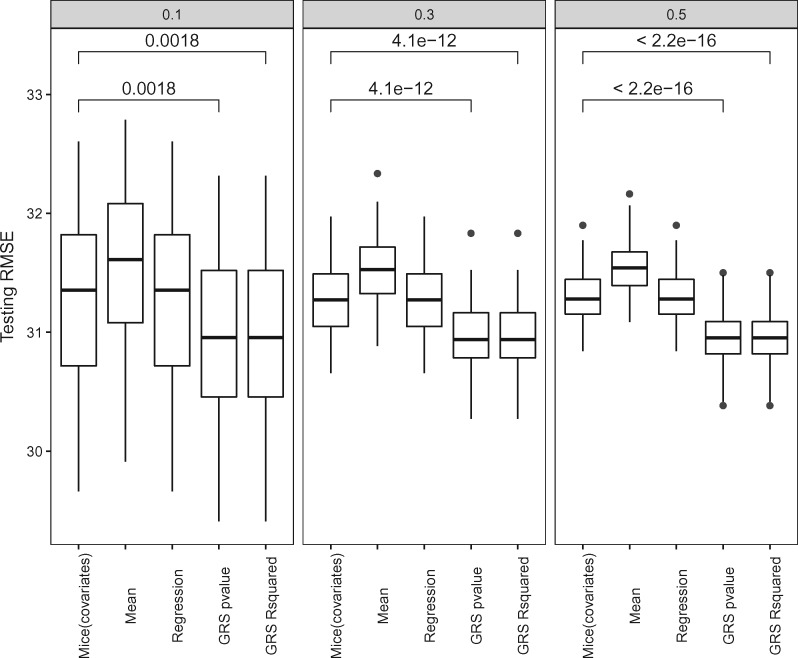
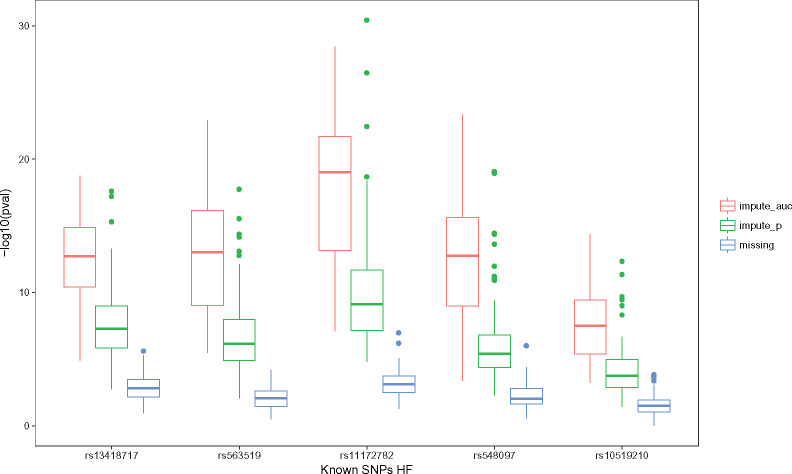
Results: To demonstrate the method performance, we applied our model to impute missing cardiovascular related measurements including low-density lipoprotein, heart failure, and aortic aneurysm disease in the electronic Medical Records and Genomics data. The integration method improved imputation's area-under-the-curve for binary phenotypes and decreased root-mean-square error for continuous phenotypes.
Conclusion: Compared with standard imputation approaches, incorporating genetic information offers a novel approach that can utilize more of the EHR data for better performance in missing data imputation.
Keywords: electronic health record; genetic risk score; imputation; missing data; single nucleotide polymorphisms.
© The Author(s) 2019. Published by Oxford University Press on behalf of the American Medical Informatics Association. All rights reserved. For permissions, please email: journals.permissions@oup.com.
Figures
References
-
- Prokosch HU, Ganslandt T.. Perspectives for medical informatics. Reusing the electronic medical record for clinical research. Methods Inf Med 2009; 481: 38–44. - PubMed
-
- McClatchey KD. Clinical Laboratory Medicine. Philadelphia, PA: Lippincott Wiliams & Wilkins; 2002: 1693.
Publication types
MeSH terms
Grants and funding
LinkOut - more resources
Full Text Sources
Other Literature Sources
