Review
. 2019 Nov 1:1722:146342.
doi: 10.1016/j.brainres.2019.146342. Epub 2019 Jul 19.

Non-cell autonomous mechanism of Parkinson's disease pathology caused by G2019S LRRK2 mutation in Ashkenazi Jewish patient: Single cell analysis

Affiliations
Review

Non-cell autonomous mechanism of Parkinson's disease pathology caused by G2019S LRRK2 mutation in Ashkenazi Jewish patient: Single cell analysis

Jeffrey Kim et al. Brain Res. .

Abstract

Parkinson's disease (PD) is the second most prevalent neurodegenerative disease, characterized by the loss of the midbrain dopaminergic neurons, which leads to impaired motor and cognitive functions. PD is predominantly an idiopathic disease, however about 5% of cases are linked to hereditary mutations. The most common mutation in both familial and sporadic PD is the G2019S mutation of leucine-rich repeat kinase 2 (LRRK2) with high prevalence in Ashkenazi Jewish patients and in North African Berber and Arab patients. It is still not fully understood how this mutation leads to PD pathology. In this study, we derived induced pluripotent stem cells (iPSCs) from an Ashkenazi Jewish patient with G2019S LRRK2 mutation to isolate self-renewable multipotent neural stem cells (NSCs) and to model this form of PD in vitro. To investigate the cellular diversity and disease pathology in the NSCs, we used single cell RNA-seq transcriptomic profiling. The evidence suggests there are three subpopulations within the NSCs: a committed neuronal population, intermediate stage population and undifferentiated stage population. Unbiased single-cell transcriptomic analysis revealed differential expression and dysregulation of genes involved in PD pathology. The significantly affected genes were involved in mitochondrial function, DNA repair, protein degradation, oxidative stress, lysosome biogenesis, ubiquitination, endosome function, autophagy and mitochondrial quality control. The results suggest that G2019S LRRK2 mutation may affect multiple cell types in a non-cell autonomous mechanism of PD pathology and that unbiased single-cell transcriptomics holds promise for personalized medicine.

Keywords: Induced pluripotent stem cells; Mitochondrial function; Neural stem cells; Non-cell autonomous pathology; Parkinson’s disease; Single cell technologies.


Figures

Figure 1:
Figure 1:. Experimental design and single cell analysis of global gene expressions in NSC neurospheres.
(A) Workflow of single cell analysis of iPSCs harboring the LRRK2 G2019S mutation were used to generate NSC neurospheres (Adapted from (Kim and Daadi, 2019b)). The neurospheres were dispersed into single cells and then subjected to single-cell RNA-seq using the C1 single-cell auto prep system. (B) Representative immunostaining of NSCs stained for Beta-tubulin III (TUJ1, red), Nestin (NES, green), SOX2 (red), and Vimentin (VIM, green). NSCs exhibit expression of specific neural progenitor markers. White bar indicates 20 µm. (C) Heatmap reveals three subpopulations after performing hierarchical clustering. The three subpopulations are named SP1 (red circle, n=8), SP2 (blue square, n=30), SP3 (green triangle, n=29). (D) Principal component analysis (PCA) recapitulates the three subpopulations: SP1 (red), SP2 (blue), and SP3 (green). SP1 is clusters separately from SP2 and SP3, which are clustered close to each other.
Figure 2:
Figure 2:. Comparative analysis between NSC-derived SP1 and SP2.
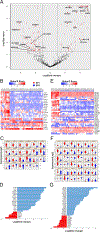
(A) Volcano plot reveals 139 upregulated genes and 74 downregulated genes where the fold change threshold is set at 2 and p<0.05. (B-D) Differential expression analysis using neuronal gene set. (B) Heatmap of gene expression between SP1 (red circle) and SP2 (blue square) after hierarchical clustering of samples according to specific gene sets. (C) Violin plot of the relative expression levels of the neuronal genes of SP1 (red) and SP2 (blue). (D) Bar graphs of log fold change of neuronal genes displaying upregulated (blue) and downregulated (red) expression. (E-G) Differential expression analysis using disease phenotype gene set. (E) Heatmap of gene expression between SP1 (red circle) and SP2 (blue square) after hierarchical clustering of samples according to specific gene sets. (F) Violin plot of the relative expression levels of disease phenotype genes SP1 (red) and SP2 (blue). (G) Bar graphs of log fold change of disease phenotype genes displaying upregulated (blue) and downregulated (red) expression.
Figure 3:
Figure 3:. Comparative analysis between NSC-derived SP1 and SP3.
(A) Volcano plot reveals 150 upregulated genes and 43 downregulated genes where the fold change threshold is set at 2 and p<0.05. (B-D) Differential expression analysis using neuronal gene set. (B) Heatmap of gene expression between SP1 (red circle) and SP3 (green triangle) after hierarchical clustering of samples according to specific gene sets. (C) Violin plot of the relative expression levels of the neuronal genes of SP1 (red) and SP3 (green). (D) Bar graphs of log fold change of neuronal genes displaying upregulated (blue) and downregulated (red) expression. (E-G) Differential expression analysis using disease phenotype gene set. (E) Heatmap of gene expression between SP1 (red circle) and SP3 (green triangle) after hierarchical clustering of samples according to specific gene sets. (F) Violin plot of the relative expression levels of disease phenotype genes of SP1 (red) and SP3 (green). (G) Bar graphs of log fold change of disease phenotype genes displaying upregulated (blue) and downregulated (red) expression.
Figure 4:
Figure 4:. Comparative analysis between SP2 and SP3.
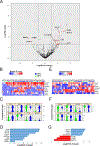
(A) Volcano plot reveals 49 upregulated genes and 6 downregulated genes where the fold change threshold is set at 2 and p<0.05. (B-D) Analysis using neuronal gene set. (B) Heatmap of gene expression between SP2 (blue square) and SP3 (green triangle) after hierarchical clustering of samples according to specific gene sets. (C) Violin plot of the relative expression levels of the neuronal genes of SP2 (blue) and SP3 (green). (D) Bar graphs of log fold change of neuronal genes displaying upregulated (blue) and downregulated (red) expression. (E-G) Analysis using disease phenotype gene set. (E) Heatmap of gene expression between SP2 (blue square) and SP3 (green triangle) after hierarchical clustering of samples according to specific gene sets. (F) Violin plot of the relative expression levels of disease phenotype genes of SP2 (blue) and SP3 (green). (G) Bar graphs of log fold change of disease phenotype genes displaying upregulated (blue) and downregulated (red) expression.
Figure 5:
Figure 5:. GO term enrichment analysis using DAVID functional annotation.
(A) Gene set of all significantly upregulated genes in SP1 compared to SP2 was used. Gene ontology selected was based on p<0.05. (B) Gene set of all significantly upregulated genes in SP1 compared to SP3 was used. Gene ontology selected was based on p<0.05.
Figure 6:
Figure 6:. Karyotype of the iPSC-LRRK2.
Cytogenetic evaluation of the iPSC-LRRK2 line at passage 35 by standard G-banding was performed. Twenty metaphase cells were analyzed and showed a normal male chromosome complement (46,XY).

References

    1. Araki M, Nagata K, Satoh Y, Kadota Y, Hisha H, Adachi Y, Taketani S, 2002. Developmentally regulated expression of Neuro-p24 and its possible function in neurite extension. Neurosci Res. 44, 379–389. - PubMed
    1. Banerjee R, Starkov AA, Beal MF, Thomas B, 2009. Mitochondrial dysfunction in the limelight of Parkinson’s disease pathogenesis. Biochim Biophys Acta. 1792, 651–63. - PMC - PubMed
    1. Beilina A, Rudenko IN, Kaganovich A, Civiero L, Chau H, Kalia SK, Kalia LV, Lobbestael E, Chia R, Ndukwe K, Ding J, Nalls MA, Olszewski M, Hauser DN, Kumaran R, Lozano AM, Baekelandt V, Greene LE, Taymans JM, Greggio E, Cookson MR, Nalls MA, Plagnol V, Martinez M, Hernandez DG, Sharma M, Sheerin UM, Saad M, Simon-Sanchez J, Schulte C, Lesage S, Sveinbjornsdottir S, Arepalli S, Barker R, Ben-Shlomo Y, Berendse HW, Berg D, Bhatia K, de Bie RMA, Biffi A, Bloem B, Bochdanovits Z, Bonin M, Bras JM, Brockmann K, Brooks J, Burn DJ, Charlesworth G, Chen H, Chong S, Clarke CE, Cookson MR, Cooper JM, Corvol JC, Counsell C, Damier P, Dartigues JF, Deloukas P, Deuschl G, Dexter DT, van Dijk KD, Dillman A, Durif F, Durr A, Edkins S, Evans JR, Foltynie T, Gao J, Gardner M, Gibbs JR, Goate A, Gray E, Guerreiro R, Gustafsson O, Harris C, van Hilten JJ, Hofman A, Hollenbeck A, Holton J, Hu M, Huang X, Huber H, Hudson G, Hunt SE, Huttenlocher J, Illig T, Munchen HZ, Jonsson PV, Lambert JC, Langford C, Lees A, Lichtner P, Munchen HZ, Limousin P, Lopez G, Lorenz D, McNeill A, Moorby C, Moore M, Morris HR, Morrison KE, Mudanohwo E, O’Sullivan SS, Pearson J, Perlmutter JS, Petursson H, Pollak P, Post B, Potter S, Ravina B, Revesz T, Riess O, Rivadeneira F, Rizzu P, Ryten M, Sawcer S, Schapira A, Scheffer H, Shaw K, Shoulson I, Sidransky E, Smith C, Spencer CCA, Stefansson H, Steinberg S, Stockton JD, Strange A, Talbot K, Tanner CM, Tashakkori-Ghanbaria A, Tison F, Trabzuni D, Traynor BJ, Uitterlinden AG, Velseboer D, Vidailhet M, Walker R, van de Warrenburg B, Wickremaratchi M, Williams N, Williams-Gray CH, Winder-Rhodes S, Stefansson K, Hardy J, Heutink P, Brice A, Gasser T, Singleton AB, Wood NW, Chinnery PF, Arepalli S, Cookson MR, Dillman A, Ferrucci L, Gibbs JR, Hernandez DG, Johnson R, Longo DL, Majounie E, Nalls MA, O’Brien R, Singleton AB, Traynor BJ, Troncoso J, van der Brug M, Zielke HR, Zonderman AB, 2014. Unbiased screen for interactors of leucine-rich repeat kinase 2 supports a common pathway for sporadic and familial Parkinson disease. Proceedings of the National Academy of Sciences. 111, 2626–2631. - PMC - PubMed
    1. Bengtsson M, Ståhlberg A, Rorsman P, Kubista M, 2005. Gene expression profiling in single cells from the pancreatic islets of Langerhans reveals lognormal distribution of mRNA levels. Genome Research. 15, 1388–1392. - PMC - PubMed
    1. Berger I, Hershkovitz E, Shaag A, Edvardson S, Saada A, Elpeleg O, 2008. Mitochondrial complex I deficiency caused by a deleterious NDUFA11 mutation. Ann Neurol. 63, 405–8. - PubMed

Publication types

Substances