. 2019 Oct:99:67-80.
doi: 10.1016/j.metabol.2019.153947. Epub 2019 Jul 19.

AKR1D1 is a novel regulator of metabolic phenotype in human hepatocytes and is dysregulated in non-alcoholic fatty liver disease

Affiliations

AKR1D1 is a novel regulator of metabolic phenotype in human hepatocytes and is dysregulated in non-alcoholic fatty liver disease

Nikolaos Nikolaou et al. Metabolism. 2019 Oct.

Abstract

Objective: Non-alcoholic fatty liver disease (NAFLD) is the hepatic manifestation of metabolic syndrome. Steroid hormones and bile acids are potent regulators of hepatic carbohydrate and lipid metabolism. Steroid 5β-reductase (AKR1D1) is highly expressed in human liver where it inactivates steroid hormones and catalyzes a fundamental step in bile acid synthesis.

Methods: Human liver biopsies were obtained from 34 obese patients and AKR1D1 mRNA expression levels were measured using qPCR. Genetic manipulation of AKR1D1 was performed in human HepG2 and Huh7 liver cell lines. Metabolic assessments were made using transcriptome analysis, western blotting, mass spectrometry, clinical biochemistry, and enzyme immunoassays.

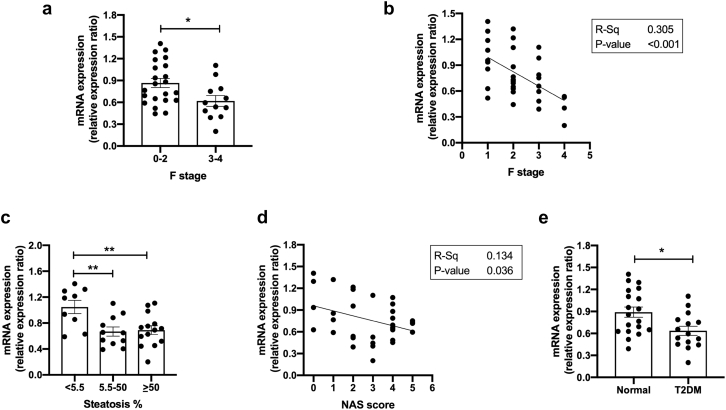
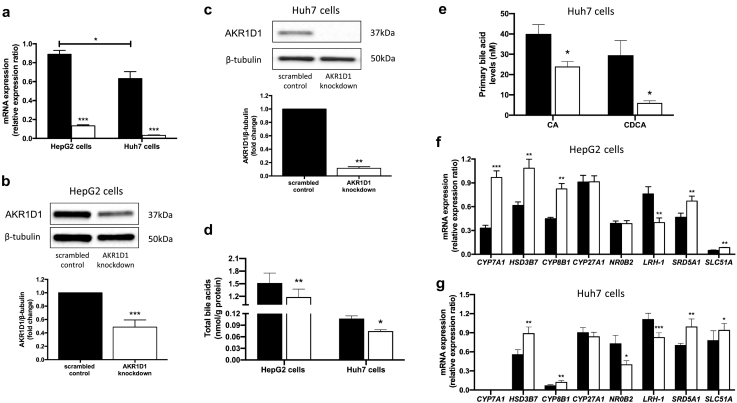
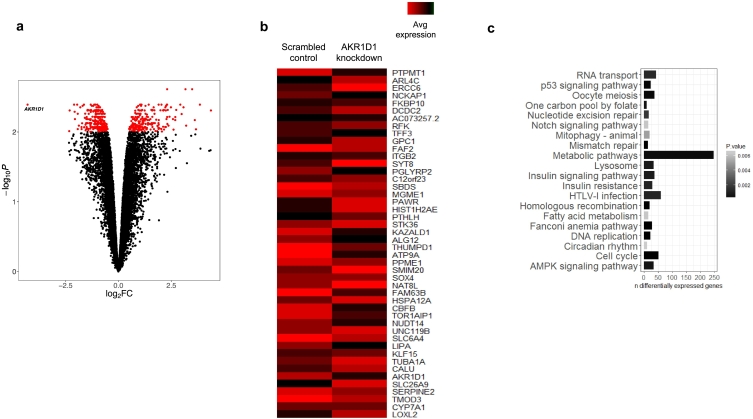
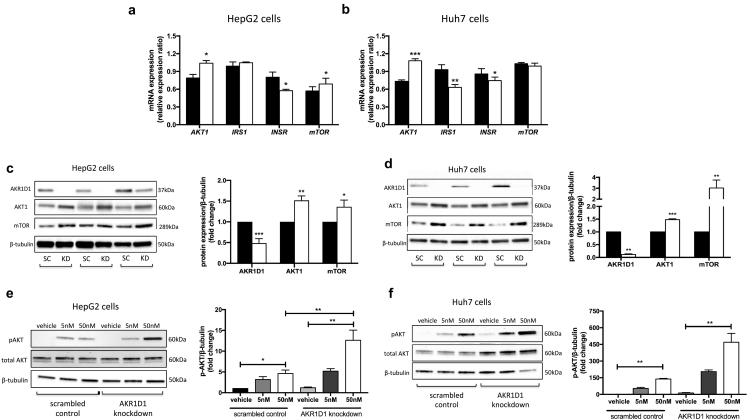
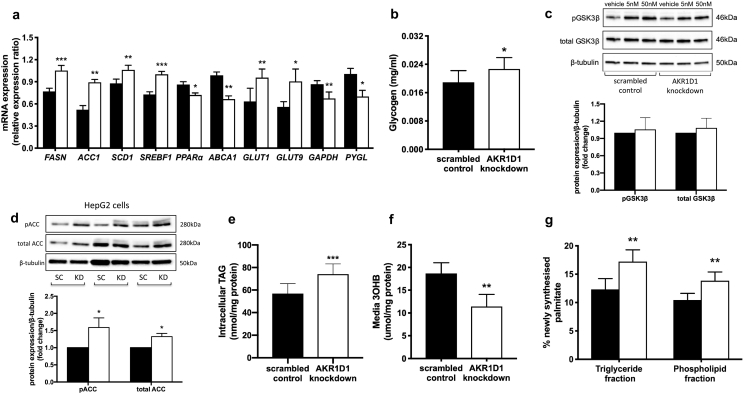
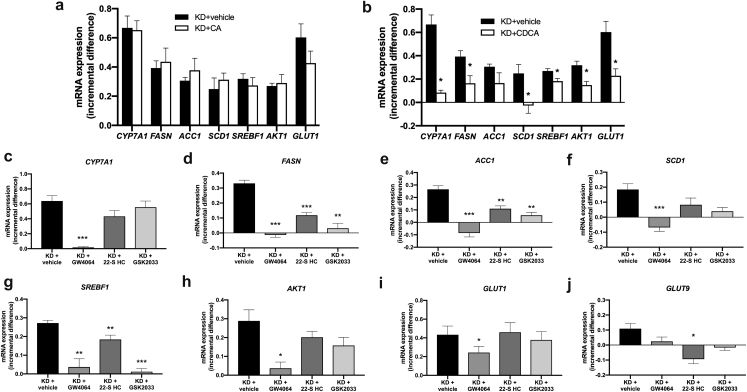
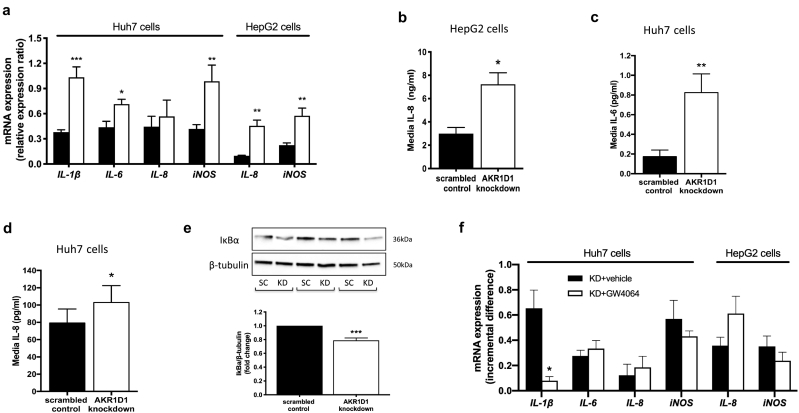
Results: In human liver biopsies, AKR1D1 expression decreased with advancing steatosis, fibrosis and inflammation. Expression was decreased in patients with type 2 diabetes. In human liver cell lines, AKR1D1 knockdown decreased primary bile acid biosynthesis and steroid hormone clearance. RNA-sequencing identified disruption of key metabolic pathways, including insulin action and fatty acid metabolism. AKR1D1 knockdown increased hepatocyte triglyceride accumulation, insulin sensitivity, and glycogen synthesis, through increased de novo lipogenesis and decreased β-oxidation, fueling hepatocyte inflammation. Pharmacological manipulation of bile acid receptor activation prevented the induction of lipogenic and carbohydrate genes, suggesting that the observed metabolic phenotype is driven through bile acid rather than steroid hormone availability.

Conclusions: Genetic manipulation of AKR1D1 regulates the metabolic phenotype of human hepatoma cell lines, driving steatosis and inflammation. Taken together, the observation that AKR1D1 mRNA is down-regulated with advancing NAFLD suggests that it may have a crucial role in the pathogenesis and progression of the disease.

Keywords: 5β-Reductase; Bile acids; Diabetes; FXR; NAFLD; Triglyceride.


Conflict of interest statement

Nothing to declare. TMP is a consultant for Research Institute for Fragrance Materials, is a recipient of a sponsored research agreement from Forendo, and is founding director of Penzymes, LLC.

Figures

Fig. 1
Fig. 1
AKR1D1 expression in obese patients. In male (n = 7) and female (n = 27) obese patients, AKR1D1 mRNA expression decreased with more advanced fibrosis (a-b), steatosis percentage (c) and higher NAFLD Activity Score (NAS) (d). In addition, mRNA expression of AKR1D1 was reduced in patients with T2DM (e). qPCR data were normalised to 18SrRNA, TBP and ACTB. Data are presented as mean ± se, performed in triplicate, *p < 0.05, **p < 0.01.
Fig. 2
Fig. 2
Genetic manipulation of AKR1D1 in human hepatoma cell lines and bile acid signalling and synthesis in human hepatoma cell lines, following AKR1D1 knockdown. AKR1D1 knockdown (white bars), decreased mRNA and protein expression in both HepG2 and Huh7 cells, as measured by qPCR and western blotting (a-c). In both HepG2 and Huh7 cells, AKR1D1 knockdown (white bars) decreased total bile acid concentrations (d). In addition, AKR1D1 knockdown decreased cholic acid (CA) and chenodeoxycholic acid (CDCA) concentrations in Huh7 cells (e). Consistent with these, AKR1D1 knockdown increased the mRNA expression of genes involved in classic bile acid synthesis pathway (CYP7A1, HSD3B7, CYP8B1), bile acid transport (SLC51A), and FXR activation (NR0B2, LRH-1) (f-g). Representative Western blot images are shown, however formal quantification was performed in n = 7–9 replicates. qPCR data were normalised to 18SrRNA. Data are presented as mean ± se of n = 5–8 experiments, performed in triplicate, *p < 0.05, **p < 0.01, ***p < 0.001, compared to scrambled controls (black bars).
Fig. 3
Fig. 3
RNA sequencing analysis in HepG2 cells, following AKR1D1 knockdown. Transcriptomic profiling of AKR1D1 knockdown in HepG2 cells. Volcano plot illustrating fold-change in expression (log2FC) against statistical significance (–log10 adjusted P-values) for all genes. Red dots represent differentially expressed genes as a function of AKR1D1 knockdown (FDR corrected P-values <0.01) (a). Heat map of the expression changes (normalised counts per million) of the top 10% differentially expressed genes (FDR 1%) in AKR1D1 knockdown HepG2 cells (red and black bars represent up- and down-regulation, respectively) (b). Top KEGG pathways illustrated as a function of the number of differentially expressed genes contributing to each annotated pathway and coloured with a gradient defined by the statistical significance of pathway enrichment (c).
Fig. 4
Fig. 4
Insulin signalling in human hepatoma cell lines, following AKR1D1 knockdown. AKR1D1 knockdown (white bars) altered the mRNA expression of insulin signalling genes, including AKT1, insulin receptor and mTOR, in both HepG2 (a) and Huh7 (b) cells, as measured by qPCR. AKR1D1 knockdown (white bars) increased the protein expression of both AKT1 and mTOR in both cell lines (c and d). Consistent with these data, AKR1D1 knockdown, enhanced insulin sensitivity with increased insulin-stimulated phosphorylation of AKT and mTOR (15 min treatment), in both HepG2 (e) and Huh7 (f) cells. qPCR data were normalised to 18SrRNA and protein data were normalised to β-tubulin. Representative Western blot images are shown from 3 biological replicates, however formal quantification was performed in n = 7–9 replicates. Gene expression data are presented as mean ± se of n = 7 experiments, performed in triplicate, *p < 0.05, **p < 0.01, ***p < 0.001, compared to scrambled controls (black bars).
Fig. 5
Fig. 5
Lipid and carbohydrate metabolism in human hepatoma cell lines, following AKR1D1 knockdown. AKR1D1 knockdown (white bars) increased GLUT1 and GLUT9 and decreased GAPDH and glycogen phosphorylase (PYGL) mRNA expression in HepG2 cells, as measured by qPCR (a). Furthermore, intracellular glycogen storage increased (b), whilst, no differences were observed in total or phosphorylated GSK3β levels, following 15 min insulin stimulation (5 nM, 50 nM) (c). In addition, AKR1D1 knockdown enhanced lipogenic gene expression (FAS, ACC1, SCD1, SREBF1) (a), reduced the expression of ABCA1 and PPARα (a), and increased total and phosphorylated ACC protein levels (d). Consistent with the lipogenic and PPARα gene expression, AKR1D1 knockdown increased TAG accumulation in HepG2 cells (e) and reduced fatty acid oxidation, as measured by cell media 3-hydroxybutyrate [3OHB] concentrations (f). Moreover, AKR1D1 knockdown increased de novo palmitate synthesis in both TAG and phospholipid fraction, as measured by incorporation of 2H from 2H2O into TAG and phospholipid palmitate, respectively (g). Representative Western blot images are shown from 3 biological replicates, however formal quantification was performed in n = 7–9 replicates. qPCR data were normalised to 18SrRNA and protein data were normalised to β-tubulin. Data are presented as mean ± se of n = 7–8 experiments, performed in triplicate, *p < 0.05, **p < 0.01, ***p < 0.001, compared to scrambled controls (black bars).
Fig. 6
Fig. 6
Incremental gene expression following AKR1D1 knockdown followed by subsequent treatment with CA, CDCA, FXR agonst or LXR antagonist treatment to attempt to rescue the cellular phenotype. CA replacement (50 μM, 24 h) in the cell culture media failed to prevent upregulation of carbohydrate, lipid or insuling signalling gene expression in AKR1D1 knocked down HepG2 cells (a). In contrast, CDCA replacement (50 μM, 24 h) significantly impaired upregulation of the expression of CYP7A1, FASN, SCD1, SREBF1, AKT1 and GLUT1, in AKR1D1 knocked down HepG2 cells (b). Pharmacological manipulation of the bile acid receptor FXR, using the FXR agonist GW4064 (5 μM, 24 h), also normalised the expression of CYP7A1, FASN, ACC1, SREBF1, SCD1, AKT1, GLUT1 and GLUT9 to levels seen in scrambled controls (figure c–h). In addition, treatment with the LXR antagonist 22-S Hydroxycholesterol (22-S HC - 10 μM, 24 h) and the LXRβ antagonist GKS2033 (100 nM, 24 h) partially restored the expression levels of FASN, ACC1 and SREBF1, but had no impact on the induction of expression of the other genes caused by AKR1D1 knockdown (c–h). qPCR data were normalised to 18SrRNA. Data are presented as mean ± se of incremental gene expression of n = 3–6 experiments, performed in triplicate, *p < 0.05, **p < 0.01, ***p < 0.001 and compared to vehicle treated controls. (KD = AKR1D1 knockdown).
Fig. 7
Fig. 7
Inflammatory response in human hepatoma cell lines, following AKR1D1 knockdown. AKR1D1 knockdown (white bars) increased the mRNA expression of pro-inflammatory cytokines IL-1β, IL-6 and IL-8 as did the expression of iNOS in Huh7 and HepG2 cells, as measured by qPCR (a). AKR1D1 knockdown increased the cell media concentrations of IL-8 in HepG2 cells (b), as well as of IL-6 and IL-8 cell media levels in Huh7 cells (c and d). In addition, AKR1D1 knockdown decreased the protein expression levels of IκBα, the endogenous inhibitor of NF-κB, which co-ordinates the cellular inflammatory response (e). Pharmacological manipulation of the bile acid receptor FXR, using the FXR agonist GW4064 (5 μM, 24 h), normalised the expression of IL- in Huh7 cells, only, whilst it had no effect on the expression of IL-6, IL-8 or iNOS in either Huh7 or HepG2 cells (f). qPCR data were normalised to 18SrRNA, protein levels were normalised to β-tubulin and cell media levels were corrected to total protein. Representative Western blot images are shown from 3 biological replicates, however formal quantification was performed in n = 7–9 replicates. Data are presented as mean ± se of n = 5–8 experiments, performed in triplicate, *p < 0.05, **p < 0.01, ***p < 0.001, compared to scrambled controls (black bars).

References

    1. Ekstedt M., Hagström H., Nasr P., Fredrikson M., Stål P., Kechagias S. Fibrosis stage is the strongest predictor for disease-specific mortality in NAFLD after up to 33 years of follow-up. Hepatology. 2015;61(5):1547–1554. - PubMed
    1. Wong R.J., Aguilar M., Cheung R., Perumpail R.B., Harrison S.A., Younossi Z.M. Nonalcoholic steatohepatitis is the second leading etiology of liver disease among adults awaiting liver transplantation in the United States. Gastroenterology. 2015;148(3):547–555. - PubMed
    1. Mody A., White D., Kanwal F., Garcia J.M. Relevance of low testosterone to non-alcoholic fatty liver disease. Cardiovasc Endocrinol. 2015;4(3):83. - PMC - PubMed
    1. Tarantino G., Finelli C. Pathogenesis of hepatic steatosis: the link between hypercortisolism and non-alcoholic fatty liver disease. World J Gastroenterol. 2013 - PMC - PubMed
    1. Kumarendran B., O'Reilly M.W., Manolopoulos K.N., Toulis K.A., Gokhale K.M., Sitch A.J. Polycystic ovary syndrome, androgen excess, and the risk of nonalcoholic fatty liver disease in women: a longitudinal study based on a United Kingdom primary care database. PLoS Med. 2018;15(3) - PMC - PubMed

Publication types