. 2019 Sep:26:101272.
doi: 10.1016/j.redox.2019.101272. Epub 2019 Jul 11.

Pharmacological characterization of the seven human NOX isoforms and their inhibitors

Affiliations

Pharmacological characterization of the seven human NOX isoforms and their inhibitors

Fiona Augsburger et al. Redox Biol. 2019 Sep.

Abstract

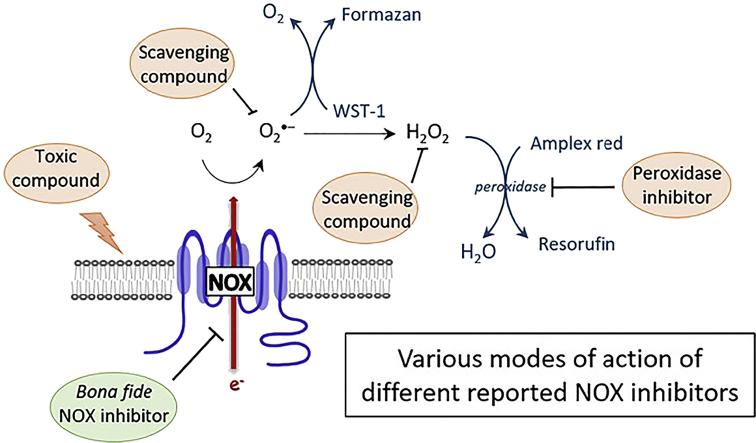
Background: NADPH oxidases (NOX) are a family of flavoenzymes that catalyze the formation of superoxide anion radical (O2•-) and/or hydrogen peroxide (H2O2). As major oxidant generators, NOX are associated with oxidative damage in numerous diseases and represent promising drug targets for several pathologies. Various small molecule NOX inhibitors are used in the literature, but their pharmacological characterization is often incomplete in terms of potency, specificity and mode of action.

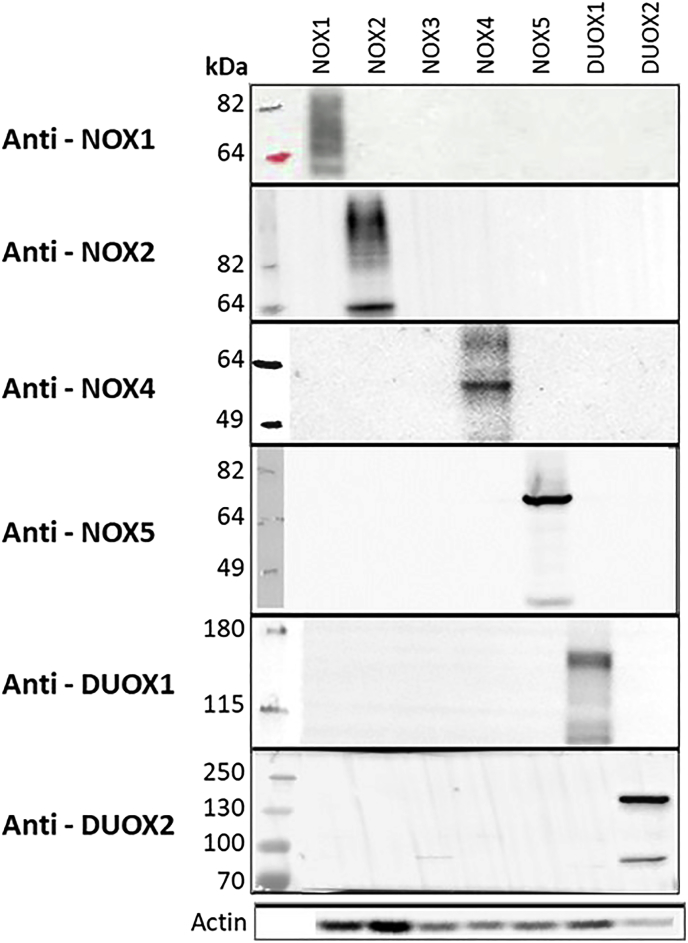
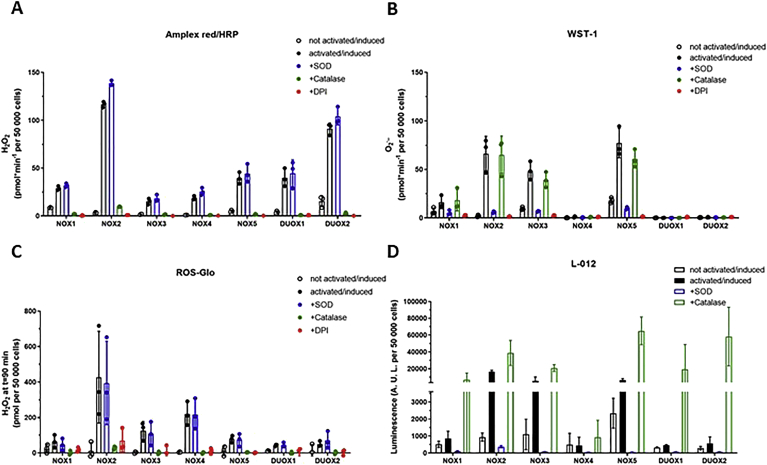
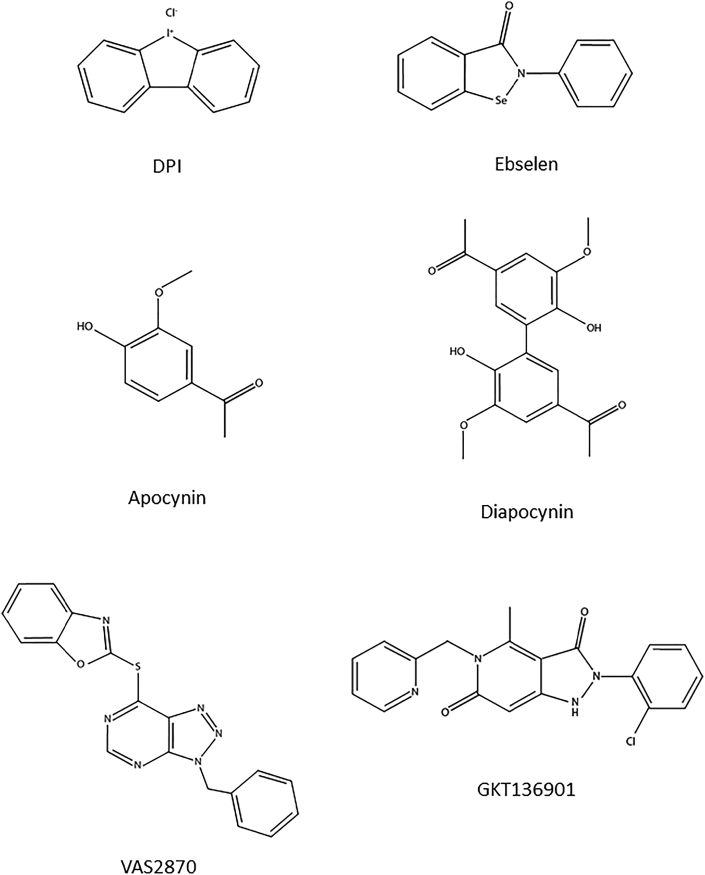
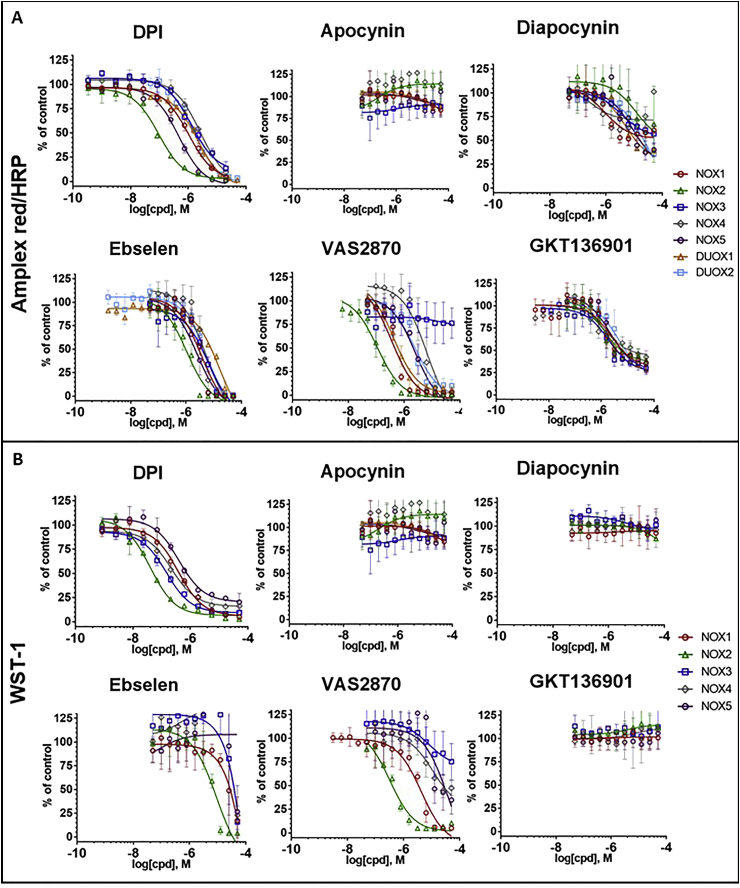
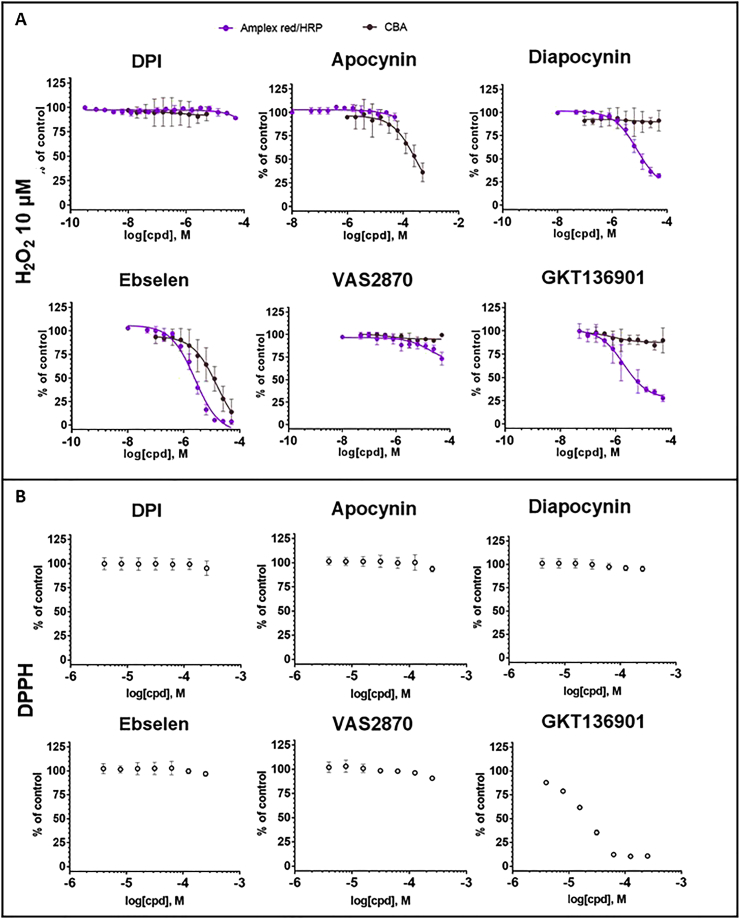
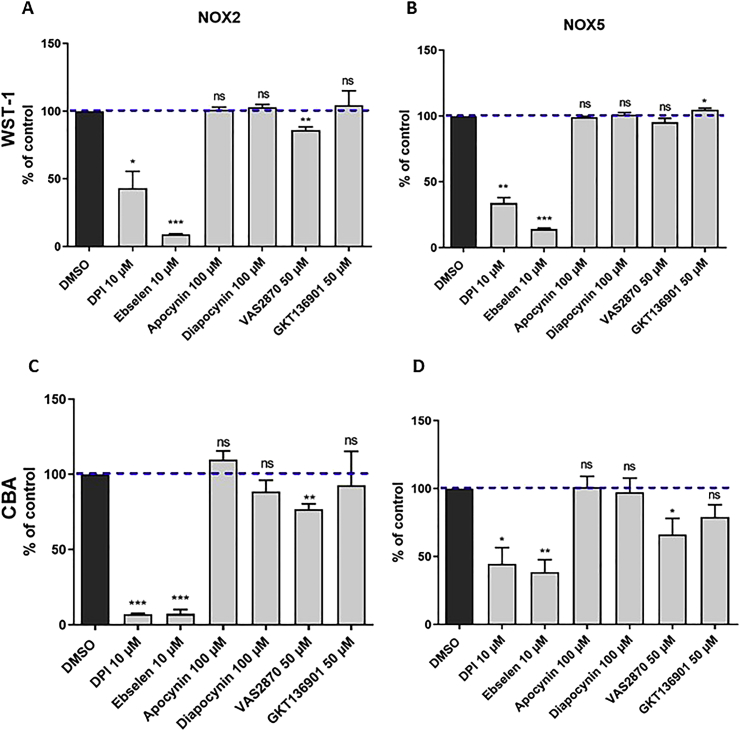
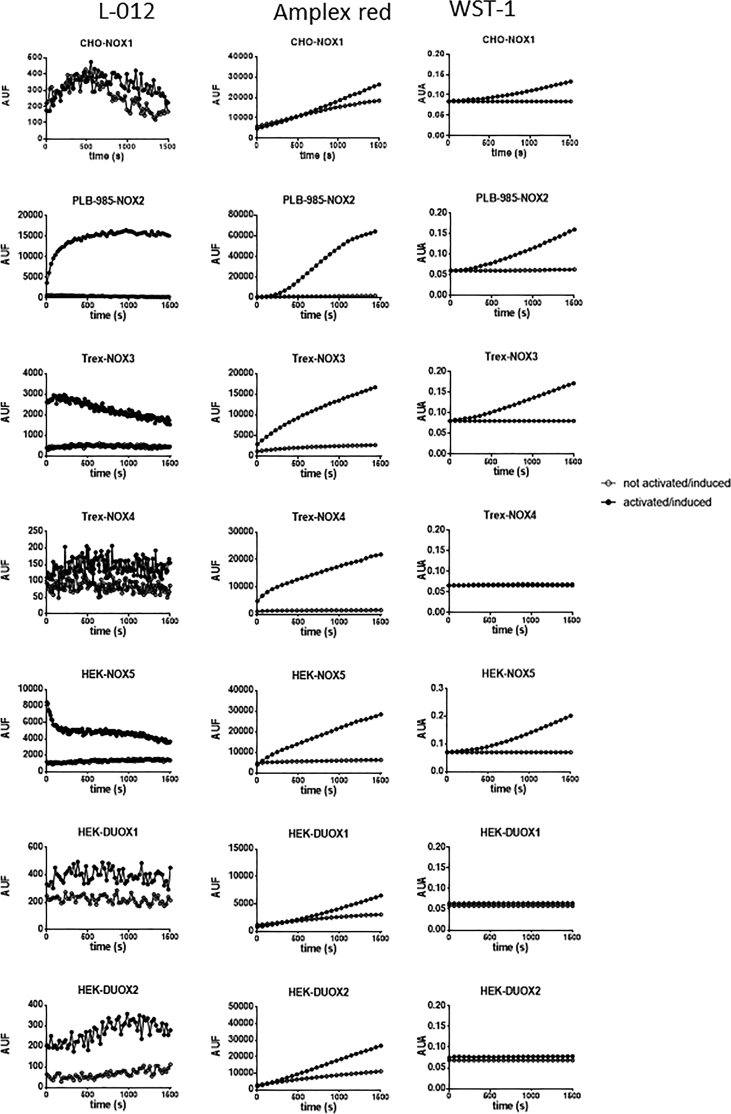
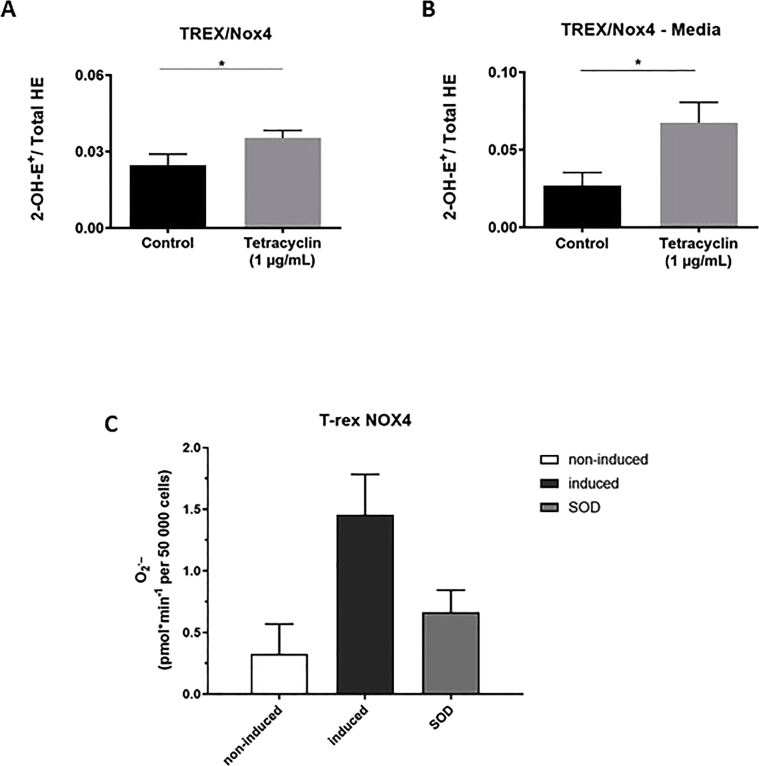
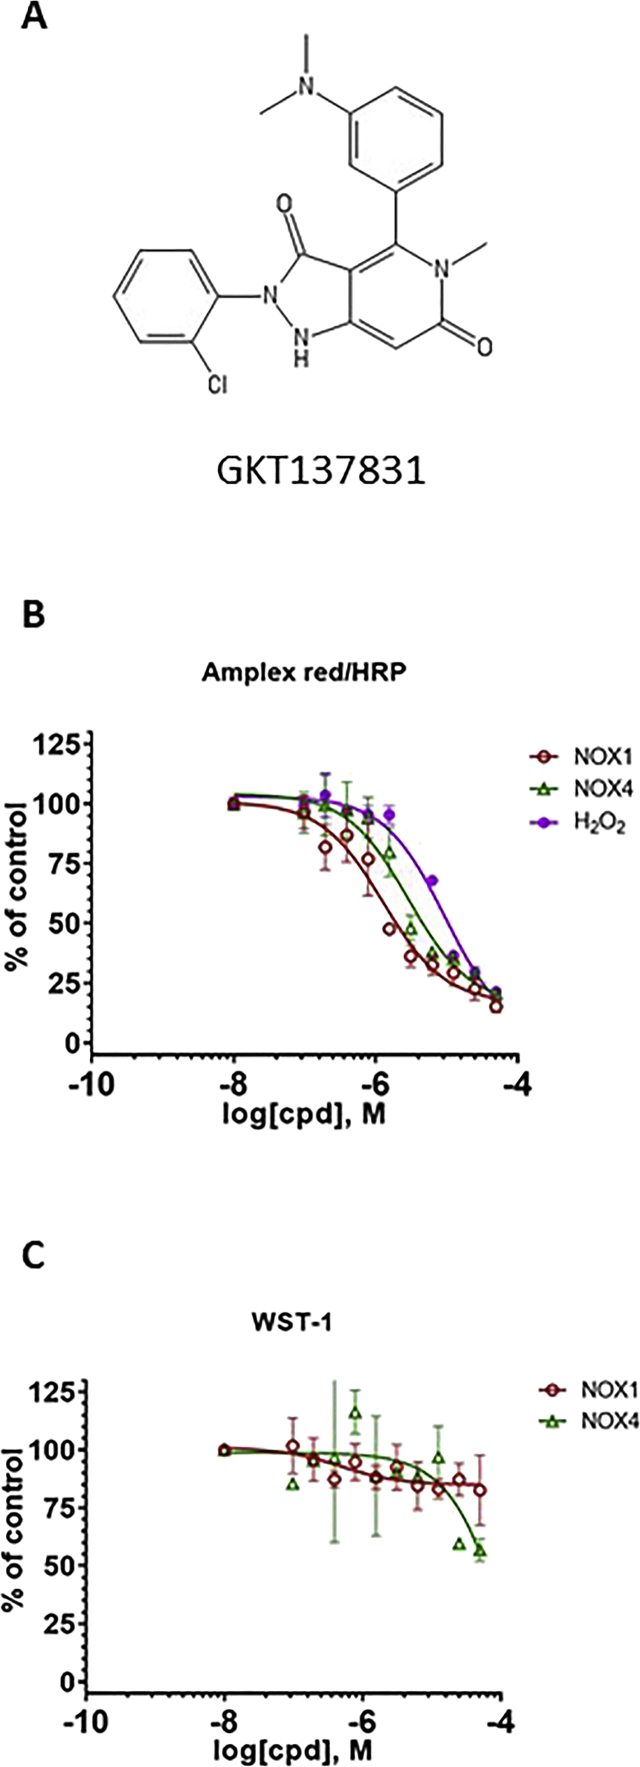
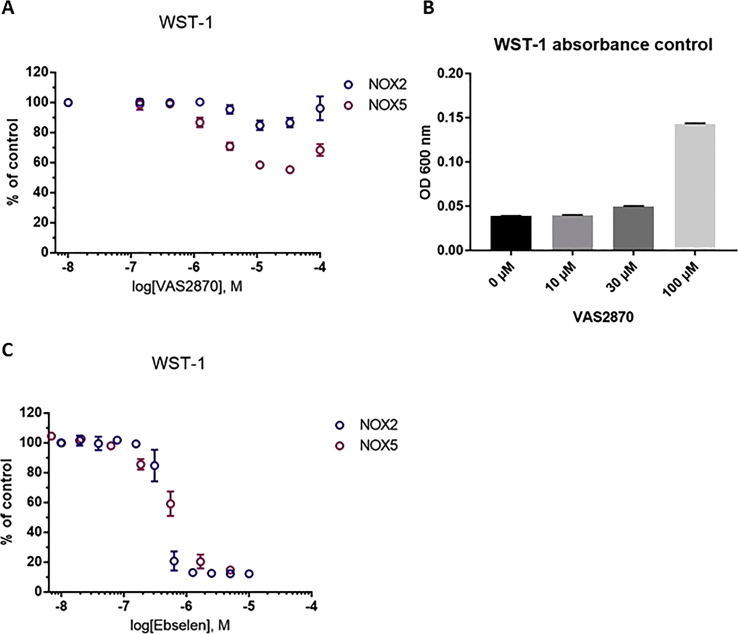
Experimental approach: We used cell lines expressing high levels of human NOX isoforms (NOX1-5, DUOX1 and 2) to detect NOX-derived O2•- or H2O2 using a variety of specific probes. NOX inhibitory activity of diphenylene iodonium (DPI), apocynin, diapocynin, ebselen, GKT136901 and VAS2870 was tested on NOX isoforms in cellular and membrane assays. Additional assays were used to identify potential off target effects, such as antioxidant activity, interference with assays or acute cytotoxicity.

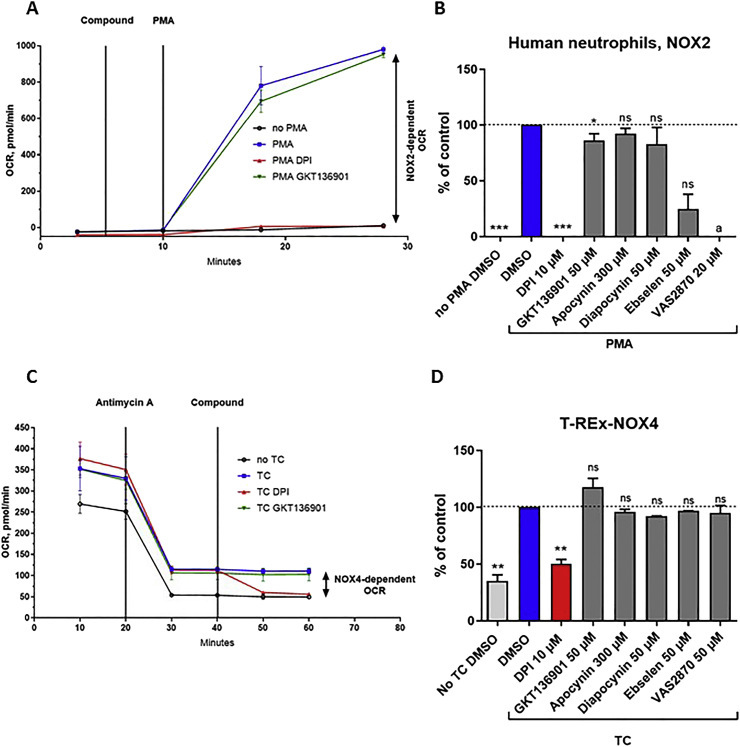
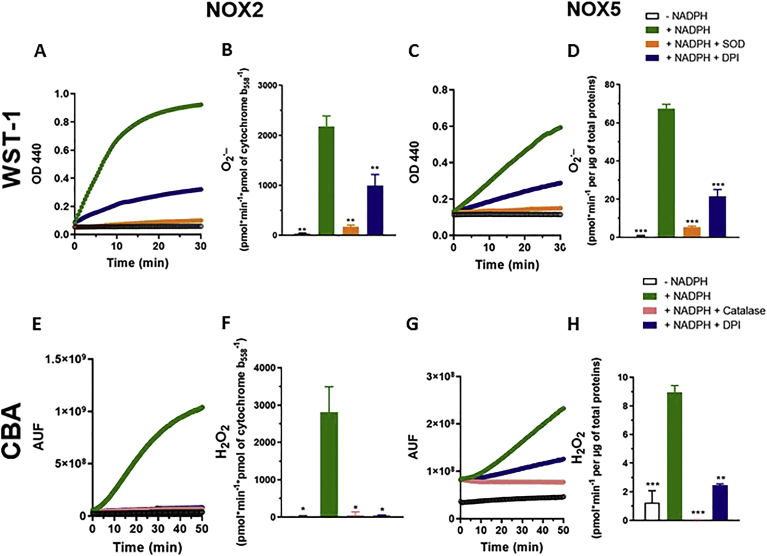
Key results: Cells expressing active NOX isoforms formed O2•-, except for DUOX1 and 2, and in all cases activation of NOX isoforms was associated with the detection of extracellular H2O2. Among all molecules tested, DPI elicited dose-dependent inhibition of all isoforms in all assays, however all other molecules tested displayed interesting pharmacological characteristics, but did not meet criteria for bona fide NOX inhibitors.

Conclusion: Our findings indicate that experimental results obtained with widely used NOX inhibitors must be carefully interpreted and highlight the challenge of developing reliable pharmacological inhibitors of these key molecular targets.

Keywords: NADPH oxidase; NOX; Reactive oxygen species; Small molecule inhibitors.


Figures

Image 1
Graphical abstract
Fig. 1
Fig. 1
Western blot using NOX/DUOX antibodies. Each cell line (columns) was tested against NOX/DUOX antibodies (rows) by Western blot, confirming the expression of the appropriate isoform. NOX3 and NOX4 expression was induced by treatment with 1 μg tetracycline for 24 h. NOX2 expression was induced by differentiation of PLB-985 cells with DMSO 1.25% for 72 h. NOX1, NOX5 and DUOX1 and DUOX2 are constitutively overexpressed. A wide range of commercial antibodies were tested, but only the antibodies with specific reactions are presented in this study. Actin was used to show presence of proteins in the lanes. No specific antibody was found for NOX3.
Fig. 2
Fig. 2
O2•- and H2O2 generation by NOX/DUOX cell lines. NOX activity was activated/induced as described in methods. Specificity of the signal was confirmed using SOD, catalase and DPI. (A) Rate of H2O2 production measured with the Amplex® Red/HRP system; (B) Rate of O2•- measured with WST-1 probe. Data are shown in pmol per minute for 50,000 cells, calculated from a H2O2 standard curve for Amplex/red HRP and using the Beer-Lambert Law with ϵ440nm 37×103 M−1cm−1 for WST-1. (C) H2O2 levels measured by ROS-Glo. Data are shown in pmol per 50,000 cells, calculated from a H2O2 standard curve; (D) Oxidant production as measured with the L-012/HRP system. Data are shown in relative unit of emitted light for 50,000 cells. Data are presented as mean ± SD of three independent experiments performed in triplicates. (For interpretation of the references to color in this figure legend, the reader is referred to the Web version of this article).
Fig. 3
Fig. 3
Chemical structure of reported NOX inhibitors used in this study.
Fig. 4
Fig. 4
Concentration-response of reported NOX inhibitors in NOX-dependent assays. (A) The inhibitory activity of serial dilutions of compounds was measured on NOX expressing cells using the Amplex® Red/HRP (A) and the WST-1 assays (B). Data were normalized to control (DMSO) and fitted to a sigmoidal dose-response curve using GraphPad. Calculated IC50 values are reported in Table 2. Data are presented as mean ± SD of n = 3 separate experiments. (For interpretation of the references to color in this figure legend, the reader is referred to the Web version of this article.)
Fig. 5
Fig. 5
Concentration-response of reported NOX inhibitors in NOX-independent assays Antioxidant capacity of compounds in the absence of cell-derived NOX was evaluated using (A) H2O2 (10 μM) using CBA (brown) and Amplex® Red/HRP (purple) and (B) using direct scavenging of the free radical DPPH. Data were normalized to control (DMSO) and fitted to a sigmoidal dose-response curve using GraphPad. Calculated IC50 values are reported in Table 3. Data are presented as mean of three independent experiment ± SD. (For interpretation of the references to color in this figure legend, the reader is referred to the Web version of this article.)
Fig. 6
Fig. 6
Oxygen consumption in human neutrophils and tetracycline induced NOX4-expressing cells. (A) Representative pattern of oxygen consumption by human neutrophils. Each point of the curve represents the mean of quadruplicates ± SD (B) Percent of inhibition of NOX2-dependent OC by the compounds used in this study. (C) Representative pattern of oxygen consumption by NOX4-expressing HEK293 T-rex cells at basal level and induced by tetracycline (TC). Each point of the curve represents the mean of quadruplicates ± SD. (D) Percent of inhibition of NOX-dependent OC by the compounds used in this study. Data are presented as mean ± SD of minimum three separate experiments and Wilcoxon tests are shown vs. DMSO (ns: p > 0.05; *: p ≤ 0.05; **: p ≤ 0.01; ***: p ≤ 0.001). aIndicates that interference of the tested compound with the reagent was observed (cytotoxicity) potentially obscuring a real pharmacological effect.
Fig. 7
Fig. 7
O2•- and H2O2 generation by NOX2 and NOX5 membrane fractions: Representative curves and quantification of the rate of O2•- and H2O2 production obtained with membrane particulate fractions using a reconstituted NOX2 system comprising purified PLB-985 membranes and recombinant Rac GTPase and a p47-p67 chimeric protein (A, E), and in the NOX5 system comprising purified membranes of HEK293 cells overexpressing NOX5 in controlled high Ca2+ (700 μM) (C, G) using WST-1 (A,C) and CBA (E; G). In both systems and with both probes reaction was initiated by addition of NADPH. Specificity of the signal was confirmed using DPI, SOD or catalase. Quantification of the rate of O2•- (B, D) and H2O2 production (F, H). Oxidant formation is expressed in pmol per min per pmol of cytochrome b558 calculated for the NOX2 system as described [21]. As NOX5 concentration was not measurable in membrane fractions, oxidant formation is expressed in pmol per min per total amount of membrane proteins. Data are presented as mean ± SD of n = 3 separate experiments and Welch's tests are shown vs. activated membranes by NADPH (ns: p > 0.05; *: p ≤ 0.05; **: p ≤ 0.01; ***: p ≤ 0.001).
Fig. 8
Fig. 8
Impact of reported NOX inhibitors on O2•- and H2O2 generation in NOX2 and NOX5 membrane fractions: The inhibitory activity of compounds at indicated concentrations was measured on NOX2 membranes (A, C) and NOX5 membranes (B, D) using WST-1 (A, B) and CBA (C, D). Data are presented as mean ± SD of minimum three separate experiments and Welch's tests are shown vs. DMSO (ns: p > 0.05; *: p ≤ 0.05; **: p ≤ 0.01; ***: p ≤ 0.001).
Supplementary figure 1
Representative curves of the signals measured by L-012, Amplex® Red and WST-1 for each NOX-expressing cell lines. The signal was induced by PMA 100 nM (NOX1, NOX2), induced by pretreatment with tetracycline 1 μg/mL (NOX3, NOX4) and activated with PMA 100 nM/ionomycin 1 μM (NOX5, DUOX1, DUOX2) and measured for 1,500 s.
Supplementary figure 2
Detection of low levels of O2•- by NOX4. NOX4 expression was induced by addition of tetracycline 1 μg/mL for 24h and hydroethidine (HE) was added for 60 min. The specific product of HE by O2•- was measured by LC-MS-MS in cells and in the medium showing that NOX4 generates O2•- (A), which is released in the medium (B). Detection of O2•- by WST-1 similarly shows that NOX4 releases low levels of extracellular O2•-. Data are presented as mean ± SD of minimum three separate experiments with Mann Whitney test (ns: p>0.05; *: p≤0.05; **: p≤0.01; ***: p≤0.001). (C) Rate of O2•- measured with WST-1 probe in cells. Data are shown in pmol per minute for 50,000 cells, calculated using the Beer-Lambert Law with ϵ440 nm 37∙103 M-1.cm-1.
Supplementary figure 3
Concentration-response ofGKT13781in NOX1 and NOX4 expressing cells. (A) Chemical structure of GKT137831. The inhibitory activity of GKT137831 was measured using Amplex red/HRP (B) and WST-1 (C). GKT137831 inhibits the Amplex red/HRP signal even in the presence of H2O2 alone and is inactive on both NOX1 and NOX4 in the WST-1 assay. Data were normalized to control (DMSO) and fitted to a sigmoidal dose-response curve using GraphPad. Data are presented as mean of three experiments ± SD.
Supplementary figure 4
Concentration-dependent response of VAS2870 and Ebselen in NOX2 and NOX5 membranes. The inhibitory activity of VAS2870 (A) and Ebselen (C) was measured on NOX2 membranes and NOX5 membranes using WST-1. Precipitation of VAS2870 was visible as an increase of absorbance at 600 nm in the measured wells with the highest concentration of compound (B).

References

    1. Bedard K., Krause K.H. The NOX family of ROS-generating NADPH oxidases: physiology and pathophysiology. Physiol. Rev. 2007;87(1):245–313. - PubMed
    1. van der Weyden L., Arends M.J., Campbell A.D., Bald T., Wardle-Jones H., Griggs N., Velasco-Herrera M.D., Tuting T., Sansom O.J., Karp N.A., Clare S., Gleeson D., Ryder E., Galli A., Tuck E., Cambridge E.L., Voet T., Macaulay I.C., Wong K., Sanger Mouse Genetics P., Spiegel S., Speak A.O., Adams D.J. Genome-wide in vivo screen identifies novel host regulators of metastatic colonization. Nature. 2017;541(7636):233–236. - PMC - PubMed
    1. Casas A.I., Geuss E., Kleikers P.W.M., Mencl S., Herrmann A.M., Buendia I., Egea J., Meuth S.G., Lopez M.G., Kleinschnitz C., Schmidt H. NOX4-dependent neuronal autotoxicity and BBB breakdown explain the superior sensitivity of the brain to ischemic damage. Proc. Natl. Acad. Sci. U. S. A. 2017;114(46):12315–12320. - PMC - PubMed
    1. Di Marco E., Gray S.P., Kennedy K., Szyndralewiez C., Lyle A.N., Lassegue B., Griendling K.K., Cooper M.E., Schmidt H., Jandeleit-Dahm K.A.M. NOX4-derived reactive oxygen species limit fibrosis and inhibit proliferation of vascular smooth muscle cells in diabetic atherosclerosis. Free Radic. Biol. Med. 2016;97:556–567. - PMC - PubMed
    1. Altenhofer S., Radermacher K.A., Kleikers P.W., Wingler K., Schmidt H.H. Evolution of NADPH oxidase inhibitors: selectivity and mechanisms for target engagement. Antioxidants Redox Signal. 2015;23(5):406–427. - PMC - PubMed

Publication types

MeSH terms