. 2019 Jul 20;24(14):2638.
doi: 10.3390/molecules24142638.

Optimization of the Electro-Peroxone Process for Micropollutant Abatement Using Chemical Kinetic Approaches

Affiliations

Optimization of the Electro-Peroxone Process for Micropollutant Abatement Using Chemical Kinetic Approaches

Huijiao Wang et al. Molecules. .

Abstract

The electro-peroxone (E-peroxone) process is an emerging electrocatalytic ozonation process that is enabled by in situ producing hydrogen peroxide (H2O2) from cathodic oxygen reduction during ozonation. The in situ-generated H2O2 can then promote ozone (O3) transformation to hydroxyl radicals (•OH), and thus enhance the abatement of ozone-refractory pollutants compared to conventional ozonation. In this study, a chemical kinetic model was employed to simulate micropollutant abatement during the E-peroxone treatment of various water matrices (surface water, secondary wastewater effluent, and groundwater). Results show that by following the O3 and •OH exposures during the E-peroxone process, the abatement kinetics of a variety of model micropollutants could be well predicted using the model. In addition, the effect of specific ozone doses on micropollutant abatement efficiencies could be quantitatively evaluated using the model. Therefore, the chemical kinetic model can be used to reveal important information for the design and optimization of the treatment time and ozone doses of the E-peroxone process for cost-effective micropollutant abatement in water and wastewater treatment.

Keywords: electro-peroxone; electrocatalytic ozonation; model; ozone; pharmaceutical; water treatment.


Conflict of interest statement

The authors declare no conflict of interest.

Figures

Figure 1
Figure 1
Abatement of (a) diclofenac (DA), (b) gemfibrozil (GF), (c) bezafibrate (BF), (d) ibuprofen (IBU), (e) clofibric acid (CA), and (f) para-chlorobenzoic acid (p-CBA) during the electro-peroxone (E-peroxone) treatment of surface water at different currents (0 mA (ozonation), 10 mA, 30 mA, and 50 mA). The symbols in the plot represent experimental data, and short dash lines are model predictions. (Reaction conditions: Each micropollutant concentration ~150 μg/L, and specific ozone dose = 1.5 mg O3/mg dissolved organic carbon (DOC)).
Figure 2
Figure 2
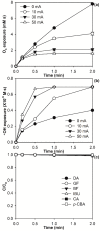
(a) Ozone (O3) and (b) hydroxyl radicals (•OH) exposures during the E-peroxone treatment of surface water at different currents (0 mA (ozonation), 10 mA, 30 mA, and 50 mA), and (c) micropollutant abatements from surface water by electrolysis at the current of 30 mA. (Reaction conditions: Each micropollutant concentration ~150 μg/L, and specific ozone dose = 1.5 mg O3/mg dissolved organic carbon (DOC)).
Figure 3
Figure 3
Abatement of (a) diclofenac (DA), (b) gemfibrozil (GF), (c) bezafibrate (BF), (d) ibuprofen (IBU), (e) clofibric acid (CA), and (f) para-chlorobenzoic acid (p-CBA) during the E-peroxone treatment of surface water at different specific ozone dose (0.5, 1.0, and 1.5 mg O3/mg dissolved organic carbon (DOC)). The symbols in the plot represent experimental data, and short dash lines stand for model predictions. (Reaction conditions: Each micropollutant concentration ~150 μg/L, and current = 30 mA).
Figure 4
Figure 4
Linear regression of (a) O3 and (b) •OH exposure as a function of specific ozone (O3) dose during E-peroxone treatment of surface water, secondary effluent, and groundwater. (Reaction conditions: Each micropollutant concentration ~150 μg/L, and current = 30 mA).
Figure 5
Figure 5
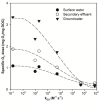
Abatement efficiency of (ac) gemfibrozil (GF) and (df) clofibric acid (CA) as a function of their Oke values observed during the E-peroxone treatment of (a,d) surface water, (b,e) secondary effluent, and (c,f) groundwater with varying specific ozone (O3) doses. The symbols in the plots represent experimentally measured results; the solid lines are model simulation using Equation (3). The inset plot shows linear regression between specific O3 dose and the Oke value observed for selected micropollutant during the E-peroxone process. (Reaction conditions: Current = 30 mA, and each micropollutant concentration ~150 μg/L).
Figure 6
Figure 6
Model-predicted specific ozone (O3) dose required to achieve 90% abatement efficiency of the selected micropollutants during the E-peroxone treatment of surface water, secondary effluent, and groundwater.
Figure 7
Figure 7
The required specific ozone (O3) dose as a function of p-CBA abatement efficiency during the E-peroxone treatment of different water matrices. Results were obtained based on the linear regression equation of specific O3 doses with Oke values in Figure S6j–l inset plots, as well as the chemical kinetic model.

References

    1. Li X., Wang Y., Yuan S., Li Z., Wang B., Huang J., Deng S., Yu G. Degradation of the anti-inflammatory drug ibuprofen by electro-peroxone process. Water Res. 2014;63:81–93. doi: 10.1016/j.watres.2014.06.009. - DOI - PubMed
    1. Li X., Wang Y., Zhao J., Wang H., Wang B., Huang J., Deng S., Yu G. Electro-peroxone treatment of the antidepressant venlafaxine: Operational parameters and mechanism. J. Hazard. Mater. 2015;300:298–306. doi: 10.1016/j.jhazmat.2015.07.004. - DOI - PubMed
    1. Yao W., Wang X., Yang H., Yu G., Deng S., Huang J., Wang B., Wang Y. Removal of pharmaceuticals from secondary effluents by an electro-peroxone process. Water Res. 2016;88:826–835. doi: 10.1016/j.watres.2015.11.024. - DOI - PubMed
    1. Guo W.Q., Wu Q.L., Zhou X.J., Cao H.O., Du J.S., Yin R.L., Ren N.Q. Enhanced amoxicillin treatment using the electro-peroxone process: Key factors and degradation mechanism. Rsc Adv. 2015;5:52695–52702. doi: 10.1039/C5RA07951A. - DOI
    1. Nawrocki J. Catalytic ozonation in water: Controversies and questions. Discussion paper. Appl. Catal. B Environ. 2013;142:465–471. doi: 10.1016/j.apcatb.2013.05.061. - DOI