. 2019 Jul 20;9(7):293.
doi: 10.3390/biom9070293.

Genome-Wide Identification and Expression Profiling of CBL-CIPK Gene Family in Pineapple (Ananas comosus) and the Role of Ac CBL1 in Abiotic and Biotic Stress Response

Affiliations

Genome-Wide Identification and Expression Profiling of CBL-CIPK Gene Family in Pineapple (Ananas comosus) and the Role of Ac CBL1 in Abiotic and Biotic Stress Response

Mohammad Aslam et al. Biomolecules. .

Abstract

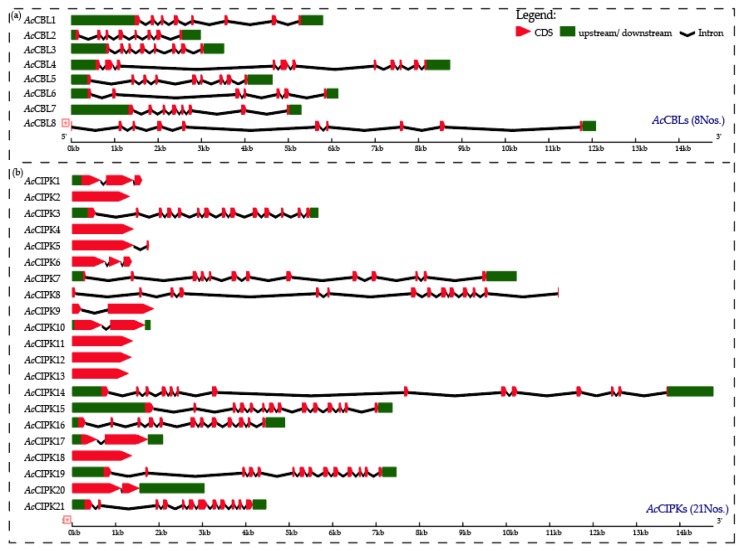
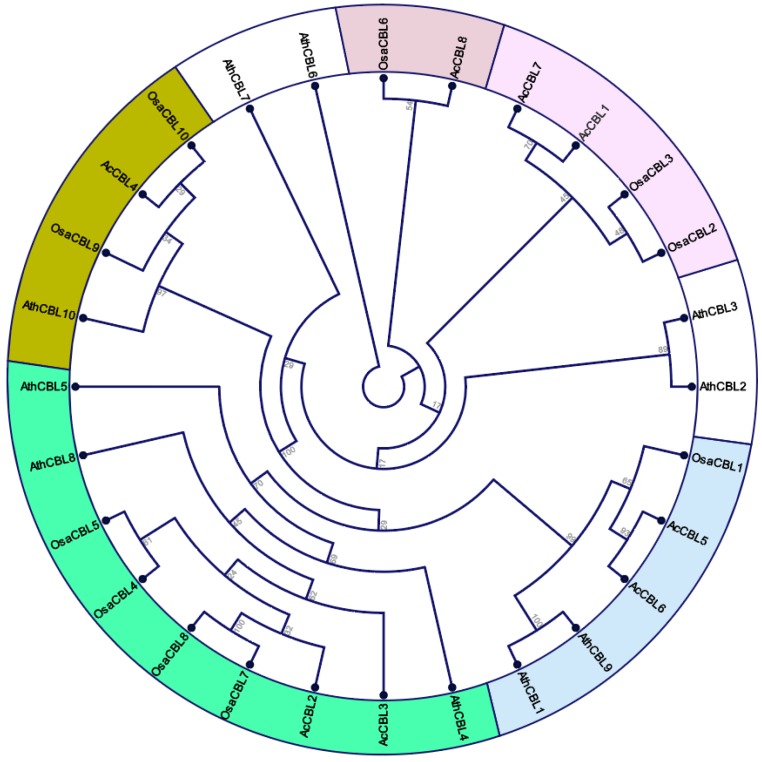
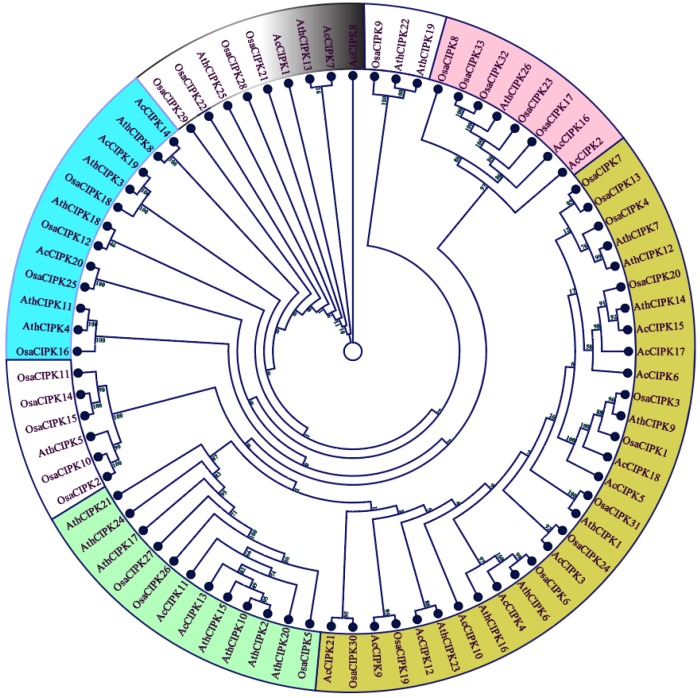
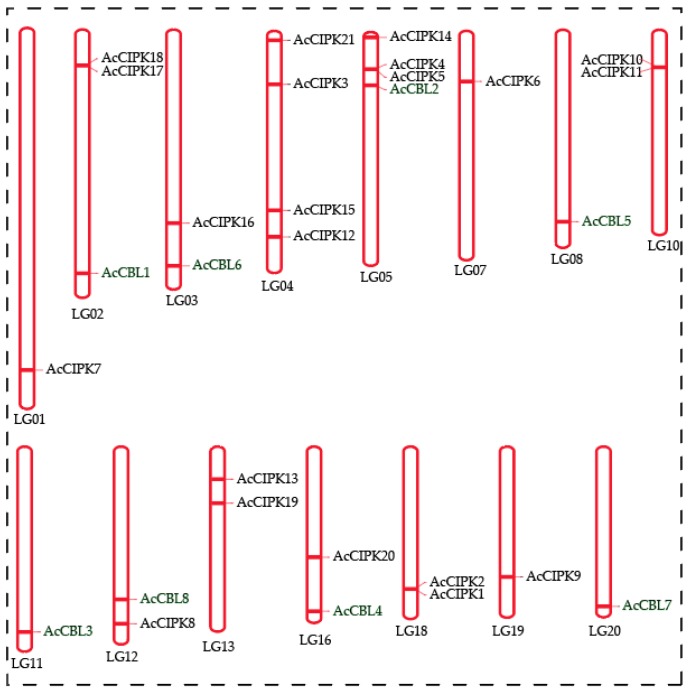
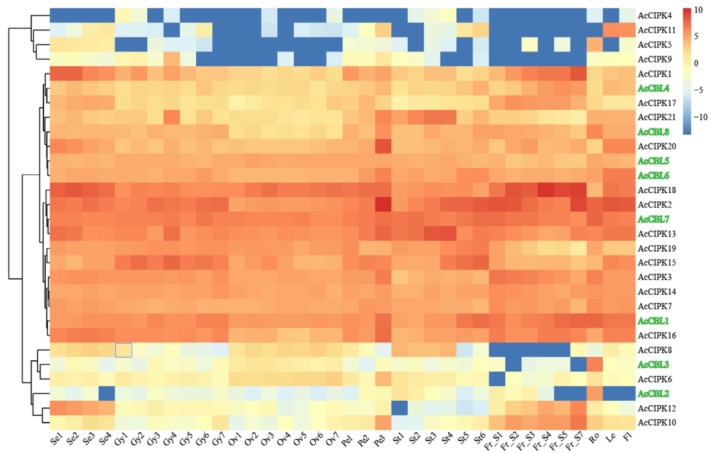
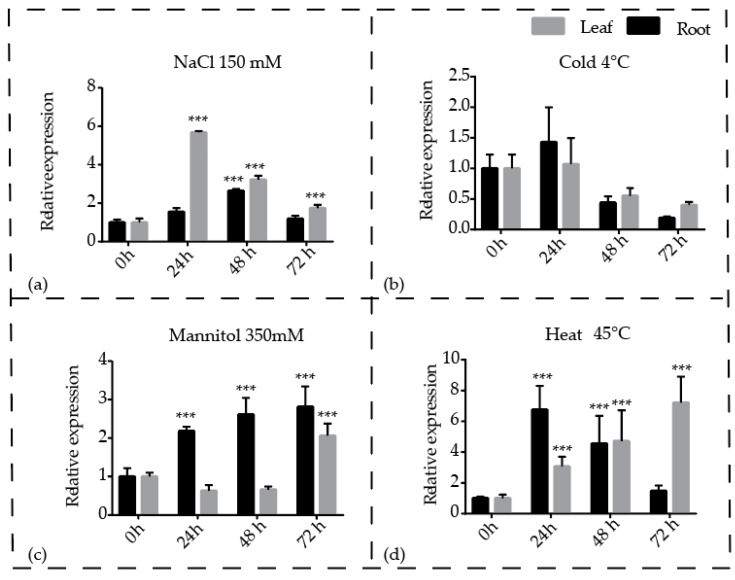
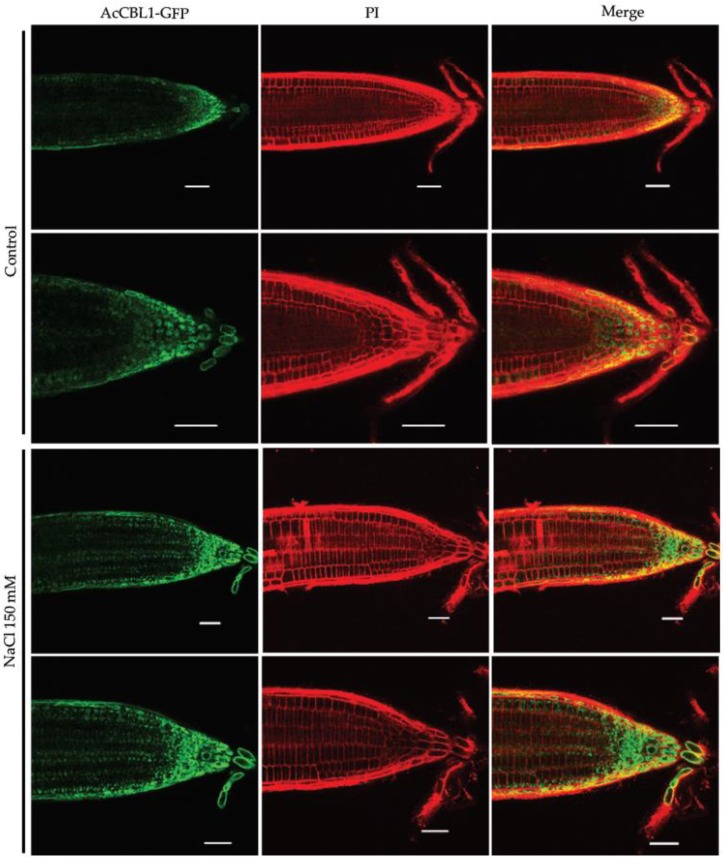
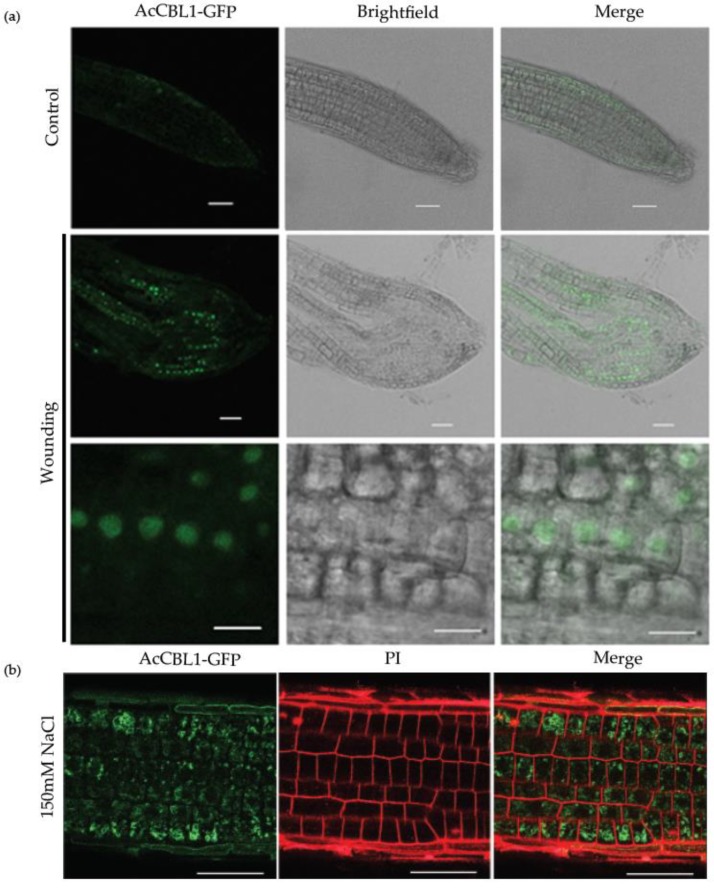
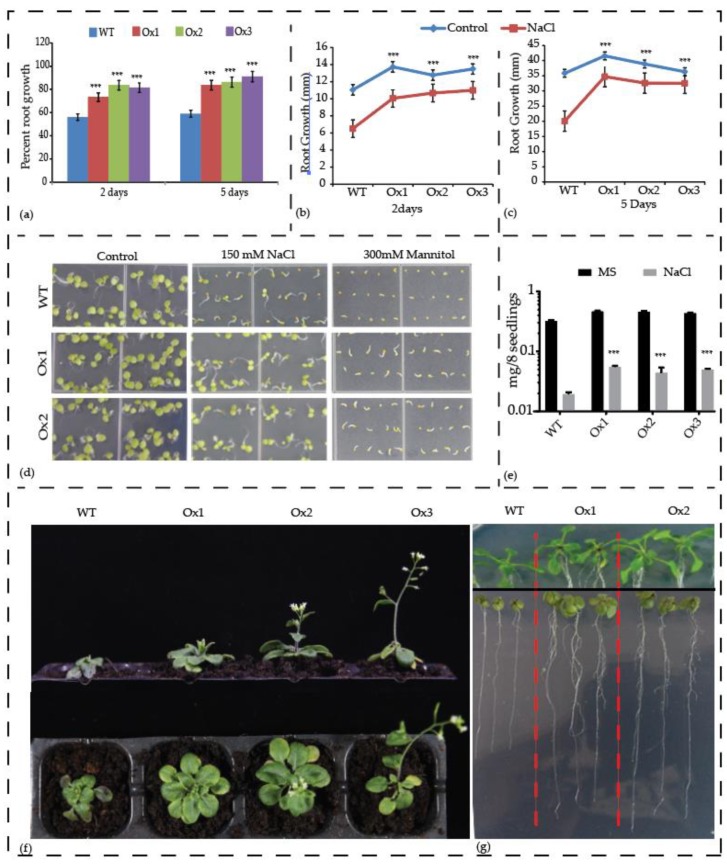
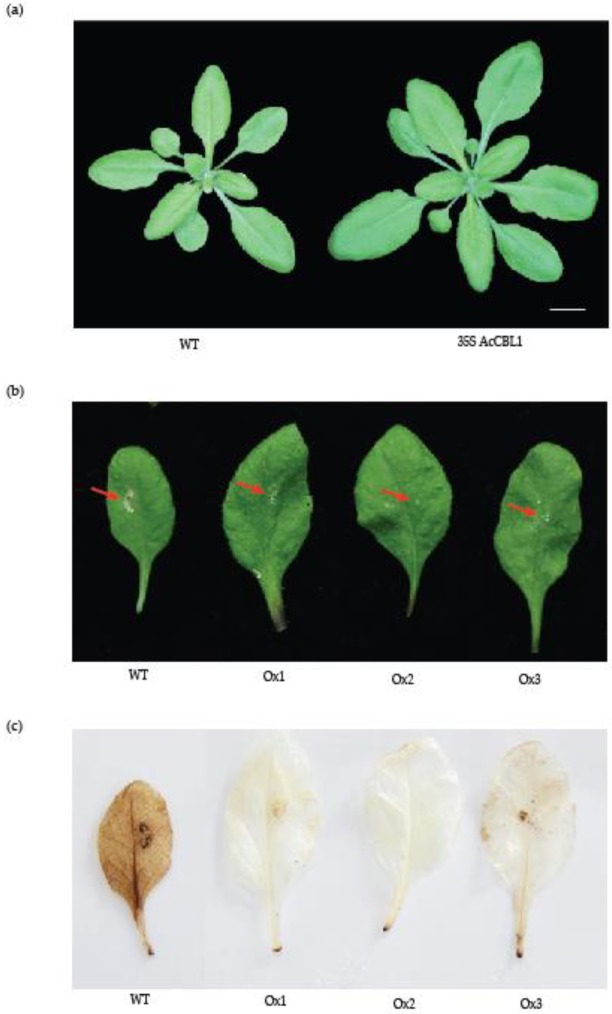
Ca2+ serves as a ubiquitous second messenger regulating several aspects of plant growth and development. A group of unique calcium sensor proteins, calcineurin B-like (CBL), interact with CBL-interacting protein kinases (CIPKs) to decode the Ca2+ signature inside the cell. Although CBL-CIPK signaling toolkit has been shown to play significant roles in the responses to numerous stresses in different plants, the information about pineapple CBL-CIPK remains obscure. In the present study, a total of eight AcCBL and 21 AcCIPK genes were identified genome-wide in pineapple. The identified genes were renamed on the basis of gene ID in ascending order and phylogenetic analysis divided into five groups. Transcriptomic data analysis showed that AcCBL and AcCIPK genes were expressed differentially in different tissues. Further, the expression analysis of AcCBL1 in different tissues showed significant changes under various abiotic stimuli. Additionally, the ectopic expression of AcCBL1 in Arabidopsis resulted in enhanced tolerance to salinity, osmotic, and fungal stress. The present study revealed the crucial contribution of the CBL-CIPK gene in various biological and physiological processes in pineapple.

Keywords: CBL-CIPK; biotic stress; genome-wide; pineapple; salt tolerance.


Conflict of interest statement

The authors declare that they have no competing interests.

Figures

Figure 1
Figure 1
Exon-intron structure of pineapple CBL-CIPK genes. (a) Exon-intron structure of pineapple CBL genes (b) exon-intron structure of pineapple CIPK genes; green boxes indicate untranslated 5′- and 3′-regions; red boxes indicate exons; black lines indicate introns. Prefix ‘Ac’ indicates Ananas comosus.
Figure 2
Figure 2
Phylogenetic tree depicting the relationships among CBL proteins from pineapple, rice, and Arabidopsis. The different colored arcs indicate different subgroups. Prefix ‘Ath’, Osa, and ‘Ac’ indicate CBL proteins from Arabidopsis, Oryza sativa, and Ananas comosus respectively.
Figure 3
Figure 3
Phylogenetic tree depicting the relationships among CIPK proteins from pineapple, rice, and Arabidopsis. The different colored arcs indicate different subgroups. Prefix ‘Ath’, Osa, and ‘Ac’ indicate CBL proteins from Arabidopsis, Oryza sativa, and Ananas comosus respectively.
Figure 4
Figure 4
Chromosomal locations of pineapple CBL and CIPK genes. The 8 CBL and 21CIPK genes of pineapple were mapped to different chromosomes using MapChart.
Figure 5
Figure 5
Expression profiles of the pineapple CBL and CIPK genes. Hierarchical clustering of expression profiles of pineapple CBL-CIPK genes in different organs and developmental stages. Red color indicates high levels of transcript abundance, and blue color indicates low transcript abundance. The color scale is shown at right side of the figure. Sample details are mentioned at the bottom of each lane: sepal Se1–Se4, gynoecium Gy1- Gy7, ovule Ov1–Ov7, petal Pe1–Pe3, stamen St1–St6, fruit ‘Fr_S1–Fr_S7’, root ‘Ro’, leaf ‘Le’, and flower ‘Fl’. Where ‘S’ is the abbreviation for ‘stage’. Pineapple CBL gene names are represented in green color.
Figure 6
Figure 6
Expression profiles of the pineapple CBL1 gene in response to different stress treatments. qRT-PCR of CBL1 gene in at different time point (0 h, 24 h, 48 h, and 72 h) and samples (leaf and root) after (a) salt (NaCl 150 mM), (b) cold (4 °C) stress, (c) osmotic (Mnnitol 350 mM) stress, and (d) heat (45 °C) stress. Data were normalized to EF1a gene. Vertical bars indicate SE and *** indicates significantly different values compared to control treatment (p < 0.001). All experiments were performed with three technical and three biological repeats.
Figure 7
Figure 7
AcCBL1-GFP localizes in cytosol under salt stress. Confocal analyses show AcCBL1-GFP localization in the cytosol when of 5-day-old seedlings grown in the standard conditions were transferred in a medium containing 150 mM NaCl. GFP fluorescence is represented in green and propidium iodide (PI)fluorescence channel is represented in red. Scale bars = 50 μm.
Figure 8
Figure 8
AcCBL1-GFP translocalizes to nucleus from cytosol after injury. (a) Localization AcCBL1-GFP in the nucleus when the 7-day-old root of transgenic seedlings is injured. (b) AcCBL1-GFP localization in cytosol after salt stress. GFP fluorescence is represented in green and PI fluorescence channel is represented in red. Scale bars = 50 μm.
Figure 9
Figure 9
Overexpression of AcCBL1 results in resistance to salinity and osmotic stress. (a) Percent root growth in 5-day-old wild-type and AcCBL1 overexpressing seedlings transferred to new plates supplemented with 150 mm NaCl and analyzed after 2 days and 5 days of transfer. (b) Primary root growth after 2 days and (c) primary root growth after 5 days and (d) phenotype of 7-day-old AcCBL1 overexpressing seedlings germinated under salinity (150 mM NaCl) and osmotic stress (300 mM mannitol). (e) Fresh weight of 5-day-old wild-type and AcCBL1 overexpressing lines grown for an additional 10 days on 150 mM NaCl after transfer to new plate and analysis. (f) 15-day-old seedlings were subjected to saline irrigation with 250 mM NaCl for an additional 10 days and then photographed. (g) Seedlings grown for 5 days and transferred to new plate with (lower panel), or without (upper panel), 150 mM NaCl for 10 additional days and photographed. Vertical bars represent ± S.E., and *** indicates significantly different values between treatments (p < 0.001).
Figure 10
Figure 10
Overexpression of AcCBL1 results in resistance to biotic stress. (a) Morphology of four-week-old wild-type (Col-0) and AcCBL1 overexpressing plant. (b) Damage in leaves by exposure to fungus (Sclerotinia sclerotiorum) to mature rosette leaves of wild-type and 3 different lines (Ox1, Ox2, and Ox3) of AcCBL1 overexpressing plants for 24 h. (c) Detection of H2O2 by DAB staining in leaves of wild-type (Col-0) and AcCBL1 overexpressing lines after 24 h infection of fungus (Sclerotinia sclerotiorum). The brown color reflects the reactive oxygen species (ROS) accumulation after the fungus treatment. Scale bar = 1 cm.

References

    1. Dodd A.N., Kudla J., Sanders D. The language of calcium signaling. Annu. Rev. Plant Biol. 2010;61:593–620. doi: 10.1146/annurev-arplant-070109-104628. - DOI - PubMed
    1. Tang R.J., Luan S. Regulation of calcium and magnesium homeostasis in plants: From transporters to signaling network. Curr. Opin. Plant Biol. 2017;39:97–105. doi: 10.1016/j.pbi.2017.06.009. - DOI - PubMed
    1. Zhu J.K. Abiotic Stress Signaling and Responses in Plants. Cell. 2016;167:313–324. doi: 10.1016/j.cell.2016.08.029. - DOI - PMC - PubMed
    1. Costa A., Navazio L., Szabo I. The contribution of organelles to plant intracellular Calcium signalling. J. Exp. Bot. 2018 doi: 10.1093/jxb/ery185. - DOI - PubMed
    1. Tuteja N., Mahajan S. Calcium signaling network in plants: An overview. Plant Signal. Behav. 2007;2:79–85. doi: 10.4161/psb.2.2.4176. - DOI - PMC - PubMed

Publication types

MeSH terms

LinkOut - more resources