. 2019 Sep 26;134(13):1072-1083.
doi: 10.1182/blood.2018888107. Epub 2019 Jul 22.

Antibiotics inhibit tumor and disease activity in cutaneous T-cell lymphoma

Affiliations

Antibiotics inhibit tumor and disease activity in cutaneous T-cell lymphoma

Lise M Lindahl et al. Blood. .

Abstract

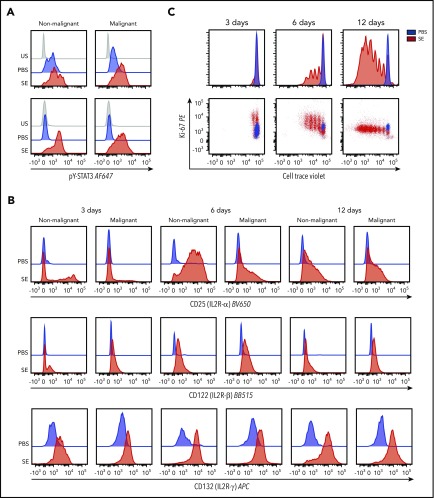
It has been proposed that CD4 T-cell responses to Staphylococcus aureus (SA) can inadvertently enhance neoplastic progression in models of skin cancer and cutaneous T-cell lymphoma (CTCL). In this prospective study, we explored the effect of transient antibiotic treatment on tumor cells and disease activity in 8 patients with advanced-stage CTCL. All patients experienced significant decrease in clinical symptoms in response to aggressive, transient antibiotic treatment. In some patients, clinical improvements lasted for more than 8 months. In 6 of 8 patients, a malignant T-cell clone could be identified in lesional skin, and a significant decrease in the fraction of malignant T cells was observed following antibiotics but an otherwise unchanged treatment regimen. Immunohistochemistry, global messenger RNA expression, and cell-signaling pathway analysis indicated that transient aggressive antibiotic therapy was associated with decreased expression of interleukin-2 high-affinity receptors (CD25), STAT3 signaling, and cell proliferation in lesional skin. In conclusion, this study provides novel evidence suggesting that aggressive antibiotic treatment inhibits malignant T cells in lesional skin. Thus, we provide a novel rationale for treatment of SA in advanced CTCL.


Conflict of interest statement

Conflict-of-interest disclosure: T.L. is employed both by Copenhagen University and by LEO Pharma A/S. J.C.B. has received advisory board honoraria from Takeda. The remaining authors declare no competing financial interests.

Figures

None
Graphical abstract
Figure 1.
Figure 1.
Effect of antibiotic therapy on visual tumors in a patient with CTCL. (A) The patient was diagnosed with MF in 2003 presenting patch/plaque lesions localized in the axillary skin area. (B-C) Despite intensive systemic and topical antitumor therapy, the disease progressed. (C) The patient developed severe sepsis and was treated with IV antibiotics (carbapenem). At this timepoint, the patient was in a critical condition and was not treated with CTCL-directed anticancer therapy. (D) An almost complete clearance of the tumor burden was observed after IV antibiotic therapy.
Figure 2.
Figure 2.
Treatment regimen, clinical response, proliferation index and expression of IL2R-α and pY-STAT3, and clonal T-cell populations in the skin lesions before and after antibiotic therapy. (A) Eight CTCL patients were treated for 10 days with IV antibiotics (cephalosporin and metronidazole) and subsequent oral treatment of 14 days with combined amoxicillin and clavulanate. (B) All patients had clinical improvement 2 months after antibiotic treatment. The mSWAT scores dropped after treatment (left). The mSWAT score before treatment differed among the included patients (left). (Right) The subjective patient self-reported evaluations of disease severity according to the VAS. (C-H) Immunohistochemistry of the proliferation index (Ki67 staining), and expression of IL2R-α and pY-STAT3 before and 2 months after initiation of antibiotic treatment in patients 1 and 2 (original magnification ×10). Stainings for patients 3 through 8 are presented in supplemental Figure 1. Images were obtained with a Leica DM2000 microscope equipped with a Leica DFC295 camera, magnification ×100 and LAS v4.6 acquisition software. (I) Sequencing the CDR3 of the TCR-β chain from gDNA from CTCL skin biopsies identified a dominant clonal T-cell population in 6 of 8 patients. The frequency of the most dominant TCR clonotype is depicted for each patient (numbered) before and 60 days after initiation of antibiotic treatment. The presence of a dominant T-cell population could not be demonstrated in patients 3 and 7 by TCR sequencing. mSWAT, modified Severity Weighted Assessment Tool; Pt., patient; VAS, visual analog scale.
Figure 3.
Figure 3.
Continued clinical response for 8 months after 4 weeks of antibiotic therapy. Two patients were followed for 8 months; they continued to respond clinically after the antibiotic treatment. Pt., patient.
Figure 4.
Figure 4.
STAT3 phosphorylation, IL-2R subunits expression, and proliferation of primary CTCL (SS) cells in the presence of SE. (A) STAT3 phosphorylation in malignant and nonmalignant T cells from cultured SS PBMC cultures in the presence of SE (ie, cultures of malignant T cells and bystander cells from 2 patients). Data from 5 additional patients are shown in supplemental Figure 4. (B) IL2R-α, IL2R-β, and IL2R-γ expression in primary malignant and nonmalignant T cells from cultured SS PBMCs in the presence of SE after 3, 6, and 12 days as described previously. (C) Proliferation of primary malignant T cells from cultured SS PBMCs in the presence or absence of SE after 3, 6, and 12 days. Data in panels B and C are representative of 2 patients. PBS, phosphate-buffered saline; SE, staphylococcal enterotoxin; US, unstimulated.
Figure 5.
Figure 5.
Global mRNA expression profiles, IL2RA and STAT3 expression, and changes of CTCL-related pathway, bio-function, and network activation after antibiotic therapy. (A) Heatmap and 2-way unsupervised hierarchical clustering based on the 1463 differentially expressed genes (1196 up- and 267 downregulated, more than twofold change, P < .05, q = 0.10) between lesional (patients 1-8) and skin from healthy controls (HC 1-6) before antibiotic treatment (day 0). Top row, the subject identification (8 patients and 6 HCs). The second from top row shows the time of sampling: before (0 d), 10 days (10 d), 1 month (1 m), and 2 months (2 m) after treatment. The healthy skin samples cluster to the right, and together with samples from patient 5-2m, patient 7-10d, patient 6-10d, and patient 6-1m, indicate partial normalization of the CTCL signature posttreatment. Gene expression values have been z scaled (mean = 0, var = 1) and are indicated in the heatmap as yellow (upregulated) or blue (downregulated). (B) RT-qPCR of the IL2RA and STAT3 expression in all patients before antibiotic treatment and at 10 days, 1 month, and 2 months, and in 6 HC. (C) Upstream analysis of IL-2 signaling and STAT3 activation, and bio-function activation z scores for neoplasia, proliferation, and inflammation before and 10 days, 1 month, and 2 months after treatment. (D) Activation of CTCL-involved signaling before and 10 days, 1 month, and 2 months after antibiotic treatment. The contrasts shown are CTCL vs HC at day 0 (CTCL/HC D0), and CTCL at 10 days, 1 month, and 2 months vs day 0 (paired analysis, CTCL D10-1m-2m/D0).

Comment in

References

    1. Girardi M, Heald PW, Wilson LD. The pathogenesis of mycosis fungoides. N Engl J Med. 2004;350(19):1978-1988. - PubMed
    1. Krejsgaard T, Lindahl LM, Mongan NP, et al. . Malignant inflammation in cutaneous T-cell lymphoma-a hostile takeover. Semin Immunopathol. 2017;39(3):269-282. - PMC - PubMed
    1. Vieyra-Garcia P, Crouch JD, O’Malley JT, et al. . Benign T cells drive clinical skin inflammation in cutaneous T cell lymphoma. [published online ahead of print January 10, 2019]. JCI Insight. 2019;4(1):124233. - PMC - PubMed
    1. Sommer VH, Clemmensen OJ, Nielsen O, et al. . In vivo activation of STAT3 in cutaneous T-cell lymphoma. Evidence for an antiapoptotic function of STAT3. Leukemia. 2004;18(7):1288-1295. - PubMed
    1. Pérez C, Mondéjar R, García-Díaz N, et al. . Advanced-stage Mycosis fungoides. Role of STAT3, NFKB and NFAT pathways. [published online ahead of print 3 May 2019]. Br J Dermatol.

Publication types

MeSH terms