. 2019 Jul 22;2(4):e201900425.
doi: 10.26508/lsa.201900425. Print 2019 Aug.

Stromal fibroblasts induce metastatic tumor cell clusters via epithelial-mesenchymal plasticity

Affiliations

Stromal fibroblasts induce metastatic tumor cell clusters via epithelial-mesenchymal plasticity

Yuko Matsumura et al. Life Sci Alliance. .

Abstract

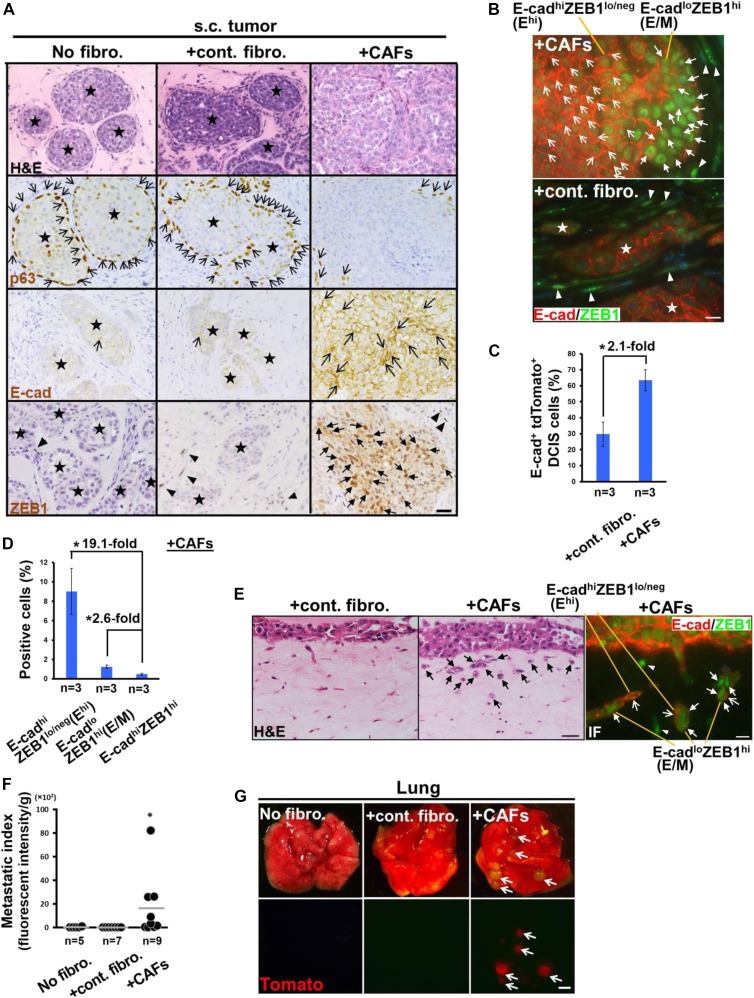
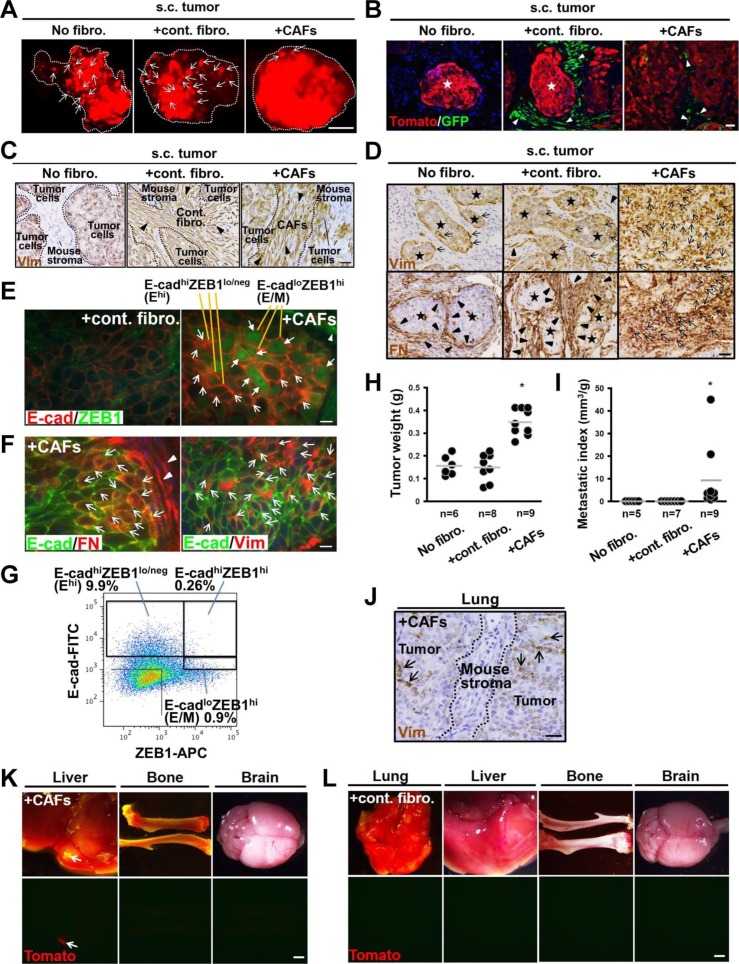
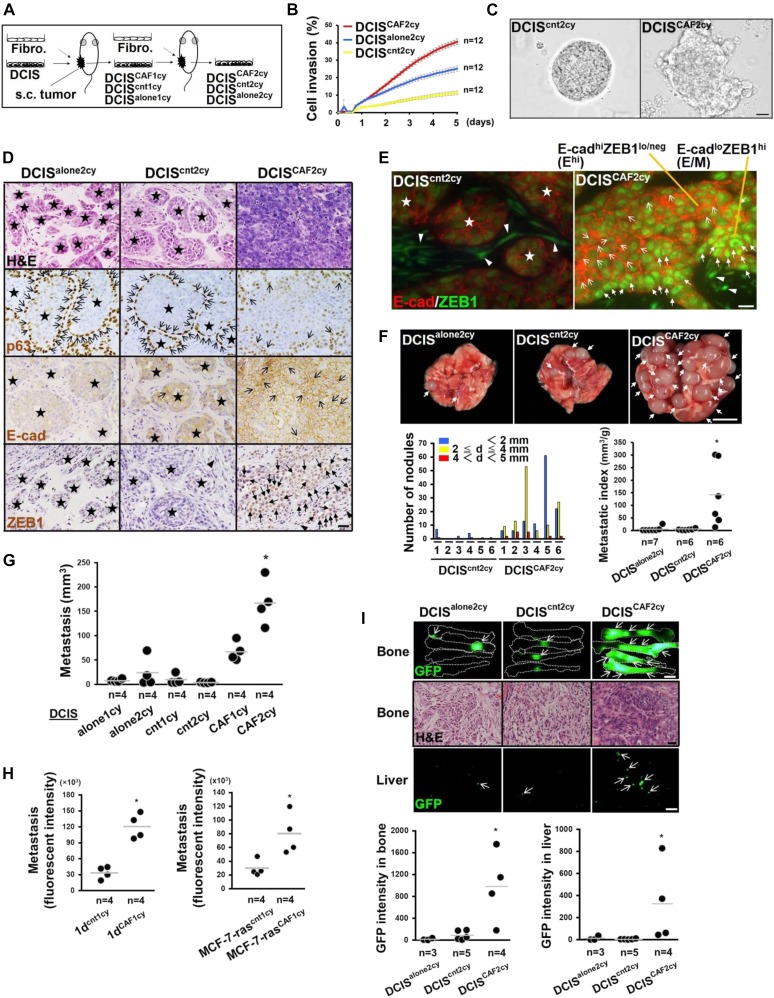
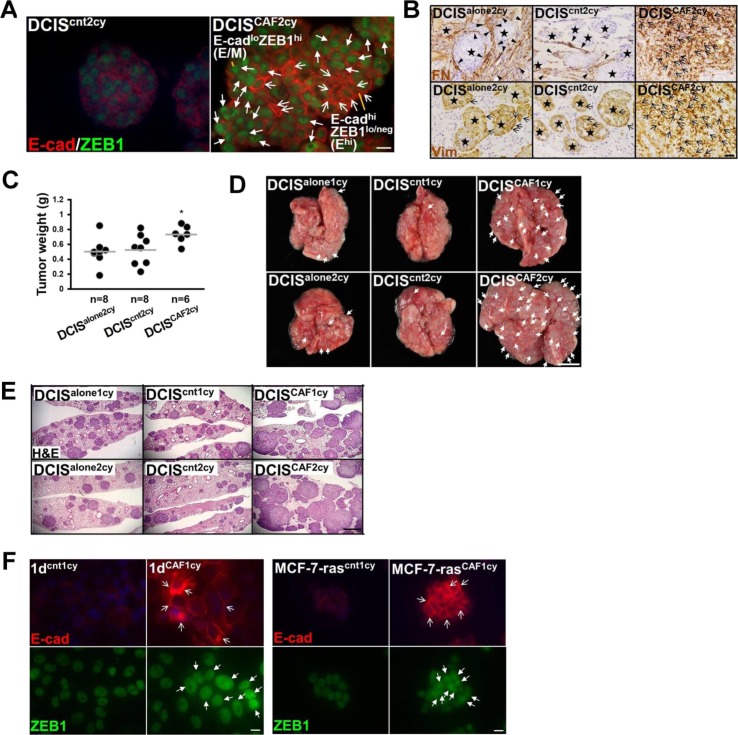
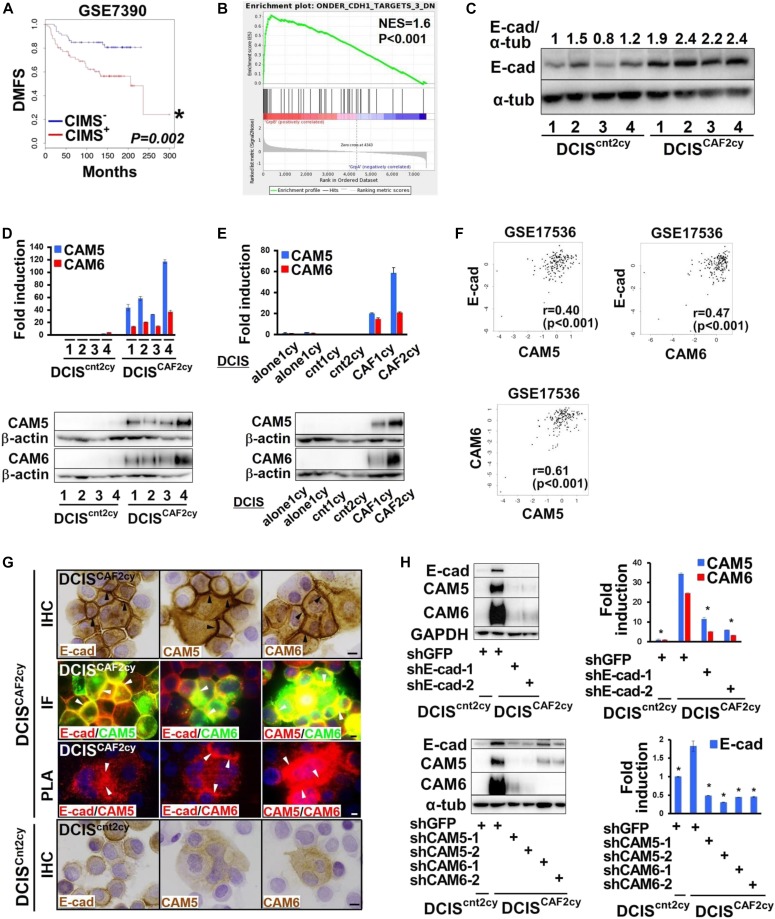
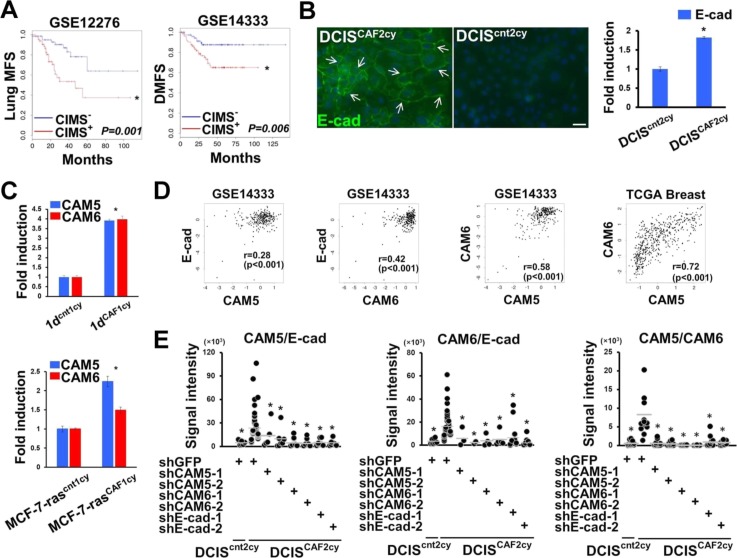
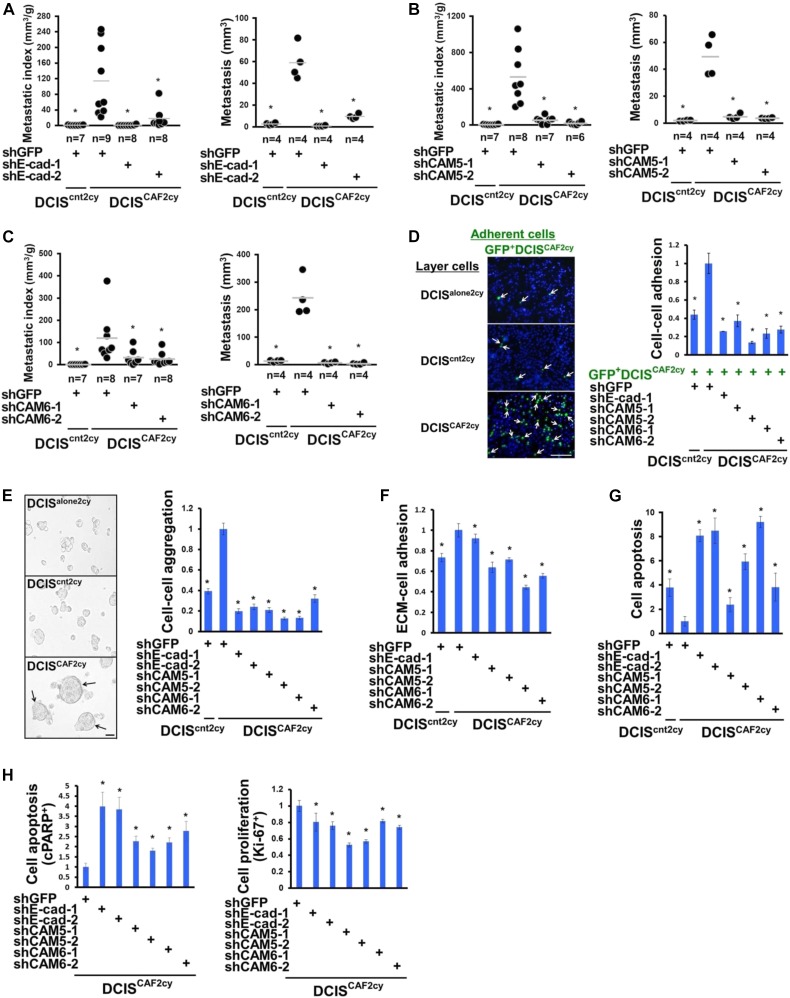
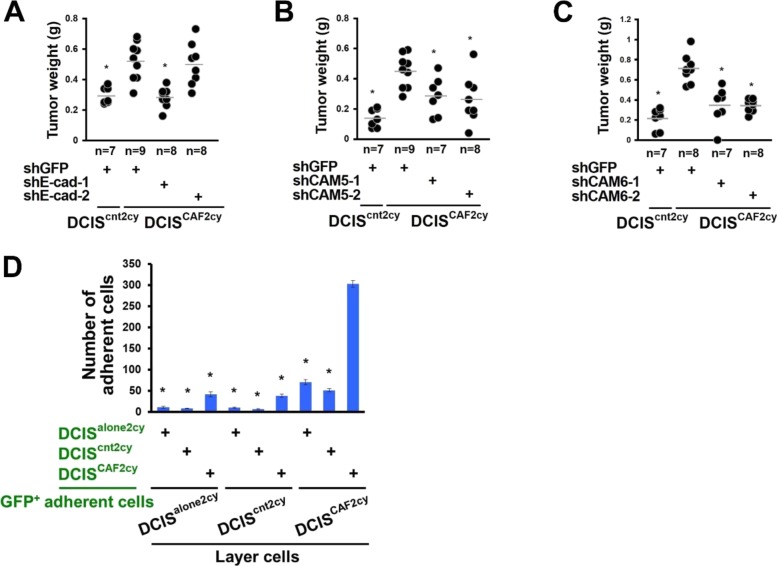
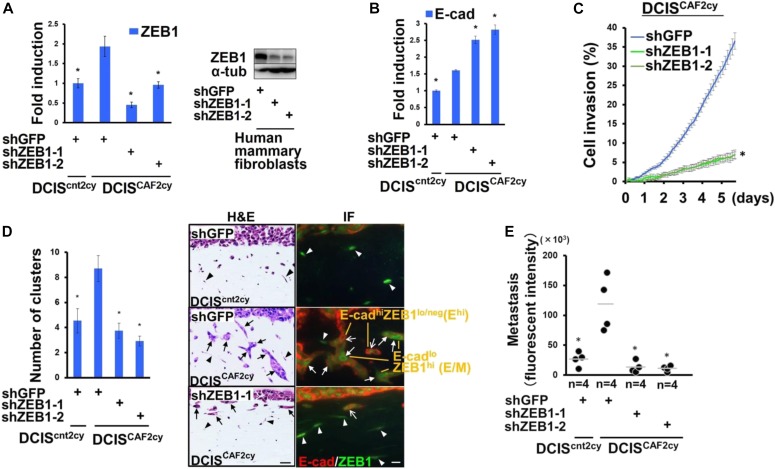
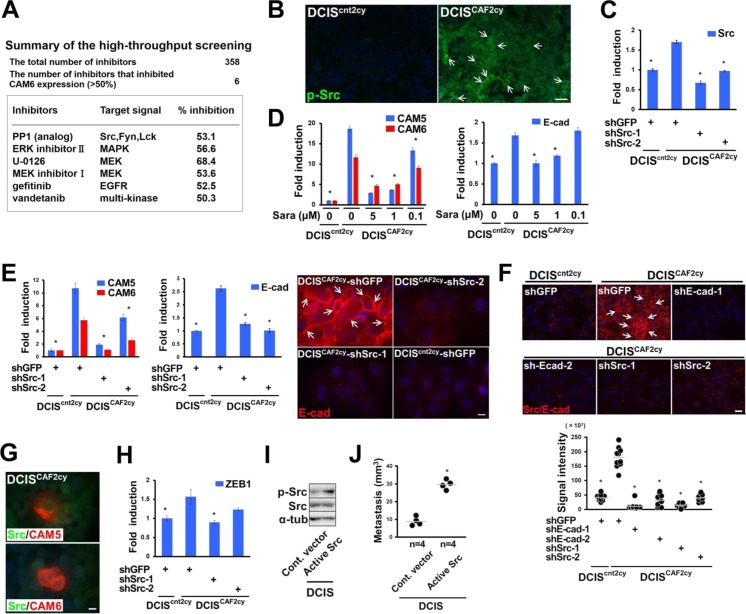
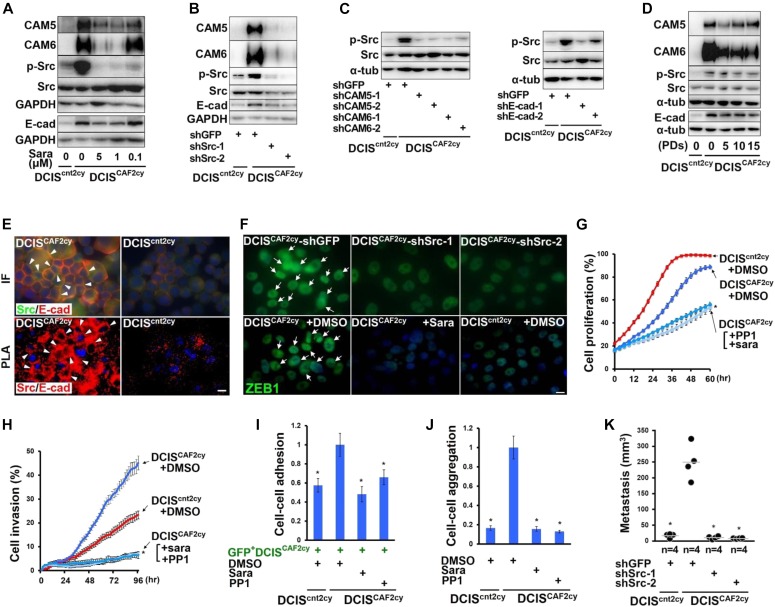
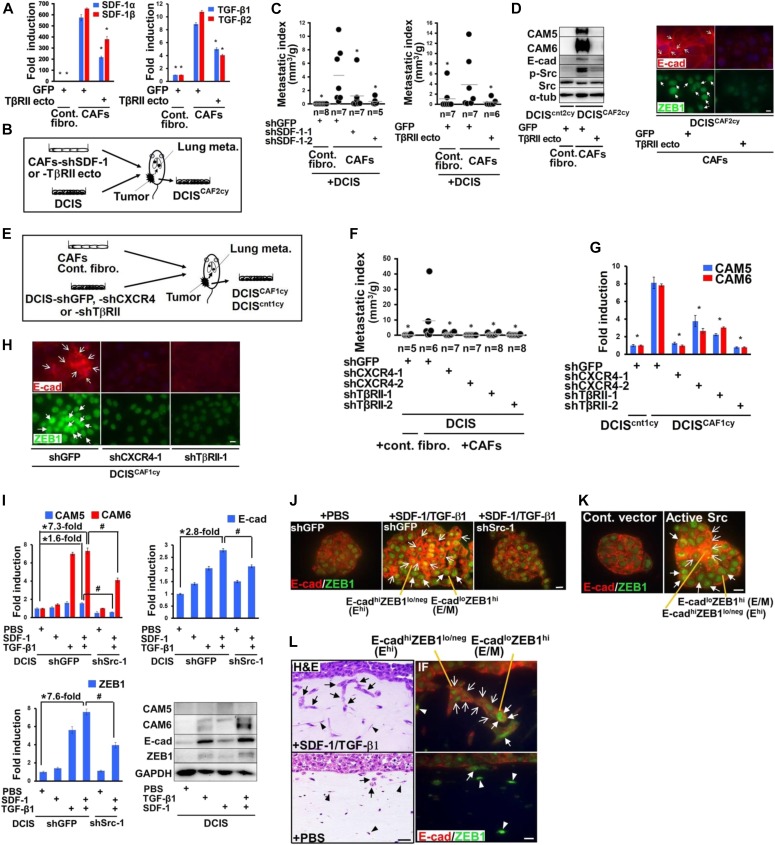
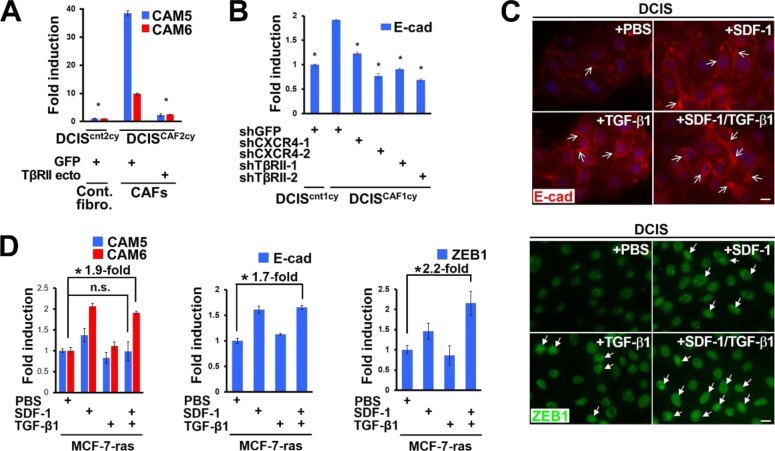
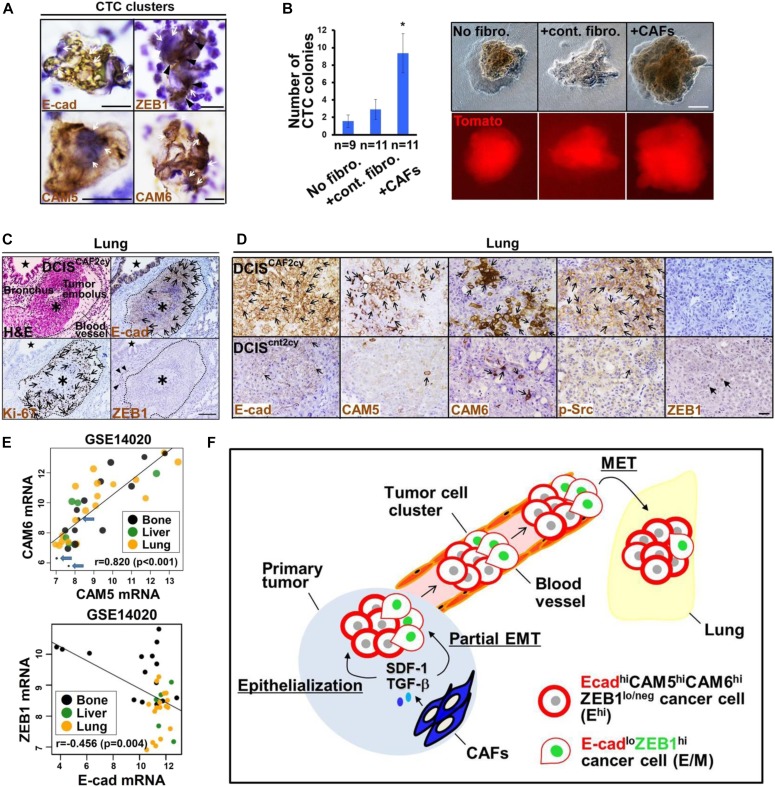
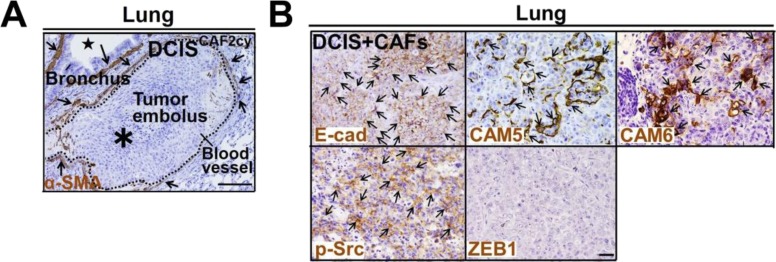
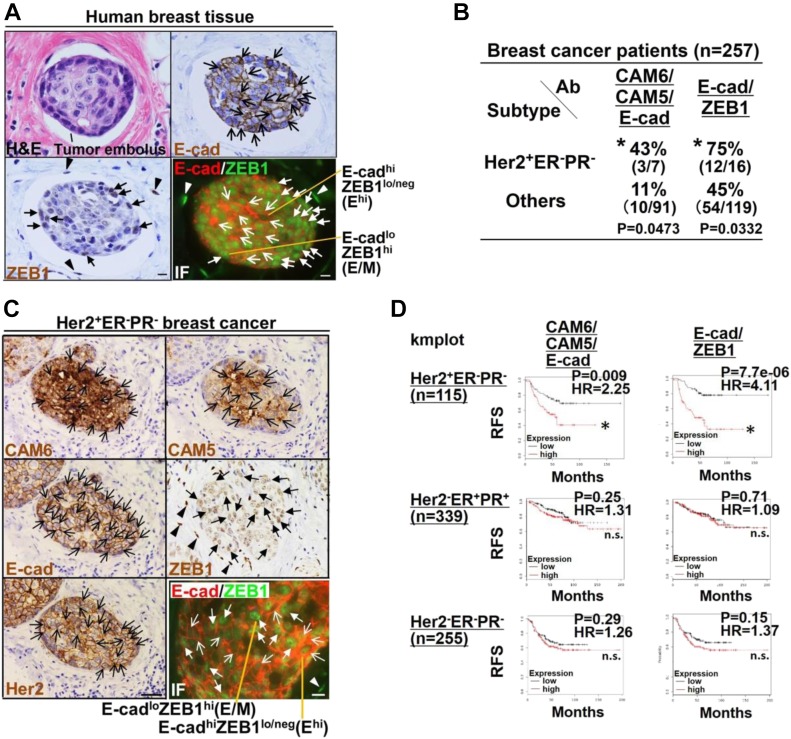
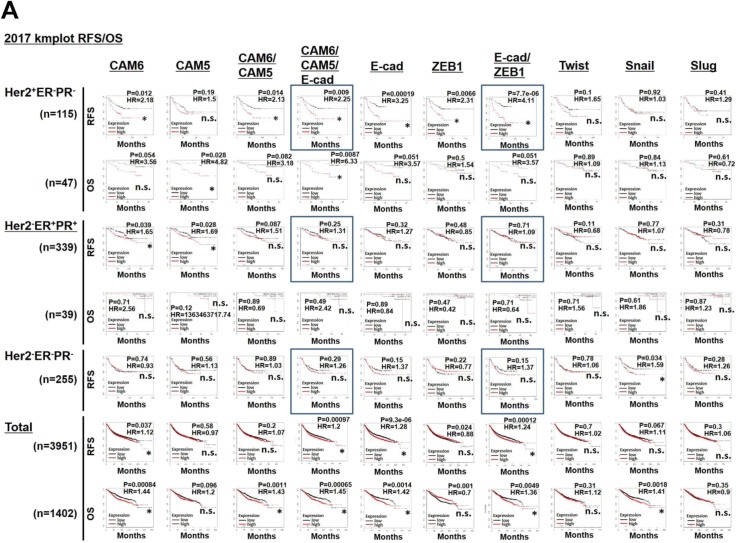
Emerging evidence supports the hypothesis that multicellular tumor clusters invade and seed metastasis. However, whether tumor-associated stroma induces epithelial-mesenchymal plasticity in tumor cell clusters, to promote invasion and metastasis, remains unknown. We demonstrate herein that carcinoma-associated fibroblasts (CAFs) frequently present in tumor stroma drive the formation of tumor cell clusters composed of two distinct cancer cell populations, one in a highly epithelial (E-cadherinhiZEB1lo/neg: Ehi) state and another in a hybrid epithelial/mesenchymal (E-cadherinloZEB1hi: E/M) state. The Ehi cells highly express oncogenic cell-cell adhesion molecules, such as carcinoembryonic antigen-related cell adhesion molecule 5 (CEACAM5) and CEACAM6 that associate with E-cadherin, resulting in increased tumor cell cluster formation and metastatic seeding. The E/M cells also retain associations with Ehi cells, which follow the E/M cells leading to collective invasion. CAF-produced stromal cell-derived factor 1 and transforming growth factor-β confer the Ehi and E/M states as well as invasive and metastatic traits via Src activation in apposed human breast tumor cells. Taken together, these findings indicate that invasive and metastatic tumor cell clusters are induced by CAFs via epithelial-mesenchymal plasticity.


Conflict of interest statement

The authors declare that they have no conflict of interest.

Figures

Figure 1.
Figure 1.. CAF-induced breast carcinoma cell clusters with the Ehi and E/M states, collective invasion, and metastasis.
(A) The sections were prepared from 21-d-old DCIS tumor xenografts subcutaneously (s.c.) implanted into mice, with no fibroblasts (No fibro.), control fibroblasts (+cont. fibro.), or CAFs (+CAFs). H&E staining and immunohistochemistry using the indicated antibodies. p63+ and E-cadherin (E-cad)+ cancer cells (simple arrows), nuclear ZEB1+ cancer cells (triangular arrows), and nuclear ZEB1+ stromal cells (arrowheads) are also shown. (B) Immunofluorescence of paraffin sections prepared from 21-d-old tumors admixed with CAFs or control fibroblasts using anti–E-cadherin (E-cad) (Dako, Cat. No. IR059) and anti-ZEB1 (Cat. No. HPA027524; Sigma-Aldrich) antibodies. The presence of two distinct DCIS cell populations including Ehi (simple arrow) and E/M (triangular arrow) tumor cells, and nuclear ZEB1+ stromal cells (arrowheads) are shown. (C) Flow cytometry of the cell suspension dissociated from 30-d-old tumor xenografts raised by tdTomato+ DCIS cells admixed with control fibroblasts or CAFs using an anti–E-cad antibody. Data represent the average of three independent experiments. (D) Flow cytometry of the cell suspension dissociated from 30-d-old tumor xenografts raised by tdTomato+ DCIS cells admixed with CAFs using anti–E-cad and anti-ZEB1 antibodies. Data represent the average of three independent experiments. (E) H&E staining and immunofluorescence (IF) of the Matrigel/collagen gel using anti–E-cad and anti-ZEB1 antibodies. The DCIS cells seeded onto the gels embedded with control fibroblasts or CAFs invade as clusters (arrows) (H&E). The Ehi (simple arrow) and E/M (triangular arrow) cancer cells and nuclear ZEB1+ stromal cells (arrowheads) are also shown (IF). (F) Lung metastatic indices determined by fluorescent intensity at 60 d after subcutaneous injection of tdTomato+ DCIS cells, admixed with or without the indicated fibroblasts into mice. The horizontal line represents the mean value. (G) Appearance of tdTomato+ metastatic nodules (arrows) in the lungs at 60 d after subcutaneous injection, with no fibroblasts, control fibroblasts, or CAFs, into mice. Data information: Star indicates intact acinar structure of DCIS cells (A, B). Scale bars, 30 μm (A and E-H&E), 10 μm (B and E-IF), and 1 mm (G). Asterisk indicates a significant difference between the indicated groups (C, D) and relative to the No fibro. and +cont. fibro. groups (F). t Test (C, D) and Wilcoxon rank sum test (F). Error bars, SE. See also Fig S1. Source data are available for this figure.
Figure S1.
Figure S1.. Related to Fig 1. CAF-induced breast carcinoma cell clusters with the Ehi and E/M states, collective invasion, and metastasis.
(A) Appearance of 21-d-old tdTomato+ DCIS tumor xenografts subcutaneously (s.c.) developed with no fibroblasts (No fibro.), control fibroblasts (+cont. fibro.) or CAFs (+CAFs) in mice. Note the decreased number of intact acini (arrows) in tumors admixed with CAFs. (B) Detection of tdTomato+ DCIS cells and GFP+ fibroblasts (arrowheads) in 21-d-old subcutaneous tumor xenografts. (C). Immunohistochemistry of sections prepared from subcutaneous DCIS tumors developed with no fibroblasts, control fibroblasts, or CAFs using human-specific antivimentin (Vim) antibody. Note the presence of the injected human vimentin-positive control fibroblasts (arrowheads, middle) and CAFs (arrowheads, right) in 21-d-old tumor xenografts. (D) Immunohistochemistry of sections prepared from 21-d-old DCIS tumors subcutaneously developed with no fibroblasts, control fibroblasts, or CAFs using antibodies for human-specific antivimentin (Vim) and antifibronectin (FN). The positively stained tumor cells (arrows) and stromal cells (arrowheads) are shown. (E) Immunofluorescence of sections prepared from 21-d-old subcutaneous DCIS tumors developed with control fibroblasts or CAFs using anti–E-cadherin (E-cad) (Cat. No. ab40772; Abcam) and anti-ZEB1 (Cat. No. sc-515797; Santa Cruz) antibodies. The Ehi (simple arrow) and E/M (triangular arrow) cancer cells as well as nuclear ZEB1+ stromal cells (arrowheads) are shown. (F) Immunofluorescence of sections prepared from DCIS tumors admixed with CAFs using the indicated antibodies. E-cad+FN+ and E-cad+Vim+ tumor cells (arrows) and FN+ stromal cells (arrowheads) are shown. (G) Flow cytometry of the cell suspension dissociated from 30-d-old tumor xenografts raised by tdTomato+ DCIS cells admixed with CAFs using anti–E-cad and anti-ZEB1 antibodies. Ehi, E/M, and E-cadhiZEB1hi cell populations are marked. (H) Tumor weight measured at 30 d after subcutaneous injection of the indicated cells into mice. (I) Lung metastatic indices evaluated by nodule volume at 60 d after subcutaneous injection of the indicated cells into mice. (J) Immunohistochemistry of sections prepared from the lungs at 60 d after subcutaneous injection of DCIS cells admixed with CAFs into mice, using antibodies for human-specific antivimentin (Vim). Note the presence of vimentin-positive DCIS cells (arrows), but not CAFs. (K, L) Appearance of tdTomato+ metastatic nodules in the indicated organs dissected from mice at 60 d after subcutaneous injection of tdTomato+ DCIS cells with CAFs (K) or control fibroblasts (L). Note the tdTomato+ metastatic nodule (arrow) in the liver of the animal from the CAF group, whereas there are no tdTomato+ cells in the indicated organs in the control fibroblast group. The image (L-lung) is also shown, as in Fig 1G. Data information: Star indicates intact acinar structure of DCIS cells (B, D). Scale bars, 1 mm (A, K, L), 30 μm (B, C, D, J), and 10 μm (E, F). Asterisk indicates a significant difference relative to No fibro. and +cont. fibro. groups (H, I). t test (H) and Wilcoxon rank sum test (I). The horizontal line represents the mean value (H, I).
Figure 2.
Figure 2.. Highly invasive and metastatic breast cancer cells generated by intratumoral CAFs.
(A) Schematic representation of isolation of CAF-primed highly invasive and metastatic breast cancer cells. See text for details. (B) Scratch wound assay in the indicated cells. Error bars, SE. (C) Appearance of DCIScnt2cy and DCISCAF2cy organoids generated on Matrigel gel for 5 d. (D) H&E staining and immunostaining of sections prepared from 21-d-old subcutaneous tumors generated by the indicated cells using the described antibodies. p63+ or E-cadherin (E-cad)+ cancer cells (simple arrows), nuclear ZEB1+ cancer cells (triangular arrows), and nuclear ZEB1+ stromal cells (arrowheads) are also shown. (E) Immunofluorescence of 21-d-old tumor sections from DCISCAF2cy and DCIScnt2cy using anti–E-cad and anti-ZEB1 antibodies. The Ehi (simple arrow) and E/M (triangular arrow) tumor cells, and nuclear ZEB1+ stromal cells (arrowheads) are shown. (F) Representation of metastatic nodules (arrows) in whole lungs dissected from mice subcutaneously injected with the indicated cancer cells (upper). The size (d: diameter) and number of metastatic nodules are shown for the indicated groups (n = 6) (left). The lung metastatic indices were also evaluated in each group at 60 d after injection (right). (G) Lung metastasis volumes evaluated at 30 d after intravenous injection of the indicated cells into mice. (H) Metastases evaluated by tdTomato fluorescent intensity in the lungs at 30 d after intravenous injection of the indicated tdTomato+ tumor cells into mice. (I) Detection of GFP fluorescence (arrow) in bone (upper) and liver (lower) of mice at 60 d after intracardiac injection of the indicated GFP+ cancer cells. H&E staining of bone metastasis (middle) is also shown for the described groups. Quantification of GFP intensity of the indicated cells colonizing bone and liver (graphs). Data information: Star indicates intact acinar structure of DCIS cells (D, E). Asterisk indicates a significant difference relative to others (F–I). Mann–Whitney U test (F, H, I) and Wilcoxon rank sum test (G). The horizontal line represents the mean value (F–I). Scale bars, 10 μm (E), 30 μm (C, D and I-H&E), 3 mm (I-GFP image), and 5 mm (F). See also Fig S2. Source data are available for this figure.
Figure S2.
Figure S2.. Related to Fig 2. Highly invasive and metastatic breast cancer cells generated by intratumoral CAFs.
(A) Immunofluorescence of sections prepared from 5-d-old tumor organoids formed by DCISCAF2cy and DCIScnt2cy using anti–E-cad and anti-ZEB1 antibodies. Ehi (simple arrow) and E/M (triangular arrow) tumor cells are shown. (B) Immunostaining of sections prepared from 21-d-old subcutaneous tumors generated by the indicated cells using antifibronectin (FN) antibody and human-specific antivimentin (Vim) antibody. Positively stained tumor cells (arrows) and stromal cells (arrowheads) are shown. Star indicates intact acini in DCIS tumors. (C) Tumor weight measured at 30 d after subcutaneous injection of the indicated cells into mice. The horizontal line represents the mean value. Asterisk indicates a significant difference relative to DCISalone2cy using Mann–Whitney U test. (D) Appearance of lung metastatic nodules (arrows) at 30 d after intravenous injection of the indicated cancer cells into recipient mice. (E) H&E staining of the lung sections prepared from mice at 30 d after intravenous injection of the indicated cancer cells. (F) Immunofluorescence of the indicated cells using anti–E-cad and anti-ZEB1 antibodies. E-cad+ cancer cells (simple arrows) and nuclear ZEB1+ cancer cells (triangular arrows) are also shown. Data information: Scale bars, 10 μm (A, F), 30 μm (B), 1 mm (E), and 5 mm (D).
Figure 3.
Figure 3.. The Ehi state mediated by E-cad, CAM5, and CAM6 expressions in DCISCAF2cy.
(A) Kaplan–Meier survival analysis for distant metastasis-free survival (DMFS) using the CAF-induced metastasis signature (CIMS) in the human breast cancer patient cohort GSE7390. (B) Gene set enrichment analysis in DCISCAF2cy relative to DCIScnt2cy. DCISCAF2cy shows the enrichment of genes down-regulated in E-cad-shRNA–expressing breast cancer cells (Onder et al, 2008). (C) Immunoblotting of the described cells extracted from four different tumors (1–4) using the indicated antibody. The signal intensity ratios of E-cad relative to α-tubulin are indicated. (D) Real-time PCR (top) and immunoblotting (bottom) of DCIScnt2cy and DCISCAF2cy extracted from four different tumor xenografts measuring the indicated gene expressions. (E) Real-time PCR (top) and immunoblotting (bottom) of the described cells measuring the indicated gene expressions. (F) Positive linear correlations between E-cad, CAM5, and CAM6 mRNA expressions in the human breast cancer cohort GSE17536. (G) Immunostaining and in situ PLA in the indicated cells using the depicted antibodies. Positive staining (arrowhead) is shown on adherence junctions between DCISCAF2cy. Scale bars, 10 μm. (H) Immunoblotting (left) and real-time PCR (right) of the indicated cells. Data information: Asterisk indicates a significant difference relative to the CIMS group (A) and GFP-shRNA–expressing DCISCAF2cy (H). t test (H) and Cox proportional hazards regression test (A). Error bars, SE. See also Fig S3 and Table S1. IHC, immunohistochemistry; IF, immunofluorescence; PLA, in situ PLA. Source data are available for this figure.
Figure S3.
Figure S3.. Related to Fig 3. The Ehi state mediated by E-cad, CAM5, and CAM6 expression in DCISCAF2cy.
(A) Kaplan–Meier survival analysis for lung metastasis-free survival (MFS) and distant metastasis-free survival (DMFS) using the CAF-induced metastasis signature (CIMS) in the indicated human breast cancer patient cohorts. (B) Immunofluorescence (left) and real-time PCR (right) of the indicated cells measuring E-cad expression. E-cad+ cancer cells (arrows) are shown. Scale bar, 30 μm. (C) Real-time PCR of the indicated cells using primers specific for CAM5 and CAM6. (D) Positive linear correlations between E-cad, CAM5, and CAM6 mRNA expressions in the GSE14333 cohort and the human TCGA breast cancer cohort. (E) Signal intensity differences between CAM5/E-cad, CAM6/E-cad, and CAM5/CAM6 on the indicated cells expressing various shRNAs evaluated by in situ PLA. The horizontal line represents the mean value. Data information: Asterisk indicates a significant difference relative to the CIMS group (A), DCIScnt2cy (B), the control group (C), and GFP-shRNA–expressing DICSCAF2cy (E). t test (B, C), Mann–Whitney U test (E) and Cox proportional hazards regression test (A). Error bars, SE.
Figure 4.
Figure 4.. The Ehi state required for invasive and metastatic abilities in DCISCAF2cy.
(A–C) Lung metastatic indices (left) evaluated at 60 d after subcutaneous injection of the indicated cells into mice. Lung metastatic volume (right) was evaluated at 30 d after intravenous injection of the indicated cells into mice. (D) Appearance of GFP+DCISCAF2cy (arrows) attached to the top layer of the indicated cells (left). The relative numbers of GFP+DCISCAF2cy attached to the indicated cells (n = 4) are shown (right). (E) Appearance of larger cell aggregates (arrows) formed by DCISCAF2cy compared to DCISalone2cy and DCIScnt2cy on low attachment culture dishes (left). The relative volume of cell aggregates is shown in the indicated cells (n = 5) (right). (F) The ECM (collagen)–cell adhesion measured in the indicated cells (n = 4–9). (G) Cell apoptosis measured in the indicated cells (n = 5) on low attachment culture dishes. (H) The relative apoptotic (left) and proliferating (right) tumor cell proportions in experimental lung metastases generated by DCISCAF2cy expressing the indicated shRNA (n = 4) by immunostaining using anti-cPARP and anti–Ki-67 antibodies, respectively. Data information: Asterisk indicates a significant difference relative to GFP-shRNA–expressing DCISCAF2cy (A–H). t test (D–H) and Mann–Whitney U test (A–C). Error bars, SE. The horizontal line represents the mean value (A–C). Scale bars, 30 μm (E) and 300 μm (D). See also Fig S4.
Figure S4.
Figure S4.. Related to Fig 4. The Ehi state required for invasive and metastatic abilities in DCISCAF2cy.
(A–C) Measurement of tumor weight at 30 d after subcutaneous injection of the indicated cells into recipient mice. (D) Cell–cell adhesion of GFP-labelled DCISalone2cy, DCIScnt2cy, or DCISCAF2cy, seeded as adherent cells, on the indicated GFP-negative layer cells. The number of GFP-positive adherent cells was quantified in each group. Data information: Asterisk indicates a significant difference relative to GFP-shRNA–expressing DCISCAF2cy (A–C) and the adherent GFP-positive DCISCAF2cy seeded on DCISCAF2cy layer cells (D). t test (A–C) and Mann–Whitney U test (D). Error bars, SE. The horizontal line represents the mean value (A–C).
Figure 5.
Figure 5.. The E/M state mediates invasive and metastatic abilities in DCISCAF2cy.
(A) Real-time PCR of the indicated cells measuring ZEB1 expression (left). Immunoblotting of the described cells using anti-ZEB1 and anti–α-tub antibodies (right). (B) Real-time PCR of the indicated cells measuring E-cad expression. (C) Cell invasion evaluated by scratch wound assay (n = 8) using the indicated cells. (D) Cell invasion evaluated by organotypic invasion assay using the indicated cells (n = 3). H&E staining (right-left) of the organotypic gel containing the indicated cancer cells (arrows) and mammary fibroblasts (arrowheads), and its immunofluorescence (right-right) using anti–E-cad and anti-ZEB1 antibodies. The Ehi (simple arrow) and E/M (triangular arrow) cancer cells, and nuclear ZEB1+ stromal cells (arrowheads) are shown (right-right). Scale bars, 30 μm (H&E), 10 μm (IF). (E) Lung metastases evaluated by fluorescent intensity at 30 d after intravenous injection of the indicated tdTomato+ cells into mice. Data information: Asterisk indicates a significant difference relative to GFP-shRNA–expressing DCISCAF2cy (A–E). t test (A–D) and Mann–Whitney U test (E). The horizontal line represents the mean value (E). Error bars, SE. IF, immunofluorescence. Source data are available for this figure.
Figure S5.
Figure S5.. Related to Fig 6. Src activation mediates the Ehi and E/M states and metastatic ability in DCISCAF2cy.
(A) Summary of high-throughput screening identifying six compounds that significantly (50%) inhibited CAM6 mRNA expression in DCISCAF2cy. (B) Immunostaining of frozen sections prepared from the indicated tumors using an antiphosphorylated Src (p-Src, Tyr 416) antibody. p-Src+ cancer cells (simple arrows) are shown. (C) Real-time PCR of DCIScnt2cy and DCISCAF2cy expressing the indicated shRNA using primers specific for the Src gene. (D) Real-time PCR of the indicated cells treated with or without saracatinib (Sara) for 24 h measuring CAM5, CAM6, and E-cad expressions. (E) Real-time PCR of DCIScnt2cy and DCISCAF2cy expressing the indicated shRNA using primers specific for CAM5, CAM6, and E-cad genes. Immunofluorescence of the indicated cells using anti–E-cad antibody (right). E-cad+ cancer cells (simple arrows) are also shown. (F) In situ PLA of DCIScnt2cy and DCISCAF2cy expressing the indicated shRNA using anti-Src and anti–E-cad antibodies. The signal (arrow) detected by in situ PLA is indicated (upper) and the signal intensity is also evaluated in the above-described cells (lower). (G) Immunofluorescence of DCISCAF2cy using the indicated antibodies. (H) Real-time PCR of the indicated cells measuring ZEB1 expression. (I) Immunoblotting of DCIS cells expressing the control empty vector (Cont. vector) or constitutively active Src mutant (Active Src) using the indicated antibodies. (J) Measurement of nodule volume in the lungs at 30 d after intravenous injection of the indicated cells into mice. Data information: Asterisk indicates a significant difference relative to DCISCAF2cy expressing GFP-shRNA (C, E, F, H), DCISCAF2cy treated without saracatinib (D), and DCIS cells expressing the control vector (J). t test (C–E, H) and Mann–Whitney U test (F, J). Error bars, SE. The horizontal line represents the mean value (F, J). Scale bars, 30 μm (B, F), 10 μm (E, G). Source data are available for this figure.
Figure 6.
Figure 6.. Src activation mediates the Ehi and E/M states and metastatic ability in DCISCAF2cy.
(A) Immunoblotting of the described cells treated with different concentrations of saracatinib (sara) dissolved in DMSO for 24 h using the indicated antibodies. (B, C) Immunoblotting of the indicated cells using the described antibodies. (D) Immunoblotting of the indicated cells passaged up to 15 population doublings (PDs) using the described antibodies. (E) Immunostaining (IF) and in situ PLA (PLA) in the indicated cells using anti-Src and anti–E-cad antibodies. Positive staining (arrowhead) is shown on adherence junctions between DCISCAF2cy. (F) Immunofluorescence of the indicated cells using an anti-ZEB1 antibody. Nuclear ZEB1+ cells (arrows) are also shown. (G–J) (G) Cell proliferation, (H) scratch wound cell invasion, (I) cell–cell adhesion, and (J) cell–cell aggregation in the indicated cells treated with DMSO, saracatinib (1 μM) or PP1 (10 μM) (n = 4–8). (K) Lung metastasis evaluated at 30 d after intravenous injection of the indicated cells into mice. The horizontal line represents the mean value. Data information: Asterisk indicates a significant difference relative to DMSO-treated DCISCAF2cy (G–J) and the GFP-shRNA–expressing DCISCAF2cy (K). t test (G–J) and Mann–Whitney U test (K). Error bars, SE. Scale bars, 10 μm (E, F). See also Fig S5. Source data are available for this figure.
Figure 7.
Figure 7.. Stromal SDF-1 and TGF-β mediate the formation of invasive and metastatic breast tumor clusters with Ehi and E/M states via Src activation.
(A) Real-time PCR of control fibroblasts and CAFs expressing GFP or TβRII ecto using the indicated primers. (B) Schematic illustration of a subcutaneous co-implantation tumor xenograft model (for Fig 7C and D). See text in detail. (C) The lung metastatic indices are measured at 60 d after subcutaneous injection of the indicated cells. (D) Immunoblotting of DCIScnt2cy and DCISCAF2cy using the indicated antibodies (left). The DCIScnt2cy and DCISCAF2cy were extracted from tumors generated by DCIS cells admixed with control fibroblasts (expressing GFP) and CAFs (expressing GFP or TβRII ecto), respectively. Immunostaining of the indicated cells using anti–E-cad and anti-ZEB1 antibodies (right). E-cad+ cancer cells (simple arrows) and nuclear ZEB1+ cancer cells (triangular arrows) are shown. (E) Schematic illustration of a subcutaneous co-implantation tumor xenograft model (for Fig 7F–H). See text for details. (F) The lung metastatic indices evaluated at 60 d after subcutaneous injection of the described cells into mice. (G) Real-time PCR of DCIScnt1cy or DCISCAF1cy measuring the indicated gene expressions. The DCIScnt1cy and DCISCAF1cy were extracted from 30-d-old tumor xenografts generated by DCIS cells expressing the indicated shRNA admixed with control fibroblasts and CAFs, respectively. (H) Immunostaining of the described cells using the indicated antibodies. E-cad+ cancer cells (simple arrows) and nuclear ZEB1+ cancer cells (triangular arrows) are shown. (I) Real-time PCR of DCIS cells expressing the indicated shRNA, treated with PBS, SDF-1 (100 ng/ml), and/or TGF-β1 (10 ng/ml) for 24 h, to measure the described gene expressions. Immunoblotting of DCIS cells treated with PBS, SDF-1, and/or TGF-β1 for 48 h using the indicated antibodies (right-bottom). (J) Immunofluorescence of DCIS organoids expressing the indicated shRNAs treated with PBS or both SDF-1 (100 ng/ml) and TGF-β1 (10 ng/ml) using anti–E-cad and anti-ZEB1 antibodies. The Ehi (simple arrow) and E/M (triangular arrow) cancer cells are also shown. (K) Immunofluorescence of DCIS organoids expressing the control empty vector (Cont. vector) or the constitutively active Src mutant (Active Src) using the indicated antibodies. The Ehi (simple arrow) and E/M (triangular arrow) cancer cells are shown. (L) Organotypic invasion assay using DCIS cells treated with PBS or both SDF-1 (100 ng/ml) and TGF-β1 (10 ng/ml). Invading tumor cell clusters (arrows) and mammary fibroblasts (arrowheads) embedded in the gel with H&E staining (left) and immunofluorescence (IF) using anti–E-cad and anti-ZEB1 antibodies (right) are shown. The Ehi (simple arrow) and E/M (triangular arrow) cancer cells, and nuclear ZEB1+ stromal cells (arrowheads) are shown (right). Data information: Asterisk indicates a significant difference relative to GFP-expressing CAFs (A and C-right), GFP-shRNA–expressing CAFs (C-left), and GFP-shRNA–expressing DCIS cells (F) and DCISCAF1cy (G). Asterisk and # symbol also indicate a significant difference between the indicated lines (I). t test (A, G, I) and Mann–Whitney U test (C, F). Error bars, SE. The horizontal line represents the mean value (C, F). Scale bars, 30 μm (L-H&E) and 10 μm (others). See also Fig S6. Source data are available for this figure.
Figure S6.
Figure S6.. Related to Fig 7. Stromal SDF-1 and TGF-β mediate the formation of invasive and metastatic breast tumor clusters with Ehi and E/M states via Src activation.
(A) Real-time PCR of DCIScnt2cy and DCISCAF2cy using the indicated primers. The DCIScnt2cy and DCISCAF2cy were extracted from tumor xenografts generated by DCIS cells admixed with control fibroblasts and CAFs expressing GFP or TβRII ecto, respectively. (B) Real-time PCR of DCIScnt1cy and DCISCAF1cy expressing the indicated shRNAs measuring E-cad expression. The DCIScnt1cy and DCISCAF1cy were extracted from 30-d-old tumor xenografts generated by DCIS cells expressing the indicated shRNAs admixed with control fibroblasts and CAFs, respectively. (C) Immunofluorescence of DCIS cells treated with recombinant SDF-1 (100 ng/ml) and/or TGF-β1 (10 ng/ml) for 48 h using anti–E-cad or ZEB1 antibody. E-cad+ cancer cells (simple arrows) and nuclear ZEB1+ cancer cells (triangular arrows) are shown. Scale bars, 10 μm. (D) Real-time PCR of MCF-7-ras cells treated with recombinant SDF-1 and/or TGF-β1 for 24 h to measure the indicated gene expressions. Data information: Asterisk indicates a significant difference relative to DCISCAF2cy extracted from tumor with CAFs expressing GFP (A) and GFP-shRNA–expressing DCISCAF1cy (B), and between the depicted groups (D). t test (A, B, D). n.s.: not significant (D). Error bars, SE.
Figure 8.
Figure 8.. CAF-induced CTC clusters, tumor emboli, and metastatic colonization.
(A) Immunostaining of cytospin-concentrated smears prepared from peripheral blood of mice bearing 30-d-old DCIS tumors admixed with CAFs using the indicated antibodies. Positive staining (brown) for E-cad, CAM5, CAM6, and ZEB1 and hematoxylin nuclear staining (blue) indicated by arrows are shown in cancer cells of CTC clusters. Nuclear ZEB1 staining (arrowhead) is also depicted in tumor cells. A number of leukocytes around the CTC clusters are stained with hematoxylin. (B) Number of CTC colonies evaluated by colony-forming assay (left). Peripheral blood was collected from mice injected subcutaneously with tdTomato-labelled, blasticidin-resistant DCIS cells admixed with no fibroblasts (No fibro.), control fibroblasts (+cont. fibro.), or CAFs (+CAFs) before culture in the presence of blasticidin on a petri dish for 21 d. Visualization of blasticidin-resistant CTC colonies (right-upper) and their tdTomato positivity under fluorescent microscopy (right-lower). Asterisk indicates a significant difference relative to No fibro. and +cont. fibro. groups. Error bars, SE. (C) H&E staining and immunohistochemistry of lung sections prepared at 60 d after subcutaneous injection of DCISCAF2cy into mice using the indicated antibodies. E-cad+ and Ki-67+ carcinoma cells (arrows) are indicated in tumor emboli (asterisk in broken circle). E-cad+ epithelial cells are also shown in a bronchus (star), as well as nuclear ZEB1+ mesenchymal cells (arrowheads). (D) Immunostaining of lung sections prepared at 60 d after subcutaneous injection of DCISCAF2cy or DCIScnt2cy into mice using the indicated antibodies. E-cad+, CAM5+, CAM6+, and p-Src+ cancer cells (simple arrows) as well as nuclear ZEB1+ cancer cells (triangular arrows) are shown. (E) Linear correlations between the indicated genes expressed in metastatic sites, including the bone, liver, and lung in the breast cancer patient cohort GSE14020. E-cad expression is represented by the sizes of circles including the three patients with the lowest E-cad expressions indicated by arrows (upper). (F) Schematic representation of CAF-induced invasive and metastatic tumor cell clusters composed of Ehi and E/M tumor cells during the invasion-metastasis cascade. See text for details. Data information: Wilcoxon rank sum test (B) and two-sample correlation test (E). Scale bars, 10 μm (A), 1 mm (B), 100 μm (C), and 30 μm (D). See also Fig S7.
Figure S7.
Figure S7.. Related to Fig 8. CAF-induced CTC clusters, tumor emboli, and metastatic colonization.
(A) Immunohistochemistry of lung sections prepared from mice at 60 d after subcutaneous injection of DCISCAF2cy using anti–α-SMA antibody. Tumor embolus (asterisk in a broken circle) is indicated. α-SMA–positive cells (arrows) are detected in smooth muscle cell layers in the blood vessel and bronchus (star). (B) Immunostaining of lung sections prepared from mice at 60 d after subcutaneous injection of DCIS cells admixed with CAFs, using the indicated antibodies. Note that DCIS cells show highly positive staining for E-cad, CAM5, CAM6, and p-Src (arrows), in contrast to negative staining for ZEB1. Data information: Scale bars, 100 μm (A) and 30 μm (B).
Figure 9.
Figure 9.. The Ehi and E/M states in DCISCAF2cy are associated with poor outcomes for Her2⁺ERPR breast cancer patients.
(A) H&E (upper left) and immunostaining of tumor embolus present in a microvessel of human breast cancer tissue using the indicated antibodies. E-cad+ cancer cells (simple arrows), nuclear ZEB1+ cancer cells (triangular arrows), and nuclear ZEB1+ stromal cells (arrowheads) are shown. The Ehi (simple arrow) and E/M (triangular arrow) cancer cells, and nuclear ZEB1+ stromal cells (arrowheads) are also shown (lower right; IF, immunofluorescence). (B) Proportions (%) of breast cancer patients whose tumors stained positive for the indicated antibodies (Ab). Tumor sections that had been prepared from 257 breast cancer patients were immunohistochemically analyzed. The number of patients whose tumors stained positive for the indicated antibodies, relative to those stained both positive and negative, is shown in brackets. (C) Immunostaining of the Her2+ERPR human breast carcinoma using the indicated antibodies. CAM6+, CAM5+, E-cad+ and Her2+ cancer cells (simple arrows), nuclear ZEB1+ cancer cells (triangular arrows), and nuclear ZEB1+ stromal cells (arrowheads) are shown. The Ehi (simple arrow) and E/M (triangular arrow) cancer cells, and nuclear ZEB1+ stromal cells (arrowheads) are also shown in the section stained with anti–E-cad and anti-ZEB1 antibodies (bottom right). (D) Kaplan–Meier survival analysis for high (red line) and low (black line) expression levels of the indicated genes in the described breast cancer patients. Hazard ratio (HR) is also shown. Data information: Asterisk indicates a significant difference relative to others (B) and the group with lower expression (D). Fisher's exact test (B) and Cox proportional hazards regression test (D). Scale bars, 30 μm (C-IHC) and 10 μm (A and C-IF). See also Fig S8 and Tables S2, S3, S4, and S5. ns, not significant; RFS, relapse-free survival.
Figure S8.
Figure S8.. Related to Fig 9. The Ehi and E/M states in DCISCAF2cy are associated with poor outcomes in Her2⁺ERPR breast cancer patients.
(A) Kaplan–Meier survival analysis for high (red line) and low (black line) expression levels of the indicated genes in the described breast cancer patients. The rectangle indicates data shown in Fig 9D. The hazard ratio (HR) is also shown. n.s., not significant. Asterisk indicates a significant difference relative to the group with lower expression using the Cox proportional hazards regression test. OS, overall survival; RFS, relapse-free survival.
Figure S9.
Figure S9.. No significant changes in DNA methylation status in the E-cad, CAM5 and CAM6 gene promoter regions in DCISCAF2cy.
(A) Analysis of DNA methylation in the indicated DCIS cells by pyrosequencing using the promoter regions of the CAM6, CAM5, and E-cad genes. Percent methylation is depicted above each CpG site in representative pyrograms and the averaged percent methylation is shown on the right side. Note slightly decreased percent methylation in the CAM6 gene in DCISCAF2cy (71.07%) relative to that in DCIScnt2cy (74.77%). Exposure of DCIS cells to 20 μM 5-azacytidine (5AZ) for 72 h also decreases the percent methylation in the CAM6 gene relative to the control H2O treatment. In contrast, methylation is barely detectable in the examined CpG sites in the CAM5 and E-cad genes in both DCISCAF2cy and DCIScnt2cy.

Similar articles

Cited by

References

    1. Aceto N, Bardia A, Miyamoto DT, Donaldson MC, Wittner BS, Spencer JA, Yu M, Pely A, Engstrom A, Zhu H, et al. (2014) Circulating tumor cell clusters are oligoclonal precursors of breast cancer metastasis. Cell 158: 1110–1122. 10.1016/j.cell.2014.07.013 - DOI - PMC - PubMed
    1. Aiello NM, Maddipati R, Norgard RJ, Balli D, Li J, Yuan S, Yamazoe T, Black T, Sahmoud A, Furth EE, et al. (2018) EMT subtype influences epithelial plasticity and mode of cell migration. Dev Cell 45: 681–695 e4. 10.1016/j.devcel.2018.05.027 - DOI - PMC - PubMed
    1. Beauchemin N, Arabzadeh A (2013) Carcinoembryonic antigen-related cell adhesion molecules (CEACAMs) in cancer progression and metastasis. Cancer Metastasis Rev 32: 643–671. 10.1007/s10555-013-9444-6 - DOI - PubMed
    1. Brabletz T, Kalluri R, Nieto MA, Weinberg RA (2018) EMT in cancer. Nat Rev Cancer 18: 128–134. 10.1038/nrc.2017.118 - DOI - PubMed
    1. Bronsert P, Enderle-Ammour K, Bader M, Timme S, Kuehs M, Csanadi A, Kayser G, Kohler I, Bausch D, Hoeppner J, et al. (2014) Cancer cell invasion and EMT marker expression: A three-dimensional study of the human cancer-host interface. J Pathol 234: 410–422. 10.1002/path.4416 - DOI - PubMed

Publication types

MeSH terms