

Acute social isolation alters neurogenomic state in songbird forebrain
- PMID: 31332005
- PMCID: PMC7519284
- DOI: 10.1073/pnas.1820841116
Acute social isolation alters neurogenomic state in songbird forebrain
Abstract
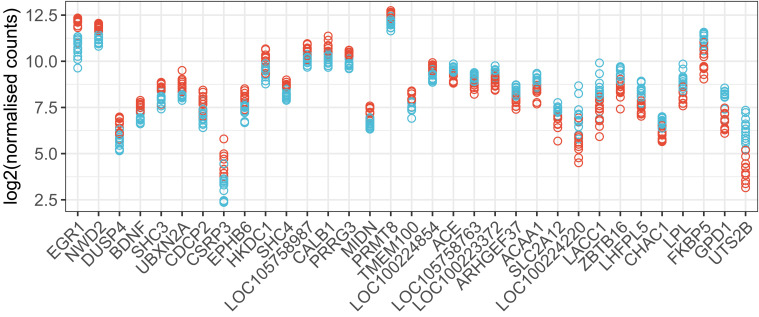
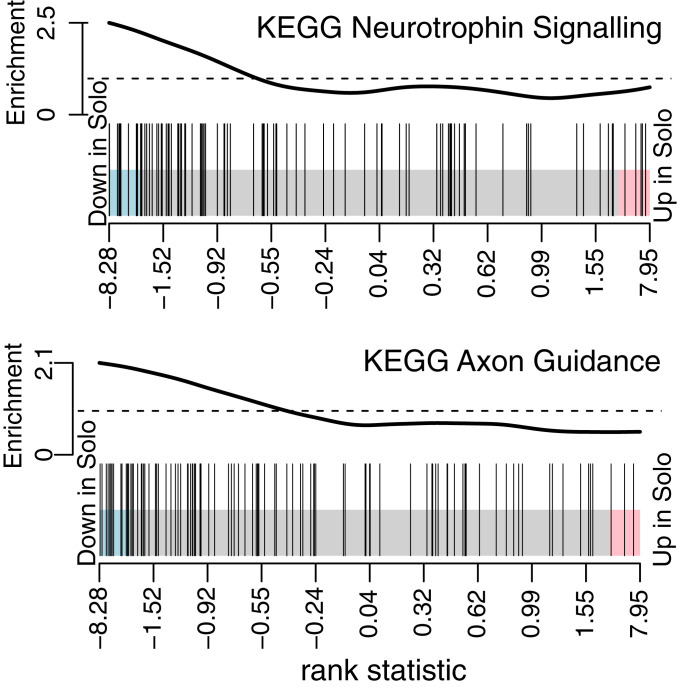
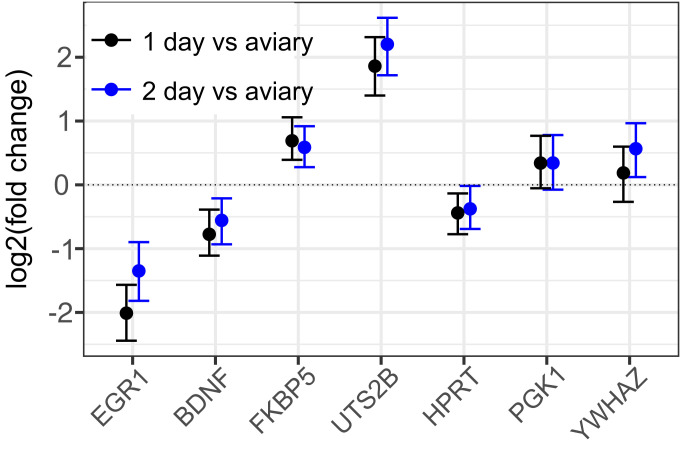
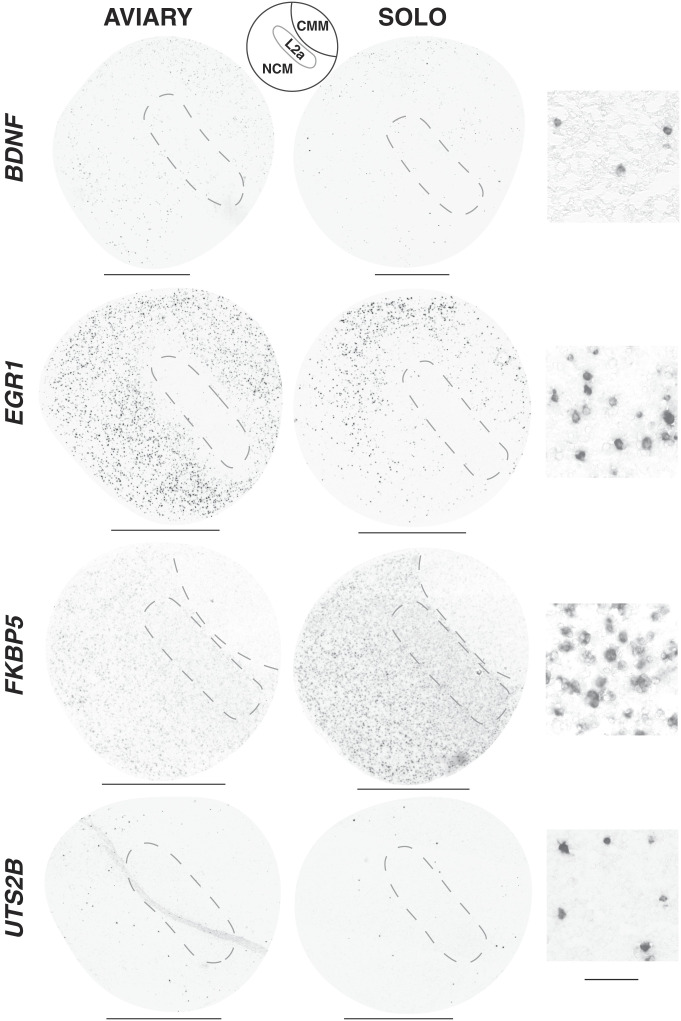
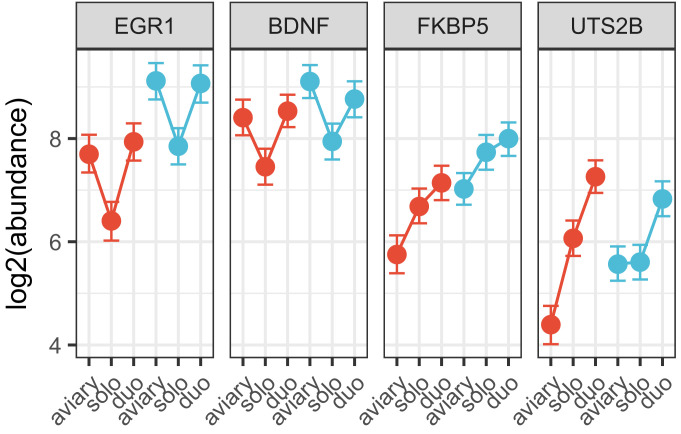
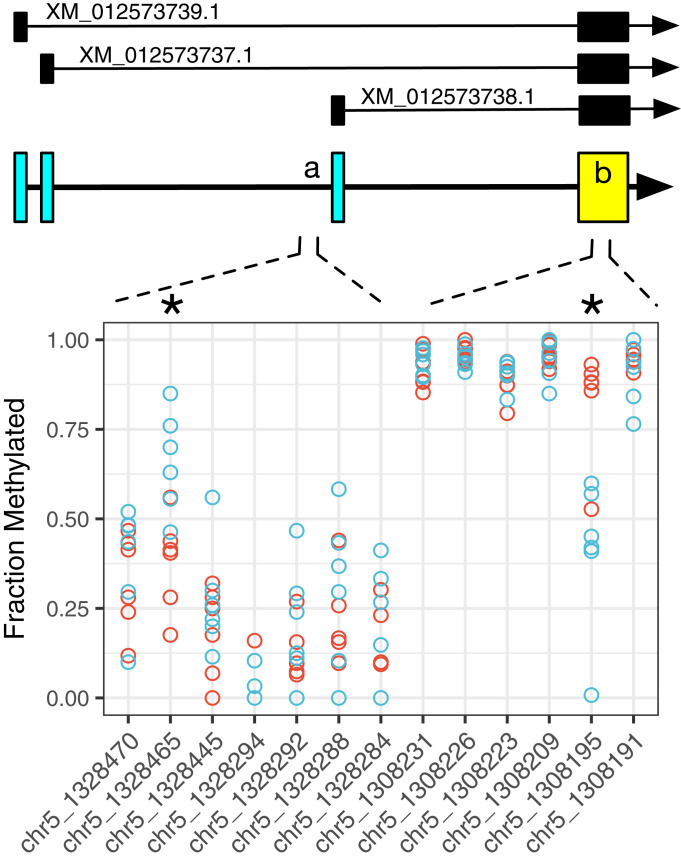
Prolonged social isolation has negative effects on brain and behavior in humans and other social organisms, but neural mechanisms leading to these effects are not understood. Here we tested the hypothesis that even brief periods of social isolation can alter gene expression and DNA methylation in higher cognitive centers of the brain, focusing on the auditory/associative forebrain of the highly social zebra finch. Using RNA sequencing, we first identified genes that individually increase or decrease expression after isolation and observed general repression of gene sets annotated for neurotrophin pathways and axonal guidance functions. We then pursued 4 genes of large effect size: EGR1 and BDNF (decreased by isolation) and FKBP5 and UTS2B (increased). By in situ hybridization, each gene responded in different cell subsets, arguing against a single cellular mechanism. To test whether effects were specific to the social component of the isolation experience, we compared gene expression in birds isolated either alone or with a single familiar partner. Partner inclusion ameliorated the effect of solo isolation on EGR1 and BDNF, but not on FKBP5 and UTS2B nor on circulating corticosterone. By bisulfite sequencing analysis of auditory forebrain DNA, isolation caused changes in methylation of a subset of differentially expressed genes, including BDNF. Thus, social isolation has rapid consequences on gene activity in a higher integrative center of the brain, triggering epigenetic mechanisms that may influence processing of ongoing experience.
Keywords: DNA methylation; RNA-seq; forebrain; isolation; zebra finch.
Conflict of interest statement
The authors declare no conflict of interest.
Figures
Similar articles
-
The acoustic expression of stress in a songbird: does corticosterone drive isolation-induced modifications of zebra finch calls?Horm Behav. 2012 Apr;61(4):573-81. doi: 10.1016/j.yhbeh.2012.02.004. Epub 2012 Feb 24. Horm Behav. 2012. PMID: 22387308
-
Variation in social relationships relates to song preferences and EGR1 expression in a female songbird.Dev Neurobiol. 2016 Sep;76(9):1029-40. doi: 10.1002/dneu.22373. Epub 2016 Jan 22. Dev Neurobiol. 2016. PMID: 26713856
-
Effects of adolescent social isolation on the expression of brain-derived neurotrophic factors in the forebrain.Eur J Pharmacol. 2011 Jan 10;650(1):229-32. doi: 10.1016/j.ejphar.2010.09.061. Epub 2010 Oct 12. Eur J Pharmacol. 2011. PMID: 20946893
-
Hippocampal BDNF in physiological conditions and social isolation.Rev Neurosci. 2017 Jul 26;28(6):675-692. doi: 10.1515/revneuro-2016-0072. Rev Neurosci. 2017. PMID: 28593903 Review.
-
Long-Term Impact of Social Isolation and Molecular Underpinnings.Front Genet. 2020 Oct 22;11:589621. doi: 10.3389/fgene.2020.589621. eCollection 2020. Front Genet. 2020. PMID: 33193727 Free PMC article. Review.
Cited by
-
Resurgent Na+ currents promote ultrafast spiking in projection neurons that drive fine motor control.Nat Commun. 2021 Nov 19;12(1):6762. doi: 10.1038/s41467-021-26521-3. Nat Commun. 2021. PMID: 34799550 Free PMC article.
-
Undirected singing rate as a non-invasive tool for welfare monitoring in isolated male zebra finches.PLoS One. 2020 Aug 10;15(8):e0236333. doi: 10.1371/journal.pone.0236333. eCollection 2020. PLoS One. 2020. PMID: 32776943 Free PMC article.
-
Acute social isolation and regrouping cause short- and long-term molecular changes in the rat medial amygdala.Mol Psychiatry. 2022 Feb;27(2):886-895. doi: 10.1038/s41380-021-01342-4. Epub 2021 Oct 14. Mol Psychiatry. 2022. PMID: 34650208 Free PMC article.
-
Environmental epigenetics and the loneliness epidemic.Environ Epigenet. 2024 Dec 5;10(1):dvae024. doi: 10.1093/eep/dvae024. eCollection 2024. Environ Epigenet. 2024. PMID: 39734912 Free PMC article. No abstract available.
-
Novel sound exposure drives dynamic changes in auditory lateralization that are associated with perceptual learning in zebra finches.Commun Biol. 2023 Nov 27;6(1):1205. doi: 10.1038/s42003-023-05567-7. Commun Biol. 2023. PMID: 38012325 Free PMC article.
References
-
- Scaccianoce S., et al. , Social isolation selectively reduces hippocampal brain-derived neurotrophic factor without altering plasma corticosterone. Behav. Brain Res. 168, 323–325 (2006). - PubMed
Publication types
MeSH terms
Substances
Grants and funding
LinkOut - more resources
Full Text Sources
Miscellaneous
