. 2019 Aug 6;116(32):15823-15829.
doi: 10.1073/pnas.1904529116. Epub 2019 Jul 22.

Drugging an undruggable pocket on KRAS

Affiliations

Drugging an undruggable pocket on KRAS

Dirk Kessler et al. Proc Natl Acad Sci U S A. .

Abstract

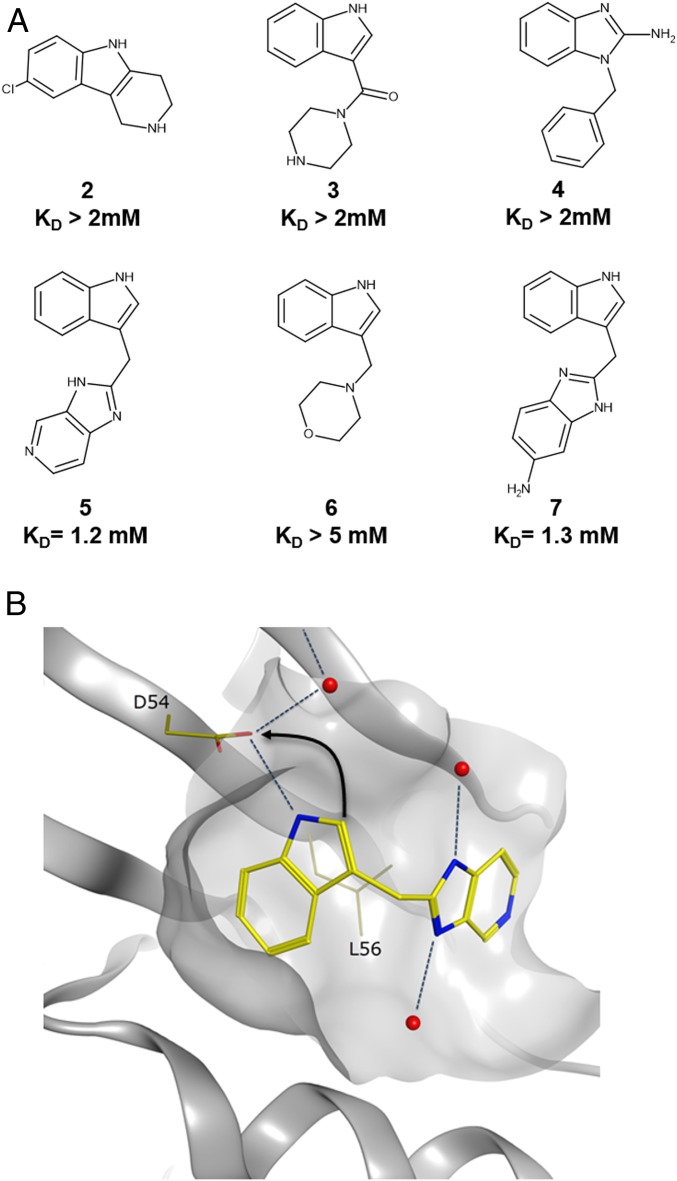
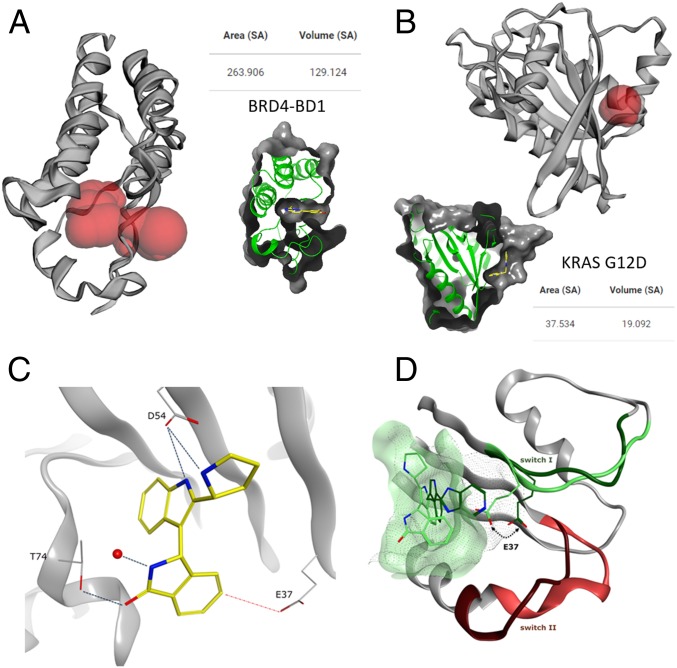
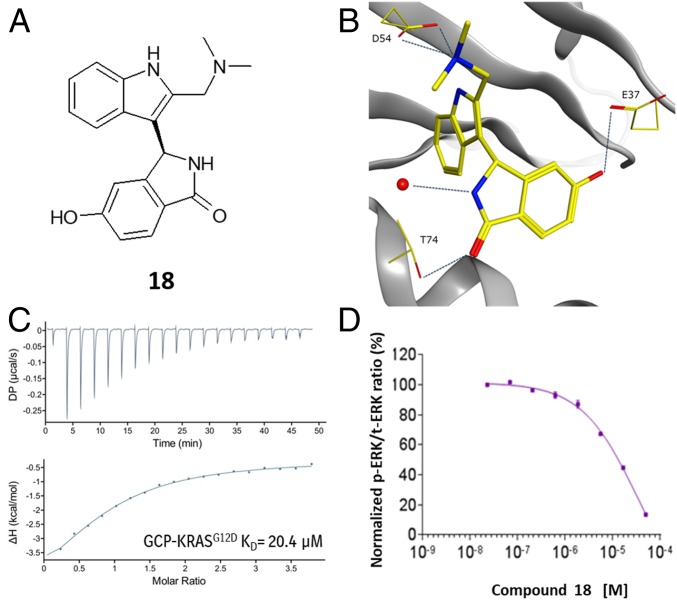
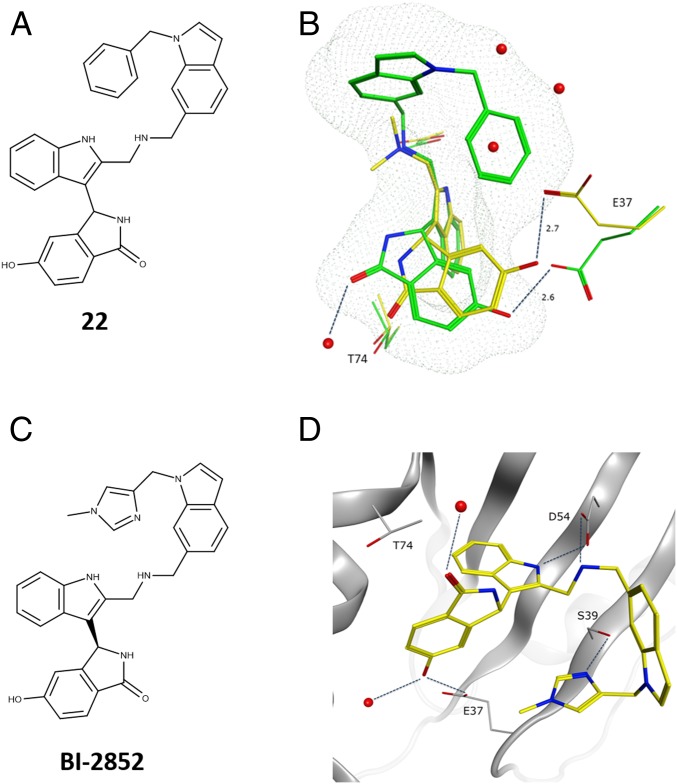
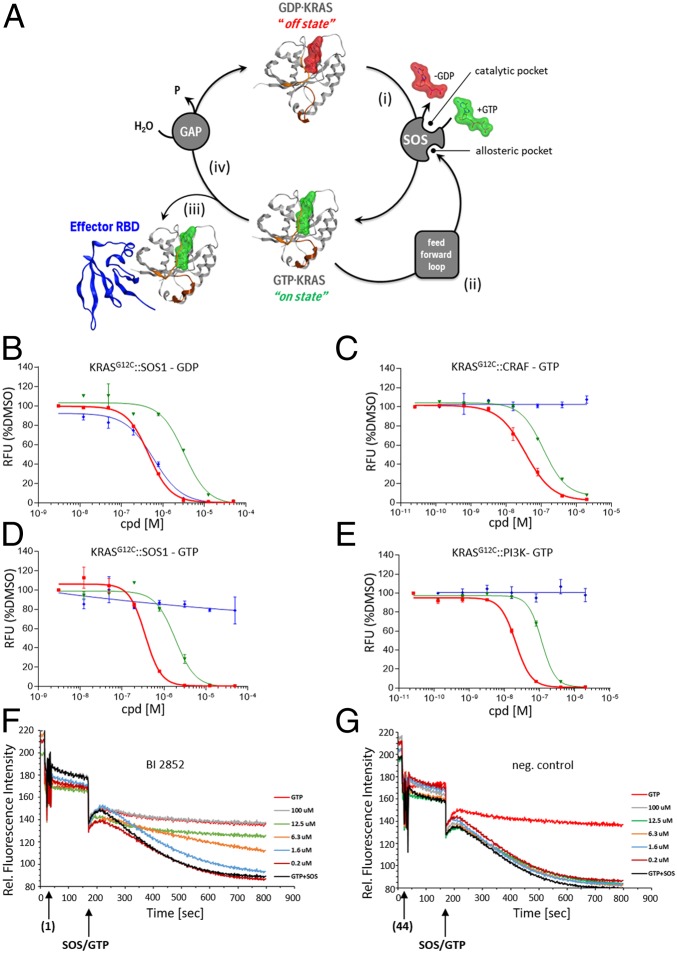
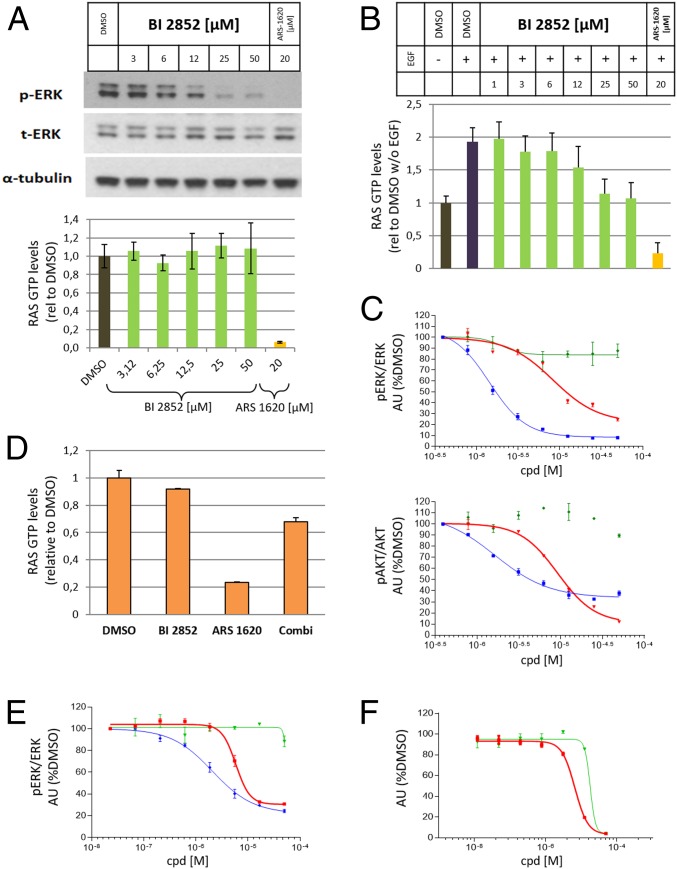
The 3 human RAS genes, KRAS, NRAS, and HRAS, encode 4 different RAS proteins which belong to the protein family of small GTPases that function as binary molecular switches involved in cell signaling. Activating mutations in RAS are among the most common oncogenic drivers in human cancers, with KRAS being the most frequently mutated oncogene. Although KRAS is an excellent drug discovery target for many cancers, and despite decades of research, no therapeutic agent directly targeting RAS has been clinically approved. Using structure-based drug design, we have discovered BI-2852 (1), a KRAS inhibitor that binds with nanomolar affinity to a pocket, thus far perceived to be "undruggable," between switch I and II on RAS; 1 is mechanistically distinct from covalent KRASG12C inhibitors because it binds to a different pocket present in both the active and inactive forms of KRAS. In doing so, it blocks all GEF, GAP, and effector interactions with KRAS, leading to inhibition of downstream signaling and an antiproliferative effect in the low micromolar range in KRAS mutant cells. These findings clearly demonstrate that this so-called switch I/II pocket is indeed druggable and provide the scientific community with a chemical probe that simultaneously targets the active and inactive forms of KRAS.

Keywords: KRAS; NMR; fragment-based drug design; oncology; structure-based drug design.


Conflict of interest statement

Conflict of interest statement: D.K., M.G., A.M., L.J.M., A.Z., M.M., A.G., D.C., S.F., T. Gerstberger, T. Gmashitz, P.G., D.H., W.H., J.H., J.K.-O., P.K., S.K., M.K., R.K., L.L., F.M., S.M.-M., C.P., J.R., C.S., Y.S., K.S., R.S., A.S., B.S., G.S., B.W., M.Z., M.P., and D.B.M. were employees of Boehringer Ingelheim at the time of this work.

Figures

Fig. 1.
Fig. 1.
Fragments identified from 2 separate fragment screens. (A) Representative indole and benzimidazole fragments identified from the fragment screens. (B) The binding mode of indole 5 in GDP-KRAS (Protein Data Bank [PDB] ID code 4EPV) showing the H bond between the indole NH and the side chain of D54. Indole 5 shown in yellow, water molecules shown in red. Arrow indicates the strategy of forming an additional charge−charge interaction with the side chain of D54 from the indole 2 position.
Fig. 2.
Fig. 2.
Analysis of protein pockets and X-ray structure of 15 in GCP-KRASG12D. A Computer Atlas of Surface Topography of proteins (48) analysis of pockets in proteins for calculating the solvent-accessible surface area (Area SA) and volume (Volume SA) with a radius probe of 1.4 Å showing differences in pocket size for (A) BRD4-BD1 (PDB ID code 5M39) as an example of a highly druggable pocket and (B) KRAS G12D (PDB ID code 6GJ5) with a very small volume. Calculated pockets are shown in red. Insets show ligand binding in the respective pocket, for comparison reasons. (C) Polar interactions formed by 15 to T74, D54, and a conserved water. The ideal position of E37 for introducing a further polar interaction is highlighted with the red dotted line (PDB ID code 6GJ5). (D) Comparison of SI/II-pocket in GDP (PDB ID code 4EPV) and GTP-KRAS showing the significantly reduced pocket size in GTP-KRAS. The switch I and switch II regions are colored dark green and dark red in GDP-KRAS and light green and light red for GTP-KRAS, respectively.
Fig. 3.
Fig. 3.
X-ray, biophysical and cellular data for 18. (A) Chemical structure of 18. (B) X-ray structure of 18 in GCP-KRASG12D, highlighting the polar interactions formed with D54, T74, and E37 (PDB ID code 6GJ6). (C) ITC dose titration curve for 18 and GCP-KRASG12D. (D) Meso Scale Discovery analysis of pERK levels in NCI-H358 cells after 2-h treatment of 18.
Fig. 4.
Fig. 4.
GCP-KRASG12D X-ray structures of compound 22 and BI-2852 (1). (A) Chemical structure of 22. (B) Overlay of the binding modes of 18 and 22. The relative orientation of 18 and E37 in the X-ray with KRASG12D is depicted in yellow. The binding mode of 22, E37, and T74 are depicted in green. Dotted mesh depicts the van der Waals radii around 22, showing overlap with 3 waters from the X-ray structure of 18 (PDB ID code 6GJ8). (C) Chemical structure of 1. (D) X-ray structure of 1 in GCP-KRASG12D, highlighting the polar interactions formed with D54, T74, S39, and E37 (PDB ID code 6GJ7). The racemate 23 was used for soaking, and eutomer 1 was crystallized.
Fig. 5.
Fig. 5.
Biochemical assay dose–response curves for BI-2852 (1), distomer 44, and ARS-1620. (A) KRAS cycle is depicted with KRAS in Channing Der‘s “beating heart of cancer” orientation switching between its “off state” with the nucleotide GDP bound (red surface) and its “on state” with GCP bound (green surface). The 4 PPI intervention points in the KRAS cycle are shown. (i) The interaction between GDP-KRAS and the catalytic site of its GEF; here SOS is depicted. (ii) GTP-KRAS binding to the allosteric site of SOS which constitutes the feed forward loop. (iii) GTP-KRAS binding to downstream effectors; CRAF (in blue) is shown as an example. (iv) GTP-KRAS binding to GAPs. KRAS is depicted in gray, with the switch I region colored in orange and the switch II region in brown. (BE) Biochemical assay dose–response curves for 1 (red), distomer 44 (green), and ARS-1620 (blue) for (B) GDP-KRASG12C::SOS1 alpha screen assay, (C) GTP-KRASG12C::CRAF alpha screen assay, (D) GTP-KRASG12C::SOS1 alpha assay, and (E) GTP-KRASG12C::PI3Kα alpha screen assay. All values shown are normalized to DMSO (= 100%) for better comparability. Error bars indicated show the SD of duplicates measured. Shown are representative examples of multiple repetitions with identical results. (F and G) The ability of test compounds to affect SOScat-catalyzed nucleotide exchange on RAS was assessed at several concentrations. The addition of SOScat and excess GTP (at 120 s) initiates the exchange of labeled boron-dipyrromethene-GDP (BODIPY-GDP) already loaded into RAS. The BODIPY-GDP to GTP exchange mediated by SOScat (black curve) is observed as a decrease in relative fluorescence units (RFUs) over time. While the negative control distomer 44 (G) shows no effect, increasing concentrations of BI-2852 (1) (F) show a slower decrease in RFU over time, representing a slower exchange rate. The highest concentrations show full inhibition of SOScat-mediated exchange, matching the rate in the absence of SOScat (red curve).
Fig. 6.
Fig. 6.
Cellular data for BI-2852 (1), distomer 44, and ARS-1620. (A) Western blot of pERK levels versus total ERK and alpha-tubulin under high serum conditions in NCI-H358 cells upon increasing doses of 1 and a fixed concentration of ARS-1620 (Upper) and G-LISA assay measuring GTP-RAS levels under high serum conditions in NCI-H358 cells upon increasing doses of 1 and a fixed concentration of ARS-1620 (Lower). (B) GTP-RAS levels measured with a G-LISA assay in NCI-H358 cells starved for 24 h in low serum conditions (−EGF), followed by 2-h treatment with increasing concentrations of 1 or 20 µM treatment of ARS-1620 and then EGF addition. For quantification, RAS GTP levels without EGF and in the presence of DMSO were set to 1 (A and B). (C) pERK and pAKT levels in NCI-H358 cells starved for 24 h in low serum conditions (−EGF), followed by 2-h treatment with increasing concentrations of 1 (red), 44 (green), and ARS-1620 (blue); then EGF addition were quantified. DMSO-treated samples after EGF stimulation were set to 100%. (D) GTP-RAS levels measured with a G-LISA assay in NCI-H358 cells with treatment of 50 µM compound 1, 20 µM ARS-1620 and simultaneous treatment of 1 and ARS-1620. For quantification, RAS GTP levels in the presence of DMSO were set to 1. (E) pERK dose–response curves for 1 (red), 44 (green), and ARS-1620 (blue) in NCI-H358 cells under high serum conditions. (F) Antiproliferative dose–response curves for NCI-H358 cells in soft agar and low serum conditions for 1 (red) and 44 (blue). DMSO-treated samples were set to 100% (E and F). Error bars indicate SDs. Indicated experiments were performed 2 or more times with similar results.

Comment in

  • Researchers Reveal Another KRAS Inhibitor.
    [No authors listed] [No authors listed] Cancer Discov. 2019 Sep;9(9):1152. doi: 10.1158/2159-8290.CD-NB2019-092. Epub 2019 Aug 6. Cancer Discov. 2019. PMID: 31387866
  • Reply to Tran et al.: Dimeric KRAS protein-protein interaction stabilizers.
    Kessler D, Gollner A, Gmachl M, Mantoulidis A, Martin LJ, Zoephel A, Mayer M, Covini D, Fischer S, Gerstberger T, Gmaschitz T, Goodwin C, Greb P, Häring D, Hela W, Hoffmann J, Karolyi-Oezguer J, Knesl P, Kornigg S, Koegl M, Kousek R, Lamarre L, Moser F, Munico-Martinez S, Peinsipp C, Phan J, Rinnenthal J, Sai J, Salamon C, Scherbantin Y, Schipany K, Schnitzer R, Schrenk A, Sharps B, Siszler G, Sun Q, Waterson A, Wolkerstorfer B, Zeeb M, Pearson M, Fesik SW, McConnell DB. Kessler D, et al. Proc Natl Acad Sci U S A. 2020 Feb 18;117(7):3365-3367. doi: 10.1073/pnas.1921236117. Epub 2020 Feb 11. Proc Natl Acad Sci U S A. 2020. PMID: 32047042 Free PMC article. No abstract available.
  • The small molecule BI-2852 induces a nonfunctional dimer of KRAS.
    Tran TH, Alexander P, Dharmaiah S, Agamasu C, Nissley DV, McCormick F, Esposito D, Simanshu DK, Stephen AG, Balius TE. Tran TH, et al. Proc Natl Acad Sci U S A. 2020 Feb 18;117(7):3363-3364. doi: 10.1073/pnas.1918164117. Epub 2020 Feb 11. Proc Natl Acad Sci U S A. 2020. PMID: 32047043 Free PMC article. No abstract available.

Similar articles

Cited by

References

    1. Colicelli J., Human RAS superfamily proteins and related GTPases. Sci. STKE 2004, RE13 (2004). - PMC - PubMed
    1. Biankin A. V., et al. ; Australian Pancreatic Cancer Genome Initiative , Pancreatic cancer genomes reveal aberrations in axon guidance pathway genes. Nature 491, 399–405 (2012). - PMC - PubMed
    1. Neumann J., Zeindl-Eberhart E., Kirchner T., Jung A., Frequency and type of KRAS mutations in routine diagnostic analysis of metastatic colorectal cancer. Pathol. Res. Pract. 205, 858–862 (2009). - PubMed
    1. Cancer Genome Atlas Research Network , Comprehensive molecular profiling of lung adenocarcinoma. Nature 511, 543–550 (2014). - PMC - PubMed
    1. Colombino M., et al. , BRAF/NRAS mutation frequencies among primary tumors and metastases in patients with melanoma. J. Clin. Oncol. 30, 2522–2529 (2012). - PubMed

Publication types

MeSH terms

Substances