

Genetic architecture and adaptations of Nunavik Inuit
- PMID: 31332017
- PMCID: PMC6689950
- DOI: 10.1073/pnas.1810388116
Genetic architecture and adaptations of Nunavik Inuit
Abstract
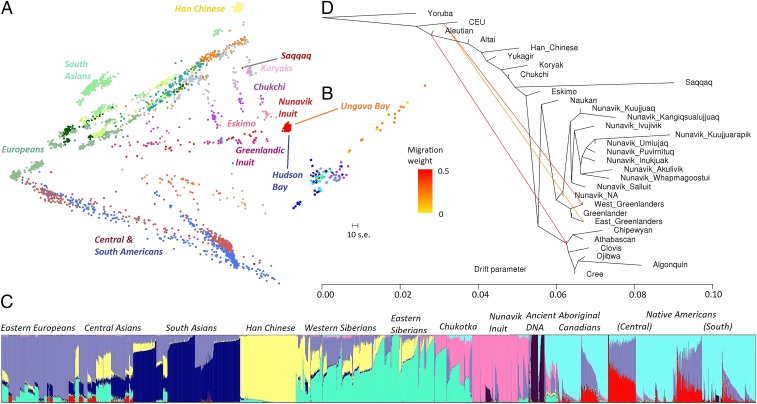
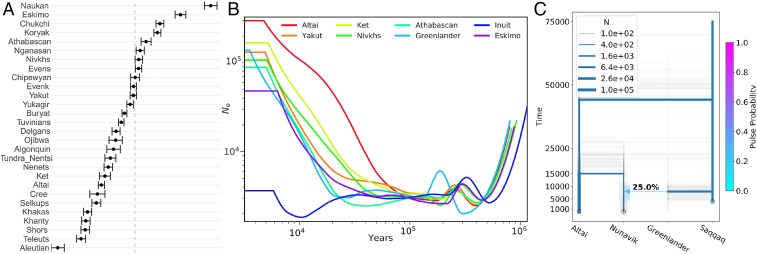
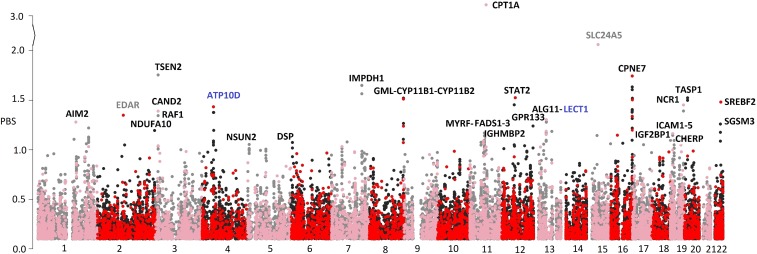
The Canadian Inuit have a distinct population background that may entail particular implications for the health of its individuals. However, the number of genetic studies examining this Inuit population is limited, and much remains to be discovered in regard to its genetic characteristics. In this study, we generated whole-exome sequences and genomewide genotypes for 170 Nunavik Inuit, a small and isolated founder population of Canadian Arctic indigenous people. Our study revealed the genetic background of Nunavik Inuit to be distinct from any known present-day population. The majority of Nunavik Inuit show little evidence of gene flow from European or present-day Native American peoples, and Inuit living around Hudson Bay are genetically distinct from those around Ungava Bay. We also inferred that Nunavik Inuit have a small effective population size of 3,000 and likely split from Greenlandic Inuit ∼10.5 kya. Nunavik Inuit went through a bottleneck at approximately the same time and might have admixed with a population related to the Paleo-Eskimos. Our study highlights population-specific genomic signatures in coding regions that show adaptations unique to Nunavik Inuit, particularly in pathways involving fatty acid metabolism and cellular adhesion (CPNE7, ICAM5, STAT2, and RAF1). Subsequent analyses in selection footprints and the risk of intracranial aneurysms (IAs) in Nunavik Inuit revealed an exonic variant under weak negative selection to be significantly associated with IA (rs77470587; P = 4.6 × 10⁻⁸).
Keywords: Nunavik Inuit; demographic history; genetic architecture; intracranial aneurysm; natural selection.
Conflict of interest statement
The authors declare no conflict of interest.
Figures
Similar articles
-
Increased missense mutation burden of Fatty Acid metabolism related genes in nunavik inuit population.PLoS One. 2015 May 26;10(5):e0128255. doi: 10.1371/journal.pone.0128255. eCollection 2015. PLoS One. 2015. PMID: 26010953 Free PMC article. Clinical Trial.
-
Identification of a Founder GLDN Variant Associated With "Lethal" Arthrogryposis in Nunavik Inuit: Implications for Obstetrical and Long-Term Survivors' Management.Am J Med Genet A. 2025 May;197(5):e63974. doi: 10.1002/ajmg.a.63974. Epub 2024 Dec 23. Am J Med Genet A. 2025. PMID: 39713852
-
Gut metagenome profile of the Nunavik Inuit youth is distinct from industrial and non-industrial counterparts.Commun Biol. 2022 Dec 24;5(1):1415. doi: 10.1038/s42003-022-04372-y. Commun Biol. 2022. PMID: 36566300 Free PMC article.
-
Twenty "must-read" research articles for primary care providers in Nunavik: scoping study and development of an information tool.Int J Circumpolar Health. 2019 Dec;78(1):1578638. doi: 10.1080/22423982.2019.1578638. Int J Circumpolar Health. 2019. PMID: 30831057 Free PMC article.
-
Genetics of metabolic traits in Greenlanders: lessons from an isolated population.J Intern Med. 2018 Nov;284(5):464-477. doi: 10.1111/joim.12814. Epub 2018 Aug 12. J Intern Med. 2018. PMID: 30101502 Review.
Cited by
-
The Peopling and Migration History of the Natives in Peninsular Malaysia and Borneo: A Glimpse on the Studies Over the Past 100 years.Front Genet. 2022 Jan 27;13:767018. doi: 10.3389/fgene.2022.767018. eCollection 2022. Front Genet. 2022. PMID: 35154269 Free PMC article. Review.
-
Risk factors associated with developing anxiety in Inuit adolescents from Nunavik.Neurotoxicol Teratol. 2020 Sep-Oct;81:106903. doi: 10.1016/j.ntt.2020.106903. Epub 2020 Jun 6. Neurotoxicol Teratol. 2020. PMID: 32512128 Free PMC article.
-
Life-threatening viral disease in a novel form of autosomal recessive IFNAR2 deficiency in the Arctic.J Exp Med. 2022 Jun 6;219(6):e20212427. doi: 10.1084/jem.20212427. Epub 2022 Apr 20. J Exp Med. 2022. PMID: 35442417 Free PMC article.
-
The role of genetic selection and climatic factors in the dispersal of anatomically modern humans out of Africa.Proc Natl Acad Sci U S A. 2023 May 30;120(22):e2213061120. doi: 10.1073/pnas.2213061120. Epub 2023 May 23. Proc Natl Acad Sci U S A. 2023. PMID: 37220274 Free PMC article.
-
Analysis of whole exome sequencing in severe mental illness hints at selection of brain development and immune related genes.Sci Rep. 2021 Oct 26;11(1):21088. doi: 10.1038/s41598-021-00123-x. Sci Rep. 2021. PMID: 34702870 Free PMC article. Clinical Trial.
References
-
- Raghavan M, et al. The genetic prehistory of the New World Arctic. Science. 2014;345:1255832. - PubMed
-
- Anand SS, et al. Risk factors, atherosclerosis, and cardiovascular disease among aboriginal people in Canada: The Study of Health Assessment and Risk Evaluation in Aboriginal Peoples (SHARE-AP) Lancet. 2001;358:1147–1153. - PubMed
-
- Noël M, et al. Cardiovascular risk factors and subclinical atherosclerosis among Nunavik Inuit. Atherosclerosis. 2012;221:558–564. - PubMed
Publication types
MeSH terms
LinkOut - more resources
Full Text Sources
Research Materials
Miscellaneous
