

Prestimulus feedback connectivity biases the content of visual experiences
- PMID: 31332019
- PMCID: PMC6689959
- DOI: 10.1073/pnas.1817317116
Prestimulus feedback connectivity biases the content of visual experiences
Abstract
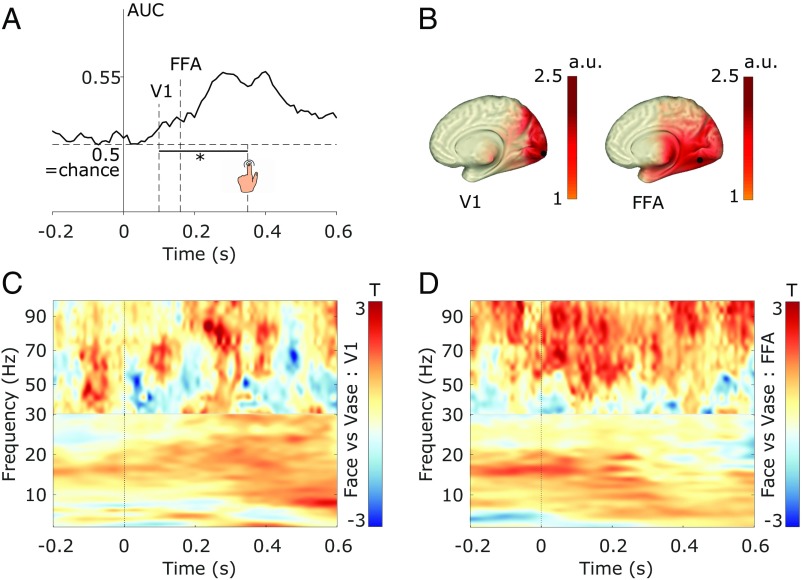
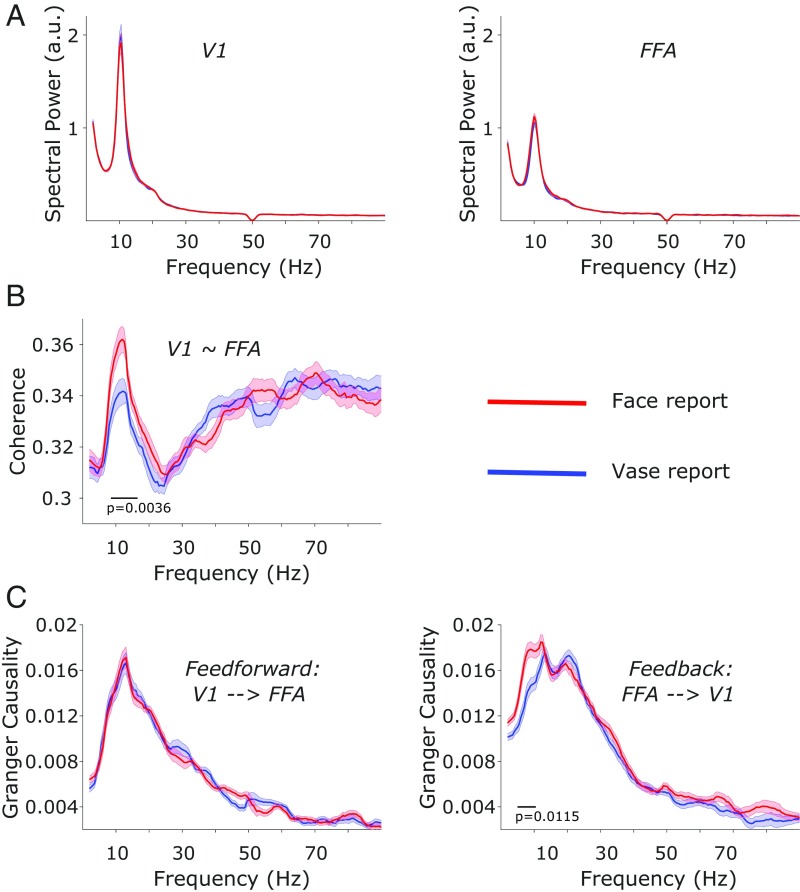
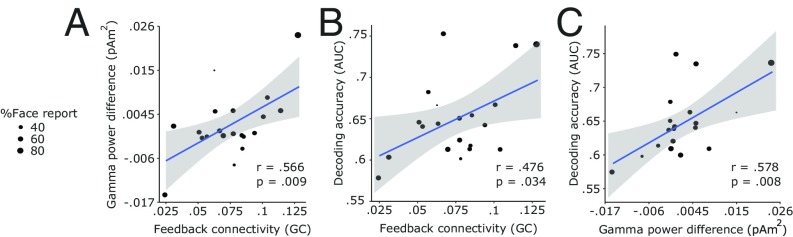
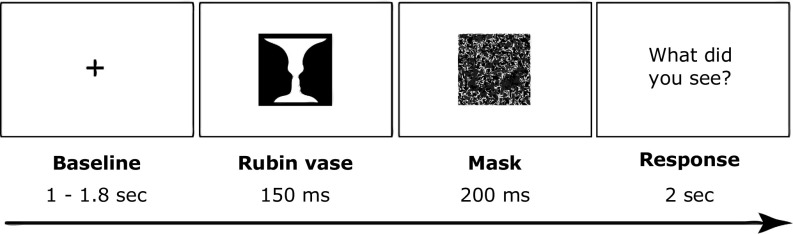
Ongoing fluctuations in neural excitability and in networkwide activity patterns before stimulus onset have been proposed to underlie variability in near-threshold stimulus detection paradigms-that is, whether or not an object is perceived. Here, we investigated the impact of prestimulus neural fluctuations on the content of perception-that is, whether one or another object is perceived. We recorded neural activity with magnetoencephalography (MEG) before and while participants briefly viewed an ambiguous image, the Rubin face/vase illusion, and required them to report their perceived interpretation in each trial. Using multivariate pattern analysis, we showed robust decoding of the perceptual report during the poststimulus period. Applying source localization to the classifier weights suggested early recruitment of primary visual cortex (V1) and ∼160-ms recruitment of the category-sensitive fusiform face area (FFA). These poststimulus effects were accompanied by stronger oscillatory power in the gamma frequency band for face vs. vase reports. In prestimulus intervals, we found no differences in oscillatory power between face vs. vase reports in V1 or in FFA, indicating similar levels of neural excitability. Despite this, we found stronger connectivity between V1 and FFA before face reports for low-frequency oscillations. Specifically, the strength of prestimulus feedback connectivity (i.e., Granger causality) from FFA to V1 predicted not only the category of the upcoming percept but also the strength of poststimulus neural activity associated with the percept. Our work shows that prestimulus network states can help shape future processing in category-sensitive brain regions and in this way bias the content of visual experiences.
Keywords: MEG; connectivity; oscillations; prestimulus; visual object perception.
Copyright © 2019 the Author(s). Published by PNAS.
Conflict of interest statement
The authors declare no conflict of interest.
Figures
Similar articles
-
Efficient Prestimulus Network Integration of Fusiform Face Area Biases Face Perception during Binocular Rivalry.J Cogn Neurosci. 2022 May 2;34(6):1001-1014. doi: 10.1162/jocn_a_01843. J Cogn Neurosci. 2022. PMID: 35258573 Free PMC article.
-
Prestimulus Alpha Power Influences Tactile Temporal Perceptual Discrimination and Confidence in Decisions.Cereb Cortex. 2016 Mar;26(3):891-903. doi: 10.1093/cercor/bhu247. Epub 2014 Oct 19. Cereb Cortex. 2016. PMID: 25331603
-
How ongoing fluctuations in human visual cortex predict perceptual awareness: baseline shift versus decision bias.J Neurosci. 2009 Jul 8;29(27):8715-25. doi: 10.1523/JNEUROSCI.0962-09.2009. J Neurosci. 2009. PMID: 19587278 Free PMC article.
-
U-shaped Relation between Prestimulus Alpha-band and Poststimulus Gamma-band Power in Temporal Tactile Perception in the Human Somatosensory Cortex.J Cogn Neurosci. 2018 Apr;30(4):552-564. doi: 10.1162/jocn_a_01219. Epub 2017 Dec 15. J Cogn Neurosci. 2018. PMID: 29244637
-
High frequency oscillations as a correlate of visual perception.Int J Psychophysiol. 2011 Jan;79(1):32-8. doi: 10.1016/j.ijpsycho.2010.07.004. Epub 2010 Jul 21. Int J Psychophysiol. 2011. PMID: 20654659 Review.
Cited by
-
A multiplex of connectome trajectories enables several connectivity patterns in parallel.Elife. 2025 Jun 13;13:RP98777. doi: 10.7554/eLife.98777. Elife. 2025. PMID: 40511797 Free PMC article.
-
Network mechanisms of ongoing brain activity's influence on conscious visual perception.Nat Commun. 2024 Jul 8;15(1):5720. doi: 10.1038/s41467-024-50102-9. Nat Commun. 2024. PMID: 38977709 Free PMC article.
-
Relevance of pre-stimulus oscillatory activity for the perceived valence of emotional facial expressions.Sci Rep. 2024 Aug 20;14(1):19263. doi: 10.1038/s41598-024-69433-0. Sci Rep. 2024. PMID: 39164318 Free PMC article.
-
Accounting for endogenous effects in decision-making with a non-linear diffusion decision model.Sci Rep. 2023 Apr 18;13(1):6323. doi: 10.1038/s41598-023-32841-9. Sci Rep. 2023. PMID: 37072460 Free PMC article.
-
The role of attention and explicit knowledge in perceiving bistable auditory input.Psychophysiology. 2021 Sep;58(9):e13875. doi: 10.1111/psyp.13875. Epub 2021 Jun 10. Psychophysiology. 2021. PMID: 34110020 Free PMC article.
References
-
- Arieli A., Sterkin A., Grinvald A., Aertsen A., Dynamics of ongoing activity: Explanation of the large variability in evoked cortical responses. Science 273, 1868–1871 (1996). - PubMed
-
- Başar E., Gönder A., Ungan P., Important relation between EEG and brain evoked potentials. II. A systems analysis of electrical signals from the human brain. Biol. Cybern. 25, 41–48 (1976). - PubMed
-
- Başar E., Gönder A., Ungan P., Important relation between EEG and brain evoked potentials. I. Resonance phenomena in subdural structures of the cat brain. Biol. Cybern. 25, 27–40 (1976). - PubMed
-
- Rahn E., Başar E., Prestimulus EEG-activity strongly influences the auditory evoked vertex response: A new method for selective averaging. Int. J. Neurosci. 69, 207–220 (1993). - PubMed
Publication types
MeSH terms
Grants and funding
LinkOut - more resources
Full Text Sources
