. 2019 Sep 23;63(10):e00790-19.
doi: 10.1128/AAC.00790-19. Print 2019 Oct.

Environment Shapes the Accessible Daptomycin Resistance Mechanisms in Enterococcus faecium

Affiliations

Environment Shapes the Accessible Daptomycin Resistance Mechanisms in Enterococcus faecium

Amy G Prater et al. Antimicrob Agents Chemother. .

Abstract

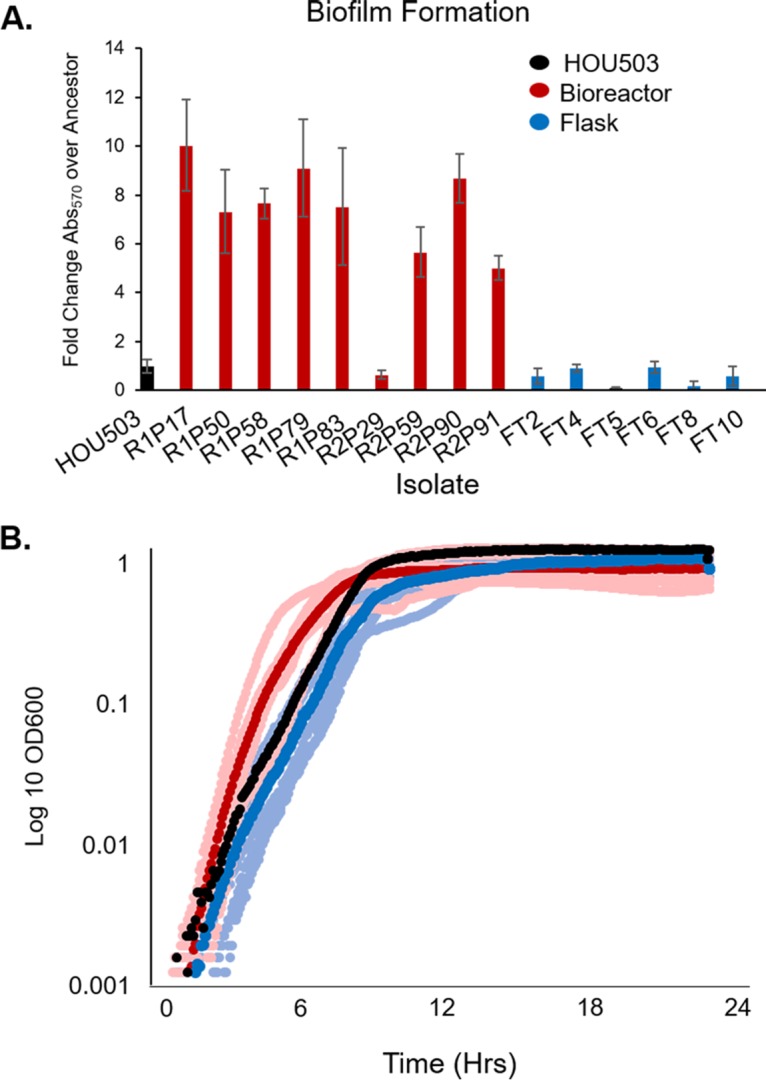
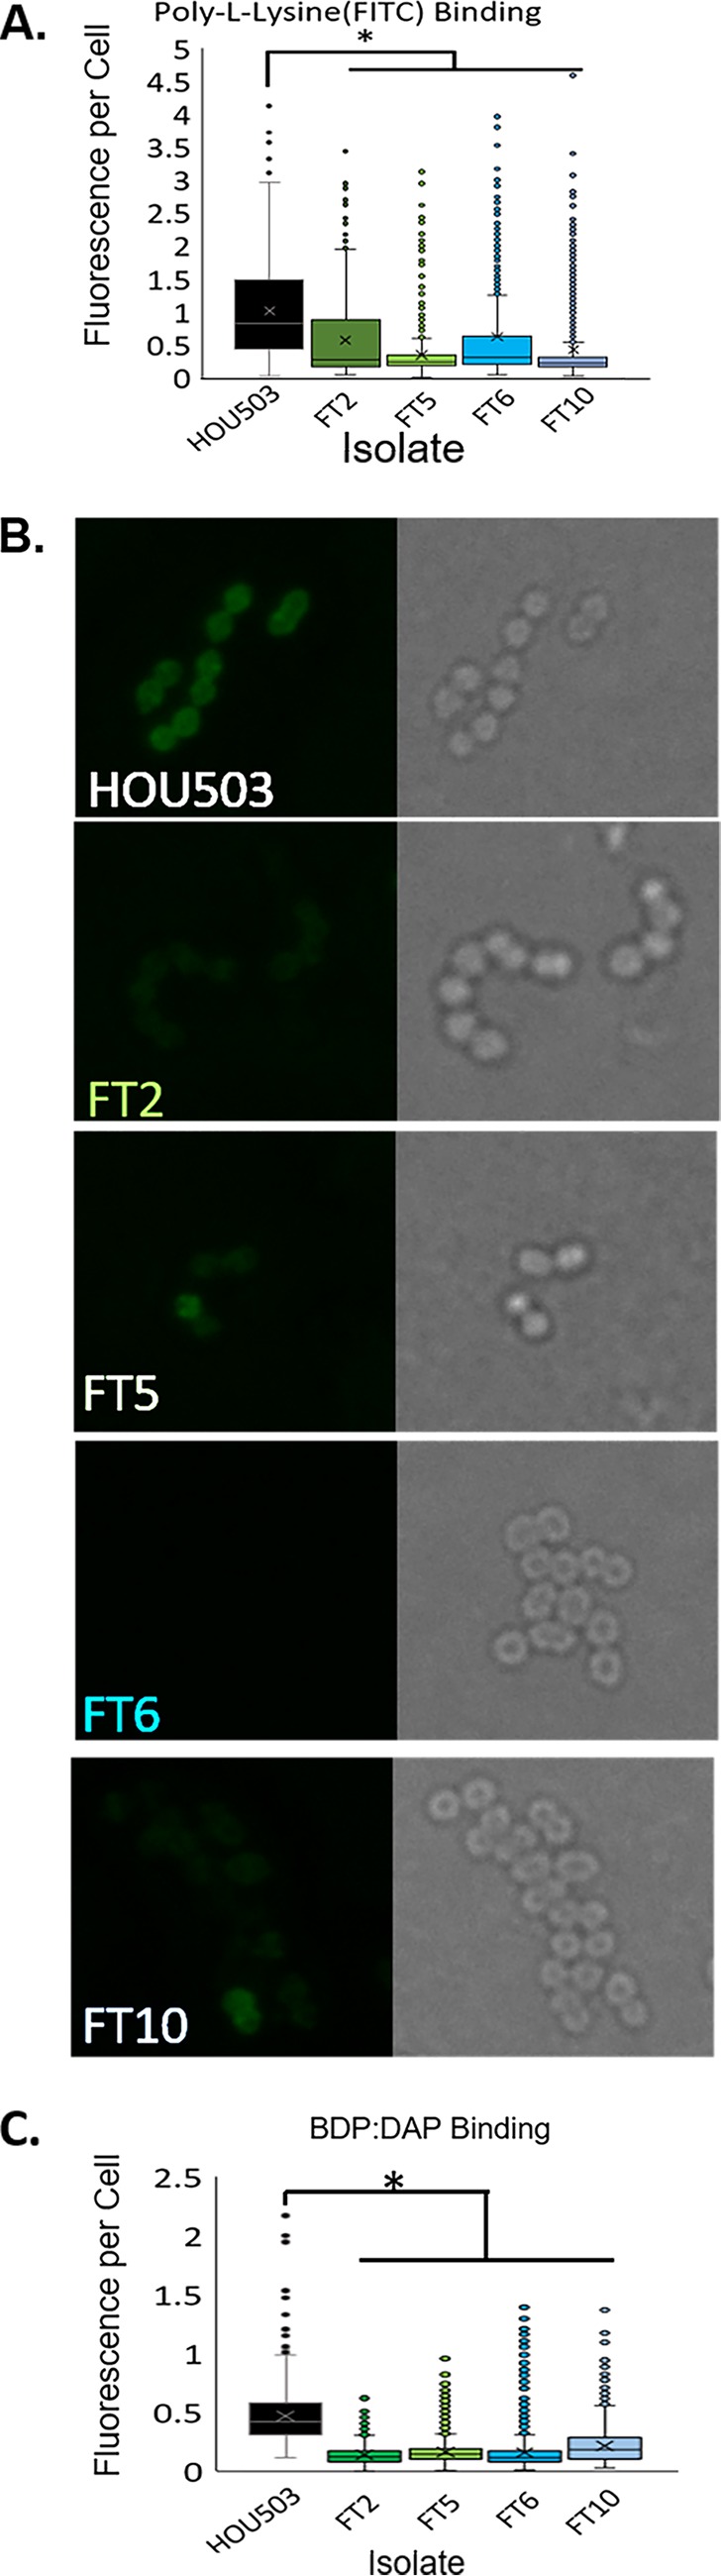
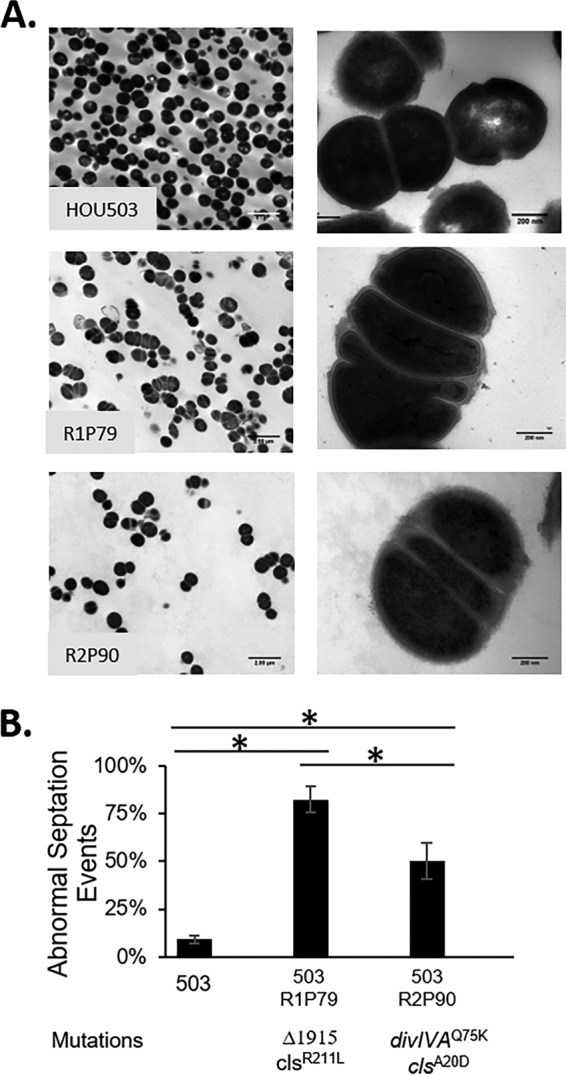
Daptomycin binds to bacterial cell membranes and disrupts essential cell envelope processes, leading to cell death. Bacteria respond to daptomycin by altering their cell envelopes to either decrease antibiotic binding to the membrane or by diverting binding away from septal targets. In Enterococcus faecalis, daptomycin resistance is typically coordinated by the three-component cell envelope stress response system, LiaFSR. Here, studying a clinical strain of multidrug-resistant Enterococcus faecium containing alleles associated with activation of the LiaFSR signaling pathway, we found that specific environments selected for different evolutionary trajectories, leading to high-level daptomycin resistance. Planktonic environments favored pathways that increased cell surface charge via yvcRS upregulation of dltABCD and mprF, causing a reduction in daptomycin binding. Alternatively, environments favoring complex structured communities, including biofilms, evolved both diversion and repulsion strategies via divIVA and oatA mutations, respectively. Both environments subsequently converged on cardiolipin synthase (cls) mutations, suggesting the importance of membrane modification across strategies. Our findings indicate that E. faecium can evolve diverse evolutionary trajectories to daptomycin resistance that are shaped by the environment to produce a combination of resistance strategies. The accessibility of multiple and different biochemical pathways simultaneously suggests that the outcome of daptomycin exposure results in a polymorphic population of resistant phenotypes, making E. faecium a recalcitrant nosocomial pathogen.

Keywords: Enterococcus; adaptive resistance; drug resistance evolution.


Figures

FIG 1
FIG 1
Varying the adaptive environment selects for distinctive and divergent phenotypes. The bioreactor (red) and flask (blue) environments evolve distinctly different phenotypes. (A) A crystal violet assay was used to quantify biofilm formation of 16 endpoint isolates and is reported as the fold change in crystal violet absorbance at 570 nm (Abs570) over the level for the ancestor. All bioreactor isolates (except R2PXXIX) produced more biofilm than the ancestor. Error bars represent standard deviations. (B) Growth rates were performed in a microplate reader in triplicate for all endpoint isolates. The dark red and blue markers indicate the average growth for each adaptive environment, with the lighter shades showing the average growth of individual isolates and the ancestor in black.
FIG 2
FIG 2
Flask-transfer isolates with mutations in yvcRS had upregulated dltA and mprF transcripts. qPCR was used to measure transcript levels of flask-transfer isolates using gdhIV as a reference. (A) dltA transcript levels compared to those of the ancestor. (B) mprF transcript levels compared to those of the ancestor.
FIG 3
FIG 3
Isolates with mutations in yvcRS had a more positively charged cell surface and bound less BDP:DAP than the ancestor, HOU503. (A) The relative cell surface charge was determined by incubation with PLL:FITC. Cells that bind less PLL:FITC have a more positive cell surface charge. An asterisks indicates statistical significance (P < 0.05) using the Mann-Whitney test with post hoc Holm-Bonferroni adjustment. ImageJ was used for quantification. Physical images can be viewed in Fig. S2. (B) Isolates were incubated with BDP:DAP to determine DAP binding patterns. (C) Quantification of BDP:DAP binding per cell. An asterisks indicates statistical significance (P < 0.05) using the Mann-Whitney test with post hoc Holm-Bonferroni adjustment. ImageJ was used for quantification.
FIG 4
FIG 4
Adaption within a bioreactor environment favoring rapid growth and biofilm formation produced two predominant evolutionary trajectories. Combining the WGS data from endpoint isolates that identified genetic linkage with the metagenomic frequency data over time established the likely sequence of events that resulted in DAP-resistant trajectories. Dashed lines indicate that the frequency of the subsequent mutation(s) identified in specific endpoint isolates were below the level of detection (<3%) in the overall bioreactor population. The low frequency of these mutations within the population suggests that they were acquired toward the end of adaptation. The DAP concentration each day of the experiment is across the top in gray. Final DAP MICs of each trajectory are denoted in red at the right. (A) Population 1 evolved 2 main trajectories opening with either a mutation in oatA or Δ1915, followed by additional mutations, including in cls. (B) Population 2 evolved one main trajectory with a mutation in divIVA followed by mutations in cls.
FIG 5
FIG 5
Bioreactor isolates containing divIVA-associated mutations produced abnormal septa. (A) TEM was used at 5,000× (left) and 50,000× (right) to observe cellular morphology of endpoint isolates containing mutations in divIVA. (B) The percentage of abnormal septal events was determined. An asterisks indicates statistical significance (P < 0.05) using the Student t test.
FIG 6
FIG 6
Bioreactor isolates with divIVA-associated mutations produced more complex DAP resistance phenotypes. (A) The relative cell surface charge was determined by incubating the isolates with PLL:FITC. Cells that bind less PLL:FITC have a more positive cell surface charge. R2PXC bound significantly less PLL:FITC than the ancestor, indicating a more positively charged cell surface. An asterisks indicates statistical significance (P < 0.05) using the Mann-Whitney test with post hoc Holm-Bonferroni adjustment. Physical images can be viewed in Fig. S2. (B) Quantification of BDP:DAP binding per cell using ImageJ. An asterisks indicates statistical significance (P < 0.05) using the Mann-Whitney test with post hoc Holm-Bonferroni adjustment. (C) Isolates were incubated with BDP:DAP to determine DAP binding patterns. E. faecalis R712 acts as a control to show the redistribution of binding phenotype. (D) Isolates were incubated with NAO to determine phospholipid microdomain patterning. E. faecalis R712 acts as a control to show the redistribution phenotype, while E. faecalis S613 shows normal staining.
FIG 7
FIG 7
Bioreactor-derived isolates with mutations in oatA had decreased peptidoglycan O-acetylation and increased cell surface charge, consistent with reduced BDP:DAP binding. (A) Lysozyme sensitivity was determined by incubation with or without 0.5 mg/ml lysozyme for 30 min at 37°C. Lane 1, EZ-RUN prestained protein ladder; lanes 2 to 4, incubation with no lysozyme; lanes 2, 5, 8, and 11, HOU503; lanes 3, 6, 9, and 12, R1P50; lanes 4, 7, 10, and 13, R1P83. (B) The relative cell surface charge was determined by incubating the isolates with PLL:FITC. Cells that bind less PLL:FITC have a more positive cell surface charge. An asterisks indicates statistical significance (P < 0.05) using the Mann-Whitney test with post hoc Holm-Bonferroni adjustment. ImageJ was used for quantification. Physical images can be viewed in Fig. S2. (C) Isolates were incubated with BDP:DAP to determine DAP binding patterns. (D) Quantification of BDP:DAP binding per cell. An asterisks indicates statistical significance (P < 0.05) using the Mann-Whitney test with post hoc Holm-Bonferroni adjustment. ImageJ was used for quantification. E. faecalis R712 acts as a control to show the redistribution phenotype, while E. faecalis S613 shows normal staining.

Similar articles

Cited by

References

    1. CDC. 2013. Antibiotic resistance threats in the United States, 2013. Centers for Disease Control and Prevention, Atlanta, GA.
    1. Boucher HW, Talbot GH, Bradley JS, Edwards JE, Gilbert D, Rice LB, Scheld M, Spellberg B, Bartlett J. 2009. Bad bugs, no drugs: no ESKAPE! An update from the Infectious Diseases Society of America. Clin Infect Dis 48:1–12. doi:10.1086/595011. - DOI - PubMed
    1. Arias CA, Panesso D, McGrath DM, Qin X, Mojica MF, Miller C, Diaz L, Tran TT, Rincon S, Barbu EM, Reyes J, Roh JH, Lobos E, Sodergren E, Pasqualini R, Arap W, Quinn JP, Shamoo Y, Murray BE, Weinstock GM. 2011. Genetic basis for in vivo daptomycin resistance in enterococci. N Engl J Med 365:892–900. doi:10.1056/NEJMoa1011138. - DOI - PMC - PubMed
    1. Arias CA, Murray BE. 2012. The rise of the Enterococcus: beyond vancomycin resistance. Nat Rev Microbiol 10:266. doi:10.1038/nrmicro2761. - DOI - PMC - PubMed
    1. Hollenbeck BL, Rice LB. 2012. Intrinsic and acquired resistance mechanisms in enterococcus. Virulence 3:421–433. doi:10.4161/viru.21282. - DOI - PMC - PubMed

Publication types

MeSH terms