. 2019 Jul 22;10(1):3277.
doi: 10.1038/s41467-019-10842-5.

An inter-model assessment of the role of direct air capture in deep mitigation pathways

Affiliations

An inter-model assessment of the role of direct air capture in deep mitigation pathways

Giulia Realmonte et al. Nat Commun. .

Abstract

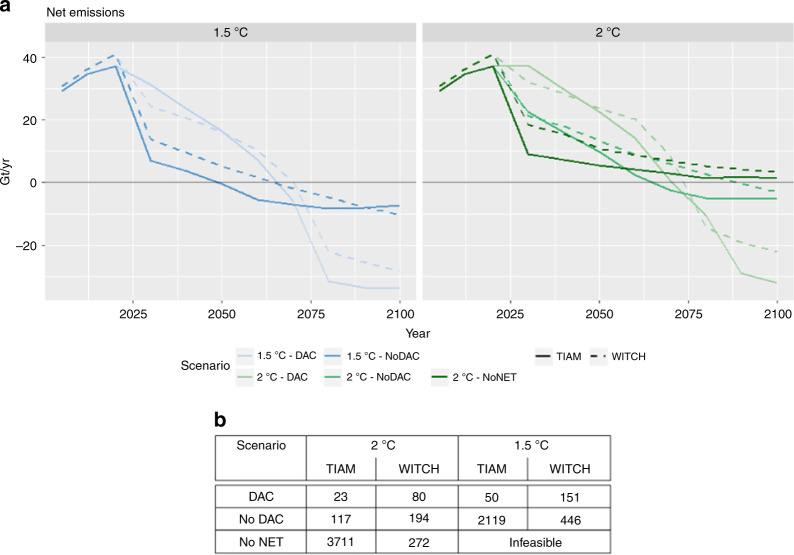
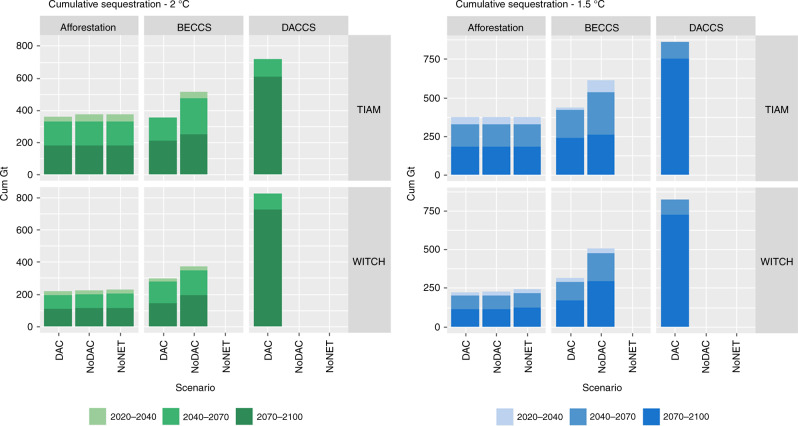
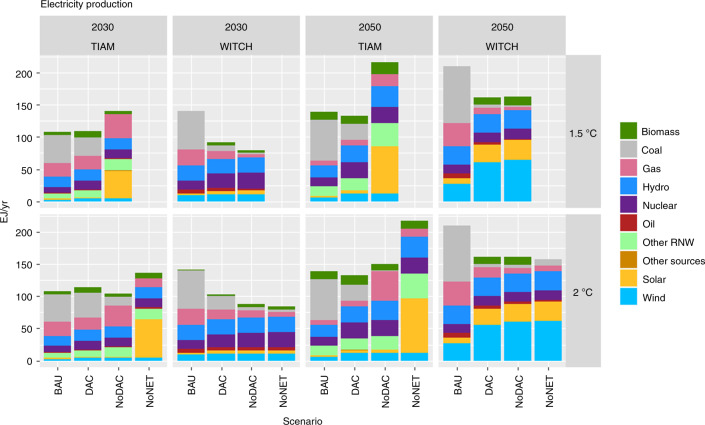
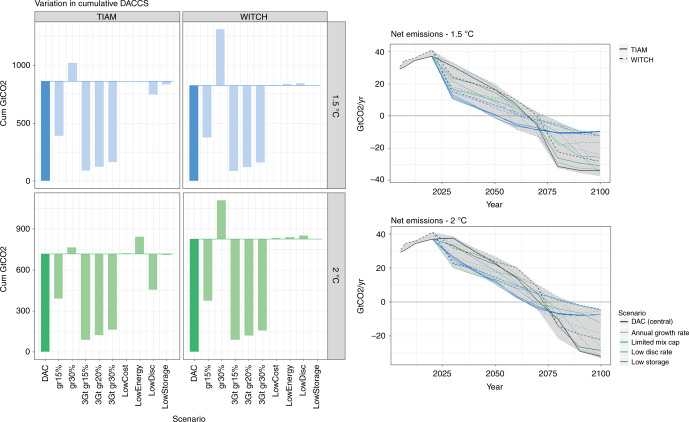
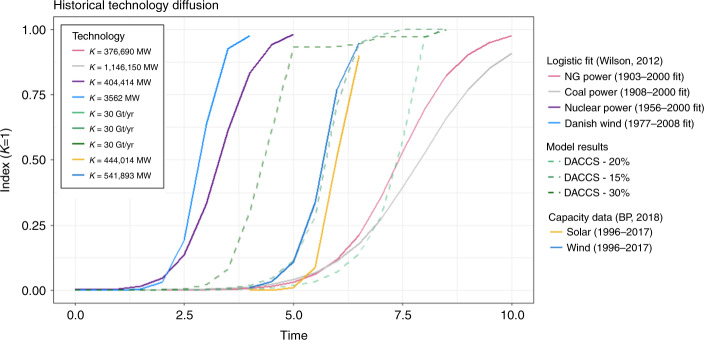
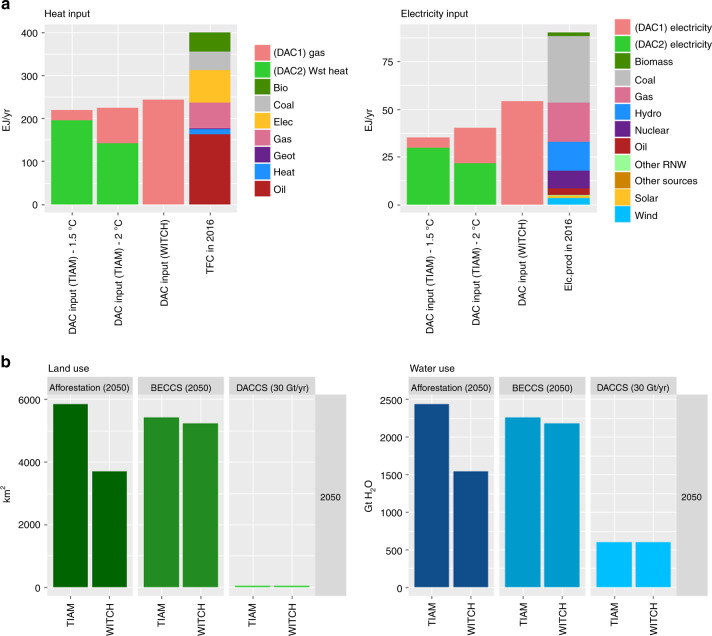
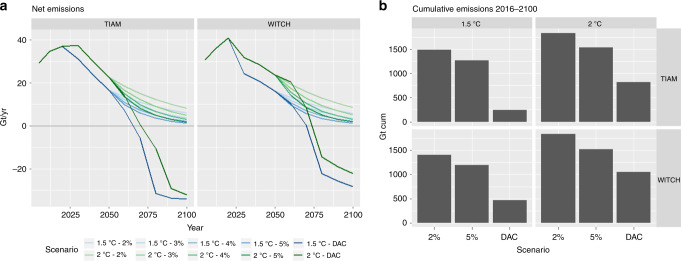
The feasibility of large-scale biological CO2 removal to achieve stringent climate targets remains unclear. Direct Air Carbon Capture and Storage (DACCS) offers an alternative negative emissions technology (NET) option. Here we conduct the first inter-model comparison on the role of DACCS in 1.5 and 2 °C scenarios, under a variety of techno-economic assumptions. Deploying DACCS significantly reduces mitigation costs, and it complements rather than substitutes other NETs. The key factor limiting DACCS deployment is the rate at which it can be scaled up. Our scenarios' average DACCS scale-up rates of 1.5 GtCO2/yr would require considerable sorbent production and up to 300 EJ/yr of energy input by 2100. The risk of assuming that DACCS can be deployed at scale, and finding it to be subsequently unavailable, leads to a global temperature overshoot of up to 0.8 °C. DACCS should therefore be developed and deployed alongside, rather than instead of, other mitigation options.


Conflict of interest statement

The authors declare no competing interests.

Figures

Fig. 1
Fig. 1
CO2 emission pathways and carbon price in 2030 in central case scenarios. CO2 emissions (a) are from fossil fuel burning only, while the carbon price (b) is expressed in USD per ton of CO2
Fig. 2
Fig. 2
Cumulative sequestration of negative emissions technologies throughout the century in central case scenarios, with different temperature targets. The short (2020–2040), mid (2040–2070), and long-term role (2070–2100) of each strategy has been highlighted
Fig. 3
Fig. 3
Electricity mix in 2030 and 2050 in central case scenarios, compared to the Business-As-Usual (BAU). BAU assumes no mitigation policy to be implemented from 2020 on: economic and population growth are calibrated according to Shared Socio-Economic Pathways 2 in both models
Fig. 4
Fig. 4
Sensitivity on key parameters: in a light green bars show the change in cumulative sequestration by DACCS with respect to the base case (i.e. DAC scenario, represented by the first bar) across all sensitivities; b shows the emission pathway. Sensitivities have been grouped into four categories to highlight the most influential factors: those related to annual growth rates, maximum capacity, discount rates and storage availability. Energy and cost sensitivities are not included due to the limited impact of these parameters
Fig. 5
Fig. 5
Comparison of DACCS up-scaling with historical technology diffusion. Past technology diffusion pathways are based on data from Wilson and recent statistics for solar PV and wind. As these technologies have been diffusing in different years and with different scales (i.e. the extent K reached by the logistic profile), we have normalized the data indexing the capacity extent K to 1, and we have harmonized the starting year (t = 0), considering a unit time scale equal to one decade
Fig. 6
Fig. 6
Impact of DACCS in terms of energy input, land and water use. a shows the energy input required to operate DACCS plants capturing about 30 GtCO2/year. Note that from TIAM-Grantham we have a differentiation among the two DACCS technologies, with different heat sources, while in WITCH we only have gas-fired DAC1 plants. Heat and electricity inputs are compared with the 2016 Total Final Consumption and electricity production respectively, as reported by the International Energy Agency. b shows the amount of land and water used by DACCS plants to capture 30 GtCO2/year compared to BECCS and afforestation, when these are deployed at the levels foreseen by the models in 2050
Fig. 7
Fig. 7
Emission pathway and cumulative emissions in DACCS failure scenarios. The left panels a shows the emission pathways of the original DACCS scenarios and those with no DACCS and exogenous emission reductions between 2 and 5%. The right panels b show the 2016–2100 cumulative emissions of CO2. In this case, carbon emissions for WITCH include both fossil burning, industry and land use

References

    1. Intergovernmental Panel on Climate Change (IPCC). Global warming of 1.5 °C. An IPCC Special Report on the impacts of global warming of 1.5 °C above pre-industrial levels and related global greenhouse gas emission pathways, in the context of strengthening the global response to the threat of climate change, sustainable development, and efforts to eradicate poverty. (2018) (In Press).
    1. Le Quéré C, et al. Global carbon budget 2017. Earth Syst. Sci. Data. 2018;10:405–448.
    1. Intergovernmental Panel on Climate Change (IPCC). Climate Change 2014: Synthesis Report. Contribution of Working Groups I, II and III to the Fifth Assessment Report of the Intergovernmental Panel on Climate Change IPCC (Geneva, 2014).
    1. Smith LJ, Torn MS. Ecological limits to terrestrial biological carbon dioxide removal. Clim. Change. 2013;118:89–103.
    1. Smith P, et al. Biophysical and economic limits to negative CO2 emissions. Nat. Clim. Change. 2016;6:42–50.

Publication types