. 2019 Jul 22;10(1):3266.
doi: 10.1038/s41467-019-11257-y.

Predicting bacterial infection outcomes using single cell RNA-sequencing analysis of human immune cells

Affiliations

Predicting bacterial infection outcomes using single cell RNA-sequencing analysis of human immune cells

Noa Bossel Ben-Moshe et al. Nat Commun. .

Abstract

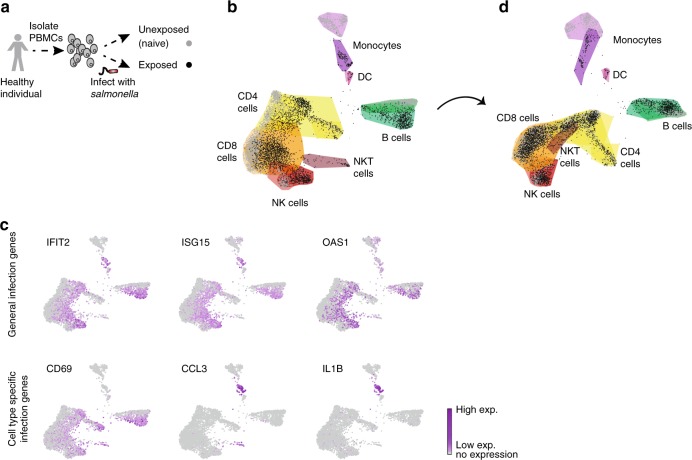
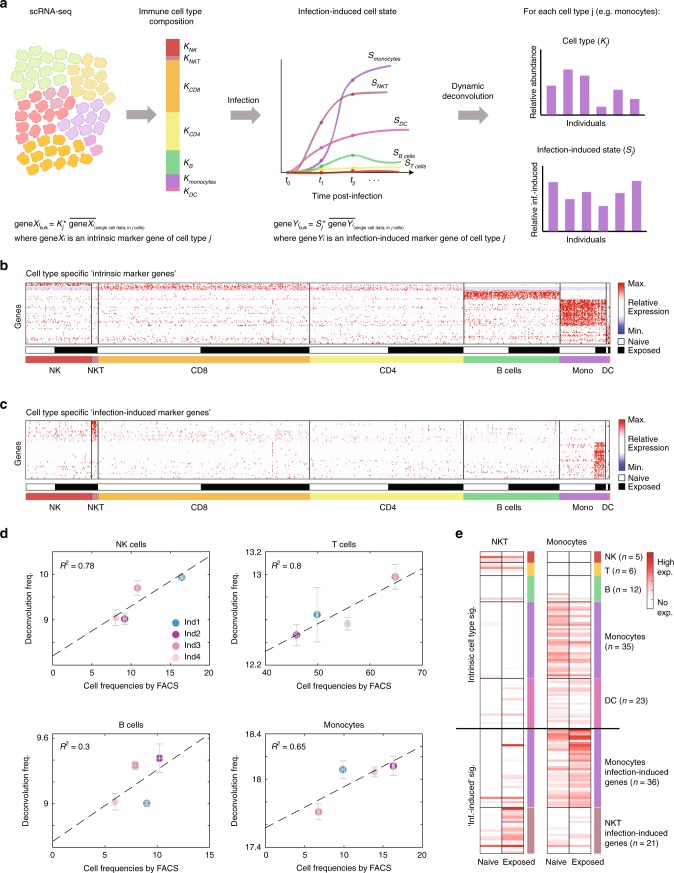
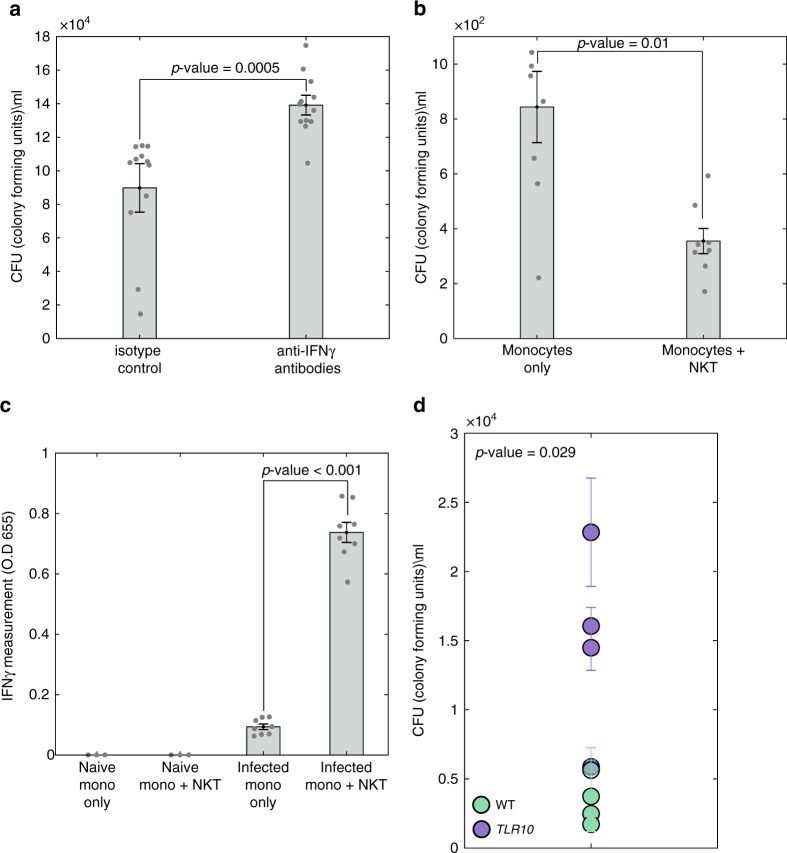
Complex interactions between different host immune cell types can determine the outcome of pathogen infections. Advances in single cell RNA-sequencing (scRNA-seq) allow probing of these immune interactions, such as cell-type compositions, which are then interpreted by deconvolution algorithms using bulk RNA-seq measurements. However, not all aspects of immune surveillance are represented by current algorithms. Here, using scRNA-seq of human peripheral blood cells infected with Salmonella, we develop a deconvolution algorithm for inferring cell-type specific infection responses from bulk measurements. We apply our dynamic deconvolution algorithm to a cohort of healthy individuals challenged ex vivo with Salmonella, and to three cohorts of tuberculosis patients during different stages of disease. We reveal cell-type specific immune responses associated not only with ex vivo infection phenotype but also with clinical disease stage. We propose that our approach provides a predictive power to identify risk for disease, and human infection outcomes.


Conflict of interest statement

The authors declare no competing interests.

Figures

Fig. 1
Fig. 1
scRNA-seq analysis of human PBMCs before and after ex vivo Salmonella infection. a Overview of the scRNA-seq experiment: PBMCs were isolated from a blood sample of a healthy individual and were infected ex vivo with Salmonella (exposed), or remained unexposed (naïve). Overall ~7000 cells were sequenced using 10x genomics Chromium. b Visualization of the scRNA-seq data using forced layout on a two-dimensional space by k-nearest neighbor (KNN)-graph (k = 20; naive cells (gray) and exposed cells (black)). K-means clustering of the cells revealed the seven main cell types: NK cells (red), CD8 T cells (orange), CD4 T cells (yellow), NKT cells (brown), B cells (green), monocytes (purple), and dendritic cells (DC; pink), as inferred using cluster-specific genes and marker genes expression (see Supplementary Data 1 and Supplementary Fig. 3d). Colored contours represent cells which belong to the same cell type in each sample (see also Supplementary Fig. 3a–c for complete KNN-graph with edges and clusters). c Expression levels of representative genes from the infection signature (see methods and Supplementary Fig. 5). Top: general infection genes which are upregulated following Salmonella infection in all exposed cells, and bottom: cell-type specific infection genes. Gene expression is shown using the same layout as in b, with the nodes colored by the indicated gene expression in each cell (see colorbar). d KNN-graph (k = 20) of the scRNA-seq data after removal of the global infection signature eliminated the separation between naïve and exposed cells for all cell types, except for the monocytes, which contain intracellular bacteria. Colors and contours are the same as in b (see also Supplementary Fig. 3e–g)
Fig. 2
Fig. 2
Characterization of human PBMCs intrinsic sub-types before and after Salmonella infection. a Classification of exposed cells inferred from the cell sub-types of the naive cells using KNN-classification. The connectivity matrix entries are the calculated percentage of cells from each sub-type of the exposed sample (y-axis) that were classified to each sub-type of the naive sample (x-axis) (see colorbar to the right corresponding to the matrix entries). Cell sub-types identity was inferred from the differentially expressed genes that uniquely characterize each sub-type (Supplementary Fig. 7; color code of sub-types from blue to red represents activation state, found already at steady-state, regardless of the infection response). b Graph-based clustering revealed the repertoire of immune sub-types before and after infection (intrinsic fingerprints). The middle circle presents the contours of the cell types based on the KNN-graph from Fig. 1d, and for each cell type further partition into sub-types is shown. Contours are drawn for both the naive and exposed samples together as classified by the KNN-classification in a, without the infection genes (colorbar represents activation state from blue to red, which exists already at steady-state, regardless of the infection response). The monocytes were colored based on the different sub-types before and after infection to allow association between the exposed sub-types to the naive sub-types (see also Supplementary Fig. 7 for visualization of the naive and exposed cells relative to the contours and the differentially expressed genes which defines each sub-type)
Fig. 3
Fig. 3
scRNA-seq based dynamic deconvolution to infer cell-type composition and infection-induced states. a Illustration of the dynamic deconvolution approach: transformation of the scRNA-seq data into two properties that can be inferred from bulk measurements - immune cell-type composition and infection-induced cell state. Cell-type composition is represented as a one-dimensional vector, where kj is the number of cells from a specific cell type j. The infection-induced cell state (Sj) is represented as the induction of cell-type specific genes following infection. Using our deconvolution algorithm (equations at the bottom, see methods) we infer robust estimators for the relative abundance (Kj) and infection-induced state (Sj) of each cell type across individuals from bulk RNA-seq measurements, as illustrated on the right. b and c Reduction of the scRNA-seq data into two sets of genes which represent intrinsic cell-type properties (b) and cell-type specific infection-induced states (c). Cells are ordered by their cell type (color-coded at the bottom) and cell origin (white for naïve and black for exposed cells); see colorbar for expression levels. d Validation of our deconvolution algorithm using FACS experiment. Comparison between the percentages of each cell type as measured by FACS (x-axis) to the relative abundance by our deconvolution (y-axis). There is a high concordance between the deconvolution prediction and the cellular composition as determined by FACS. Each dot is the mean of 3–4 replicates for the FACS and bulk RNA-seq. Presented also are the standard error (SEM) for the replicates. e Validation of the infection-induced signatures in sorted populations. Presented are the expression levels of the intrinsic cell types (from b) and infection-induced marker genes (from c) in bulk measurements of sorted naïve and exposed NKT cells and monocytes. The NKT infection-induced state is upregulated following infection solely in the exposed NKT cells (left). Similarly, the monocytes cell-type signature is expressed exclusively in naïve and exposed monocytes, and the monocytes infection-induced signature is upregulated following infection exclusively in the exposed monocytes (right). Each sample is the mean of 2–4 technical replicates; cell-type signatures are color-coded (n denotes the number of genes in each signature)
Fig. 4
Fig. 4
Dynamic deconvolution of immune cell states reveals differences between WT and TLR10 individuals. a Overview of the bulk RNA-seq experiment: isolated PBMCs from blood of eight healthy individuals: WT (green) and TLR10 (purple), were infected ex vivo with Salmonella and bulk RNA-seq was measured before infection (t = 0), 4 (t = 4), and 8 (t = 8) hours post-infection in triplicates. b Box-plots of the relative abundance or infection-induced state of each cell type before and 4 or 8 h post-infection in WT vs. TLR10 uncover significant difference in NKT infection-induced states following infection. The box represents the median and 25–75th percentile, whiskers encompass all data points. *p-value < 0.05, two sample t-test. Values are inferred from bulk measurements using our deconvolution algorithm; estimators of cell-type index are in arbitrary units (au). c Unique molecular identifier (UMI) counts of IFNγ from each cell by scRNA-seq data revealed production of IFNγ exclusively from NKT cells 4 h post-infection; color-coded cell types are indicated at the bottom. d Gene Set Enrichment Analysis (GSEA) of the ‘monocytes infection-induced genes’ in the genes that are higher in WT relative to TLR10 individuals 8 h post-infection (see methods) reveals partition of the gene signature into two sets which imply differences in sub-types activation following infection. Red to blue bar at the bottom represents the gene expression fold change between WT and TLR10 individuals (see also colorbar to the right); the black bars below indicate positions of the ‘monocytes infection-induced genes’ in the ordered list of genes. p-value is calculated by the maximal Enrichment Score (ES), which also defines the group of enriched genes (all genes to the left of the maximal ES position, i.e. the dashed line). e Expression matrix (scRNA-seq data) of the set of ‘monocytes infection-induced genes’ that were enriched in the genes that are higher in WT relative to TLR10 (genes to the left of the dashed line in d). Presented is the mean expression of these genes from each cell sub-type of the naive and exposed monocytes. The left bar represents the mean expression of these genes in each sub-types; monocytes sub-types color-coded as in Fig. 2b
Fig. 5
Fig. 5
Differences in cell–cell signaling is associated with different bacterial control in WT and TLR10 individuals. a Isolated PBMCs from a WT individual were infected ex vivo with Salmonella in the presence of isotype control or anti-IFNγ neutralizing antibodies. Intracellular bacterial growth was determined by CFU 8 h post-infection. Data are presented as bar chart with the average of three independent experiments with four replicates and SEM, all data points are presented by dots. Blocking IFNγ in WT individual increases bacterial load; statistical significance was determined using Friedman’s test, p-value is indicated. b Intracellular bacteria number was determined by CFU 8 h after ex vivo Salmonella infection of monocytes alone or co-culture of monocytes and NKT cells. Data are presented as bar chart with mean and SEM of eight replicates; data points are presented by dots. Co-culture of monocytes with NKT cells provided better control of intracellular bacterial infection relative to monocytes alone; statistical significance was determined using the unpaired Mann–Whitney U test, p-value is indicated in the figure. c Secreted IFNγ levels from monocytes alone or co-culture of monocytes and NKT cells were measured before and after ex vivo Salmonella infection. Data are presented as bar chart with mean and SEM of eight replicates; data points are presented by dots. Co-culture of monocytes and NKT cells secreted significantly higher levels of IFNγ relative to monocytes alone; statistical significance was determined using the unpaired Mann–Whitney U test, p-value is indicated. d Isolated PBMCs from eight individuals (WT in green and TLR10 in purple) were infected ex vivo with Salmonella. Intracellular bacterial growth was determined by CFU 8 h post-infection. Data are presented as mean and SEM of three replicates. TLR10 individuals exhibit higher bacterial load than WT individuals; statistical significance was determined using the unpaired Mann–Whitney U test, p-value is indicated
Fig. 6
Fig. 6
Dynamic deconvolution of the monocytes infection-induced state captures TB progression. a Algorithm performance evaluation on WB samples. Comparison between the percentages of each cell type measured by FACS (x-axis) to the relative abundance as inferred by our deconvolution algorithm (y-axis) for four individuals. There is a high concordance between the deconvolution prediction and the FACS for all cell type, except for the monocytes. Presented is the mean of 3–4 replicates and SEM. R-squared values are indicated. b Comparison of NKT and monocytes infection-induced states as inferred by our algorithm from matched PBMCs (x-axis) and WB samples (y-axis) from four individuals. Presented is the mean of four replicates and SEM. There is a high concordance between the infection-induced states as measured from matched PBMCs and WB samples. c Box-plot of the monocytes infection-induced state (in arbitrary units- au) of control individuals (blue), LTBI individuals who remained healthy (light gray), LTBI individuals who developed active TB (progressors; dark gray) and active TB patients (red) uncover significant difference between LTBI who remained healthy vs. progressors, before signs of active disease. The box represents the median and 25–75th percentile, whiskers encompass interquartile range. *p-value < 0.05, two sample t-test. d GSEA of the monocytes infection-induced genes in the genes that are expressed higher in progressors relative to LTBI individuals reveal significant enrichment of the entire signature, p-value < 0.0001 (GSEA test). Red to blue bar represents fold change between mean expression of each gene in the progressors relative to LTBI individuals, see methods for more information. e Dynamics of the monocytes infection-induced state during TB progression. Deconvolution of the monocytes infection-induced states of nine progressors at several timepoints from baseline (dark gray, as in c) until diagnosis of active disease (red) reveals maximal monocytes infection-induced state at the sample preceding the diagnosis of active TB. Box-plots of active TB (red) and LTBI who remained healthy (light gray, shown 25–75th percentile of the samples) are as in c, for comparison to the progressors levels. The time before active TB was diagnosis is indicated at the x-axis

References

    1. Arpaia N, et al. TLR signaling is required for Salmonella typhimurium virulence. Cell. 2011;144:675–688. doi: 10.1016/j.cell.2011.01.031. - DOI - PMC - PubMed
    1. Hagar JA, Powell DA, Aachoui Y, Ernst RK, Miao EA. Cytoplasmic LPS activates caspase-11: implications in TLR4-independent endotoxic shock. Science. 2013;341:1250–1253. doi: 10.1126/science.1240988. - DOI - PMC - PubMed
    1. Zanoni I, et al. CD14 controls the LPS-induced endocytosis of Toll-like receptor 4. Cell. 2011;147:868–880. doi: 10.1016/j.cell.2011.09.051. - DOI - PMC - PubMed
    1. Woodward JJ, Iavarone AT, Portnoy DA. c-di-AMP secreted by intracellular Listeria monocytogenes activates a host type I interferon response. Science. 2010;328:1703–1705. doi: 10.1126/science.1189801. - DOI - PMC - PubMed
    1. Lam GY, Cemma M, Muise AM, Higgins DE, Brumell JH. Host and bacterial factors that regulate LC3 recruitment to Listeria monocytogenes during the early stages of macrophage infection. Autophagy. 2013;9:985–995. doi: 10.4161/auto.24406. - DOI - PMC - PubMed

Publication types

MeSH terms