Meta-Analysis
. 2019 Jul 22;9(1):10542.
doi: 10.1038/s41598-019-46896-0.

Extracellular matrix composition of connective tissues: a systematic review and meta-analysis

Affiliations
Meta-Analysis

Extracellular matrix composition of connective tissues: a systematic review and meta-analysis

Turney J McKee et al. Sci Rep. .

Abstract

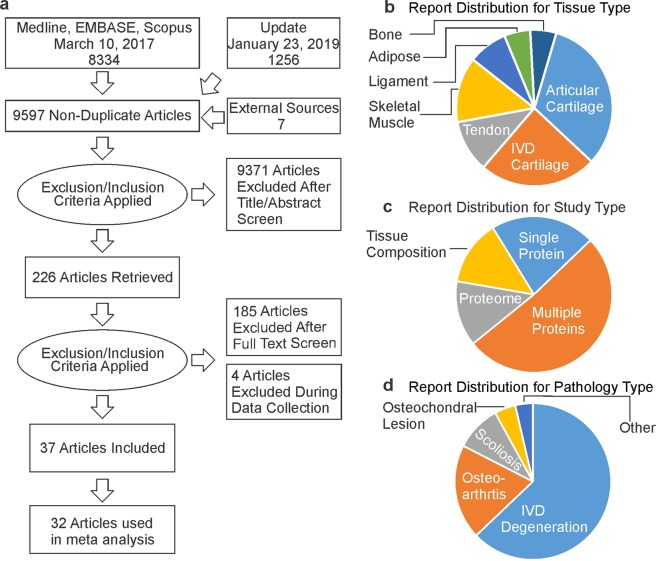
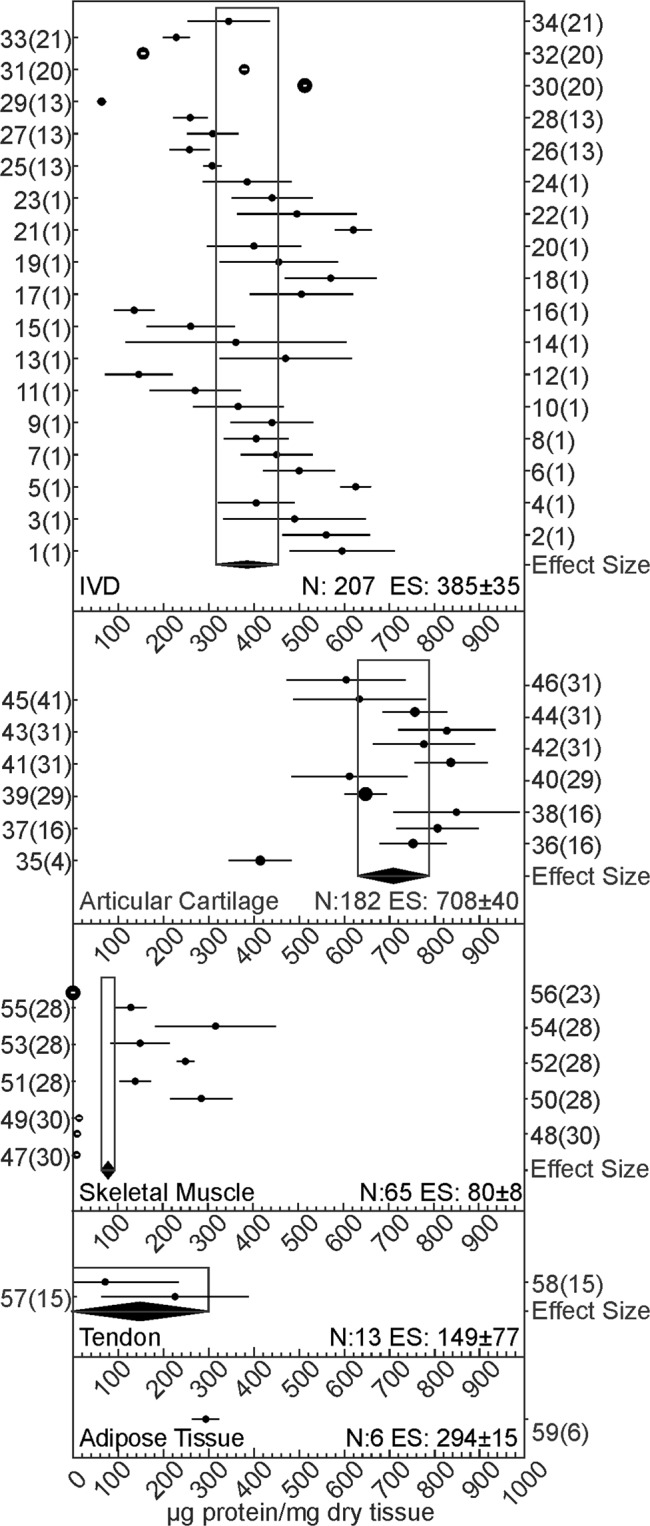
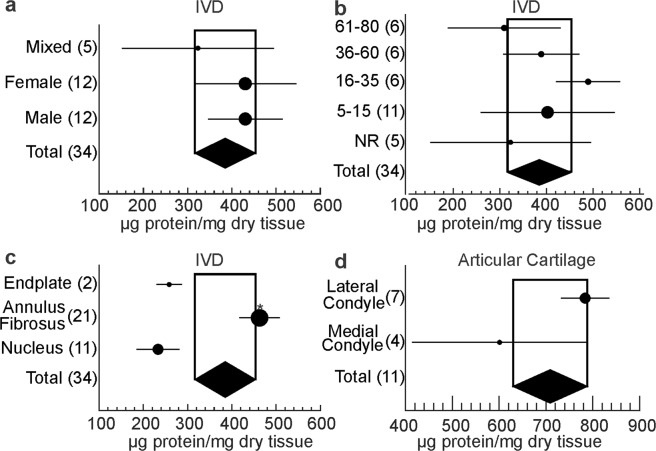
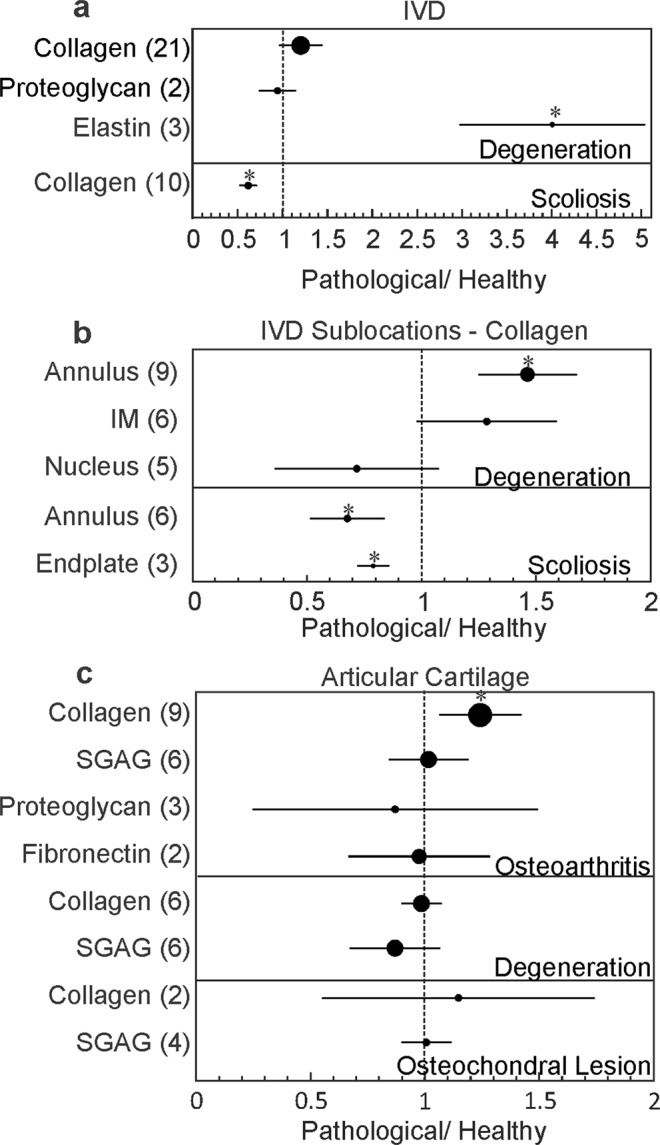
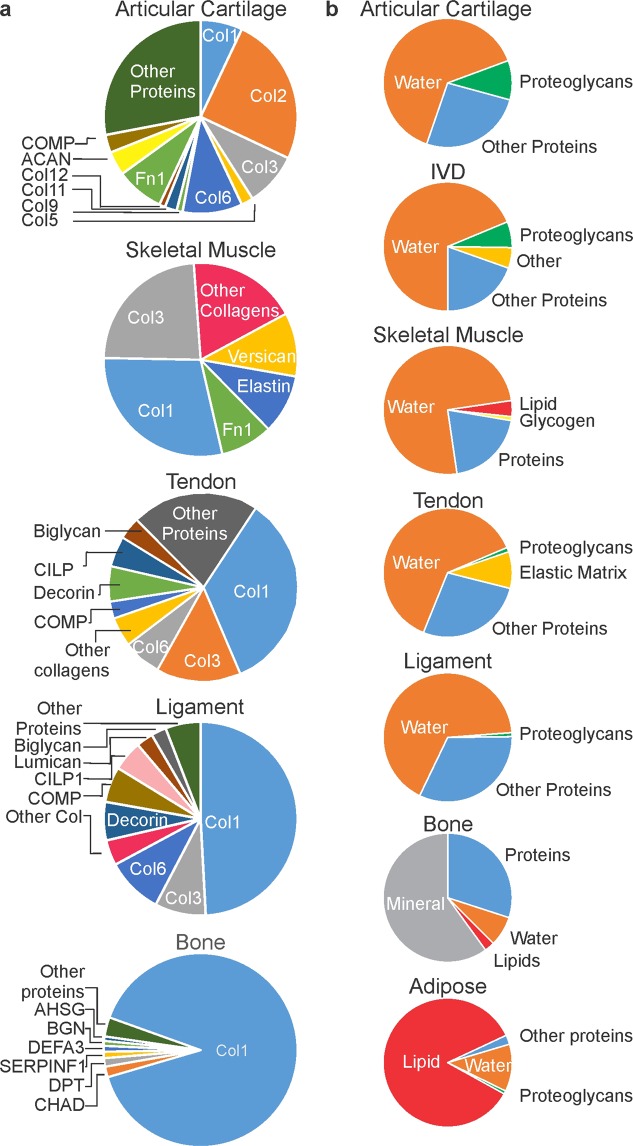
The function of connective tissues depends on the physical and biochemical properties of their extracellular matrix (ECM), which are in turn dictated by ECM protein composition. With the primary objective of obtaining quantitative estimates for absolute and relative amounts of ECM proteins, we performed a systematic review of papers reporting protein composition of human connective tissues. Articles were included in meta-analysis if they contained absolute or relative quantification of proteins found in the ECM of human bone, adipose tissue, tendon, ligament, cartilage and skeletal muscle. We generated absolute quantitative estimates for collagen in articular cartilage, intervertebral disk (IVD), skeletal muscle, tendon, and adipose tissue. In addition, sulfated glycosaminoglycans were quantified in articular cartilage, tendon and skeletal muscle; total proteoglycans in IVD and articular cartilage, fibronectin in tendon, ligament and articular cartilage, and elastin in tendon and IVD cartilage. We identified significant increases in collagen content in the annulus fibrosus of degenerating IVD and osteoarthritic articular cartilage, and in elastin content in degenerating disc. In contrast, collagen content was decreased in the scoliotic IVD. Finally, we built quantitative whole-tissue component breakdowns. Quantitative estimates improve our understanding of composition of human connective tissues, providing insights into their function in physiology and pathology.


Conflict of interest statement

The authors declare no competing interests.

Figures

Figure 1
Figure 1
Search strategy and outcomes. (a) Prisma diagram for the information flow. (b–d) The distribution of information within 32 accepted papers concerning (b) tissue type; (c) the number of components reported within each study; and (d) pathology type.
Figure 2
Figure 2
The data distribution and inter-dataset heterogeneity. (a,b) Funnel plots indicating bias and heterogeneity for collagen estimates in IVD (a) and articular cartilage (b). Blue lines: fixed effect model estimates, red lines: random effects model estimates; black lines: expected 95% confidence interval in the absence of bias/heterogeneity. (c,d) Histograms and normal probability plots for distribution of collagen estimates in IVD (c) and articular cartilage (d). (e,f) Single study (left) and cumulative (right) exclusion analysis for collagen estimates in IVD (e) and articular cartilage (f).
Figure 3
Figure 3
Collagen abundance in connective tissue. Forest plot for the estimated collagen abundance in IVD, articular cartilage, skeletal muscle, tendon, and adipose tissue. Shown are the effect sizes (black dots) with 95% CI (black lines) for each dataset included in the analysis and the overall effect sizes (ES) with 95% CI (black diamonds) for each tissue type. Y-axis labels indicate the included datasets and study numbers in the format dataset(study) according to Supplemental Table 1, where extended information can be found. The size of the circle is proportional to the number of datasets.
Figure 4
Figure 4
Technical contributors to inter-study differences. Forest plots for the estimated effect size of collagen abundance for different quantification methods (a), and original data transformations (b–e). For a, data are presented as a ratio to the overall estimate. For (be), shown are IVD (b,c) and articular cartilage (d,e) subgroup averages and 95% CI as black dots/black lines for different type of transformations (b,d), or adjustment (c,e). The overall effect sizes and 95% CI as black diamonds. The size of the circle is proportional to the number of datasets, *indicates statistical significance.
Figure 5
Figure 5
Estimating the contribution of biological factors to collagen abundance in IVD and articular cartilage. Forest plot for the estimated collagen abundance in IVD (a–c) and articular cartilage (d) as a function of sex (a), age (b), and tissue sub-location (c,d). Shown are subgroup averages and 95% CI as black dots/black lines, the overall effect sizes and 95% CI as black diamond, the number of datasets included within each subgroup is indicated in parenthesis. The size of the circle is proportional to the number of datasets; *indicates statistical significance.
Figure 6
Figure 6
Forest plot for the estimated effect of pathologies on the abundance of ECM components. (a,b) Effect of IVD degeneration and scoliosis on abundance of collagen, proteoglycans and elastin in IVD (a) and collagen content in IVD sub-locations (b). (c) Effect of osteoarthritis, cartilage degeneration and osteochondral lesion on abundance of collagen, sGAG, proteoglycans and fibronectin in articular cartilage. Shown are the estimated effect sizes (black circles) and 95% CI (black lines) for the abundance of indicated components in pathological tissues relative to healthy estimates (1 indicates equal amounts, dashed vertical line); the number of datasets included within each group is indicated in parenthesis. The size of the circle is proportional to the number of datasets, *indicates statistical significance.
Figure 7
Figure 7
Comparative proteomic and overall composition of different connective tissues. (a) Relative abundance of ECM proteins derived from studies that investigated the large numbers of proteins or complete proteomes in articular cartilage, skeletal muscle, tendon, ligament, and bone. For articular cartilage, skeletal muscle, ligament, and bone the data are from a single study; for tendon, relative abundance of top 10 proteins identified by both studies was averaged. (b) Relative quantity of whole tissue constituents in articular cartilage, skeletal muscle, ligament, tendon, bone, adipose tissue, and IVD.

References

    1. Alberts, B. Molecular biology of the cell. Garland Science (2015).
    1. Plotnikov SV, Pasapera AM, Sabass B, Waterman CM. Force fluctuations within focal adhesions mediate ECM-rigidity sensing to guide directed cell migration. Cell. 2012;151(7):1513–27. doi: 10.1016/j.cell.2012.11.034. - DOI - PMC - PubMed
    1. Engler AJ, Sen S, Sweeney HL, Discher DE. Matrix elasticity directs stem cell lineage specification. Cell. 2006;126(4):677–89. doi: 10.1016/j.cell.2006.06.044. - DOI - PubMed
    1. Lo CM, Wang HB, Dembo M, Wang YL. Cell movement is guided by the rigidity of the substrate. Biophys. J. 2000;79(1):144–52. doi: 10.1016/S0006-3495(00)76279-5. - DOI - PMC - PubMed
    1. Hadjipanayi E, Mudera V, Brown RA. Close dependence of fibroblast proliferation on collagen scaffold matrix stiffness. J. Tissue Eng. Regen. Med. 2009;3(2):77–84. doi: 10.1002/term.136. - DOI - PubMed

Publication types

MeSH terms