. 2019 Jul 22;9(1):10596.
doi: 10.1038/s41598-019-46664-0.

Virus Genotype-Dependent Transcriptional Alterations in Lipid Metabolism and Inflammation Pathways in the Hepatitis C Virus-infected Liver

Affiliations

Virus Genotype-Dependent Transcriptional Alterations in Lipid Metabolism and Inflammation Pathways in the Hepatitis C Virus-infected Liver

W M H d'Avigdor et al. Sci Rep. .

Abstract

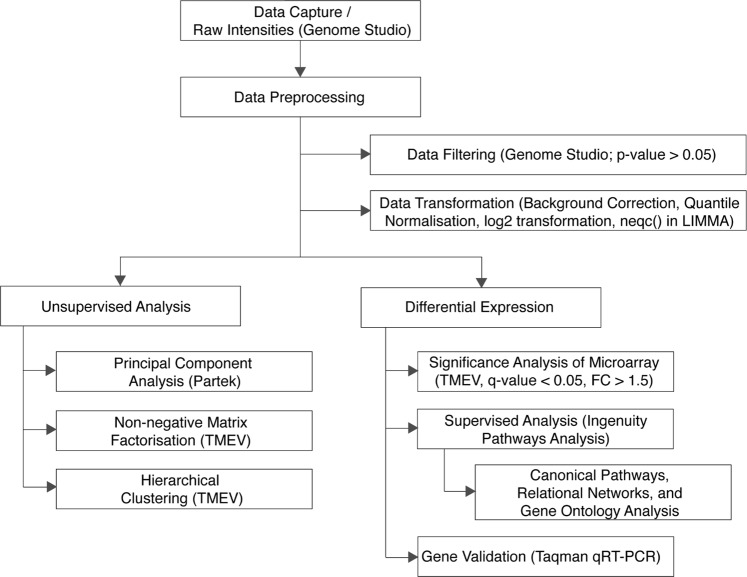
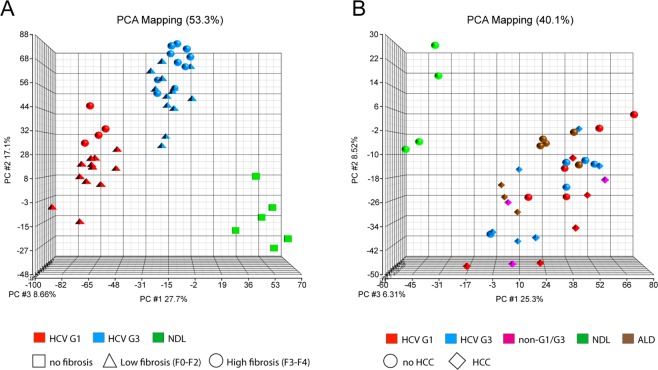
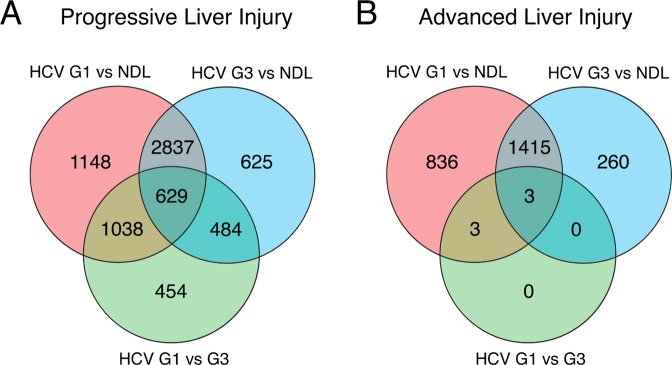
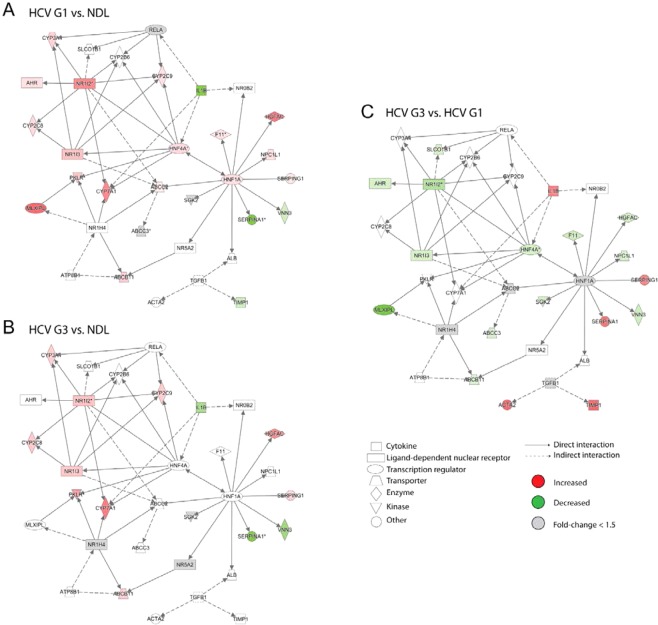
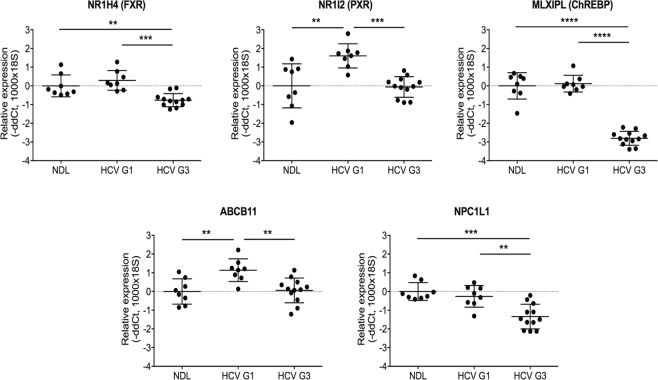
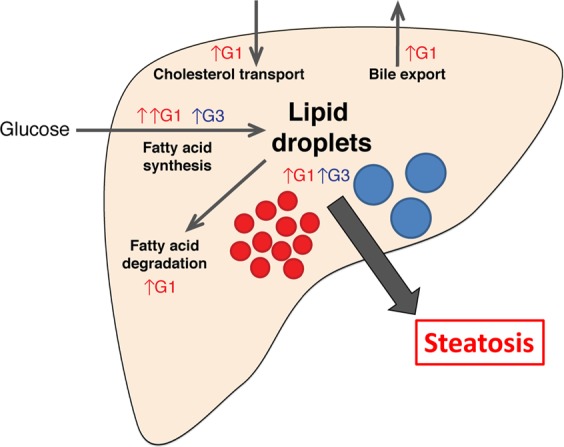
Despite advances in antiviral therapy, molecular drivers of Hepatitis C Virus (HCV)-related liver disease remain poorly characterised. Chronic infection with HCV genotypes (1 and 3) differ in presentation of liver steatosis and virological response to therapies, both to interferon and direct acting antivirals. To understand what drives these clinically important differences, liver expression profiles of patients with HCV Genotype 1 or 3 infection (n = 26 and 33), alcoholic liver disease (n = 8), and no liver disease (n = 10) were analysed using transcriptome-wide microarrays. In progressive liver disease, HCV genotype was the major contributor to altered liver gene expression with 2151 genes differentially expressed >1.5-fold between HCV Genotype 1 and 3. In contrast, only 6 genes were altered between the HCV genotypes in advanced liver disease. Induction of lipogenic, lipolytic, and interferon stimulated gene pathways were enriched in Genotype 1 injury whilst a broad range of immune-associated pathways were associated with Genotype 3 injury. The results are consistent with greater lipid turnover in HCV Genotype 1 patients. Moreover, the lower activity in inflammatory pathways associated with HCV genotype 1 is consistent with relative resistance to interferon-based therapy. This data provides a molecular framework to explain the clinical manifestations of HCV-associated liver disease.


Conflict of interest statement

The authors declare no competing interests.

Figures

Figure 1
Figure 1
Microarray analysis workflow. Workflow outlining the microarray analysis workflow including data processing and downstream analysis.
Figure 2
Figure 2
Principal Component Analysis of the whole liver gene expression profiles of HCV-induced progressive liver injury (A) and advanced liver injury (B). Based on the first three principal components, three major clusters are apparent in progressive liver injury: patients infected with HCV genotype 1 (red), genotype 3 (blue) and non-diseased liver (green). Secondary clustering based on low fibrosis (F0–F2; triangles) and high fibrosis (F3–F4, circles) was also observed. In advanced HCV liver injury, only clustering based on general liver injury (but not on HCV genotype) was observed.
Figure 3
Figure 3
Comparative differential gene expression between non-diseased livers (NDL) and livers from patients infected with HCV genotype 1 (HCV G1) or genotype 3 (HCV G3). Venn diagrams show the overlap of differentially expressed liver genes in HCV-induced progressive (A) and advanced (B) liver injury.
Figure 4
Figure 4
Differentially expressed genes in the ‘Lipid Metabolism, Molecular Transport, Small Molecule Biochemistry’ pathway. Expression data overlayed onto these networks was visualised for differentially expressed genes between HCV genotype 1 (HCV G1) compared to non-diseased liver (NDL) (A); HCV genotype 3 (HCV G3) compared to NDL (B); and HCV G1 compared to HCV G3 (C). Node colours corresponds to fold changes of differentially expressed genes (red = up-regulated; green = down-regulated; grey = genes not meeting the significance threshold of −1.5< fold change <1.5).
Figure 5
Figure 5
Validation of the observed differentially expressed genes in HCV genotype 1- and 3-infected liver tissues. Taqman qRT-PCR validation of selected genes in lipid metabolism pathway analysis of progressive HCV-induced liver disease, comparing non-diseased liver (NDL, n = 8) and livers infected with HCV genotype 1 (HCV G1, n = 8) or genotype 3 (HCV G3, n = 12). Mann-Whitney U-test; **p < 0.01, ***p < 0.001, ****p < 0.0001.
Figure 6
Figure 6
Summary of HCV genotype-specific lipid pathways. Gene expression analysis suggests that HCV G1 induces increased fatty acid degradation, bile acid transport, drug metabolism, and decreased cholesterol export, while these pathways are less altered in the HCV G3-infected liver. Activation of large numbers of lipid metabolism (both synthesis and degradation) genes may drive the continual turnover of lipid droplets in HCV G1 infection. In contrast, HCV G3 may simply induce an increase in size of existing lipid droplets. Though different in clinical presentation, both result in extensive intrahepatic steatosis.

References

    1. Gower E, Estes C, Blach S, Razavi-Shearer K, Razavi H. Global epidemiology and genotype distribution of the hepatitis C virus infection. J Hepatol. 2014;61:S45–57. doi: 10.1016/j.jhep.2014.07.027. - DOI - PubMed
    1. Tu T, Buhler S, Bartenschlager R. Chronic viral hepatitis and its association with liver cancer. Biol Chem. 2017;398:817–837. doi: 10.1515/hsz-2017-0118. - DOI - PubMed
    1. Sievert W, et al. A systematic review of hepatitis C virus epidemiology in Asia, Australia and Egypt. Liver Int. 2011;31(Suppl 2):61–80. doi: 10.1111/j.1478-3231.2011.02540.x. - DOI - PubMed
    1. Rubbia-Brandt L, et al. Hepatocyte steatosis is a cytopathic effect of hepatitis C virus genotype 3. J Hepatol. 2000;33:106–115. doi: 10.1016/S0168-8278(00)80166-X. - DOI - PubMed
    1. Adinolfi LE, et al. Steatosis accelerates the progression of liver damage of chronic hepatitis C patients and correlates with specific HCV genotype and visceral obesity. Hepatology. 2001;33:1358–1364. doi: 10.1053/jhep.2001.24432. - DOI - PubMed

Publication types