. 2019 Nov;4(11):1895-1906.
doi: 10.1038/s41564-019-0510-x. Epub 2019 Jul 22.

Cryptic inoviruses revealed as pervasive in bacteria and archaea across Earth's biomes

Affiliations

Cryptic inoviruses revealed as pervasive in bacteria and archaea across Earth's biomes

Simon Roux et al. Nat Microbiol. 2019 Nov.

Erratum in

Abstract

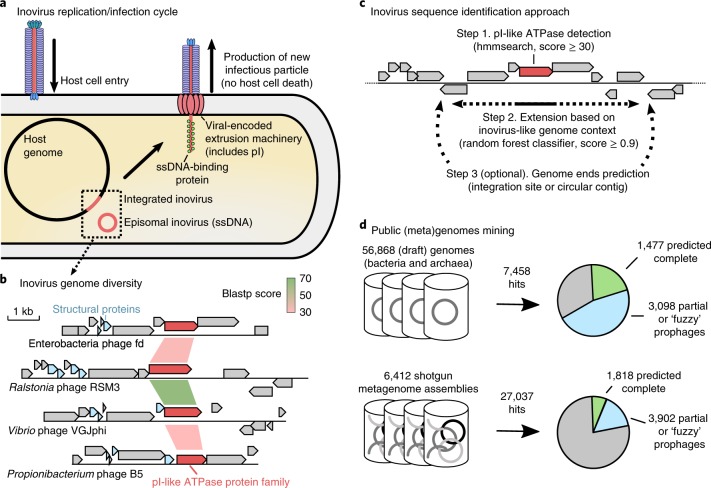
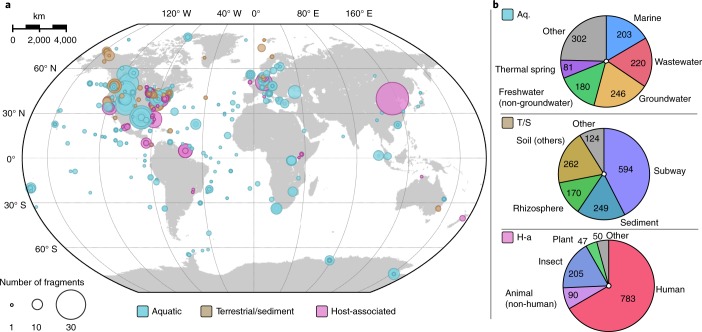
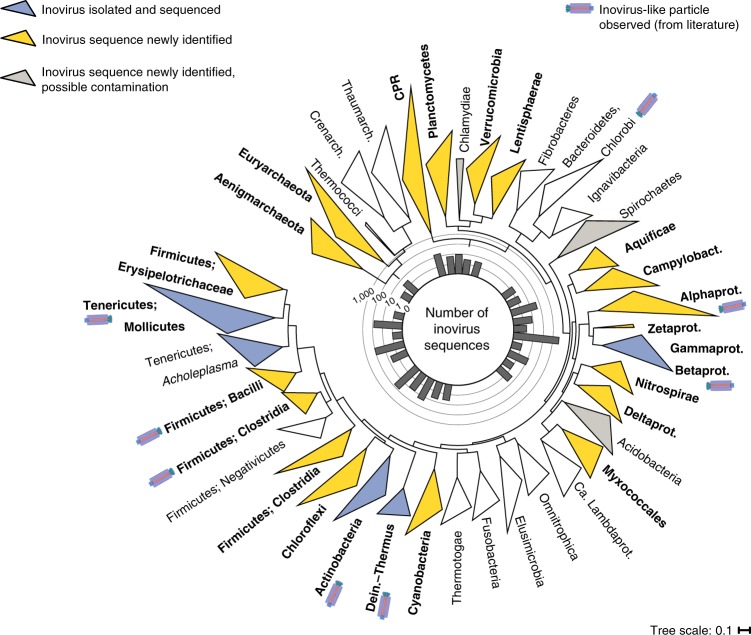
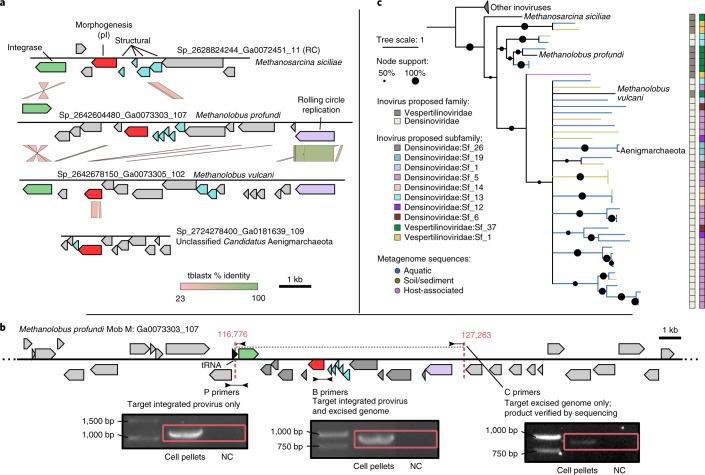
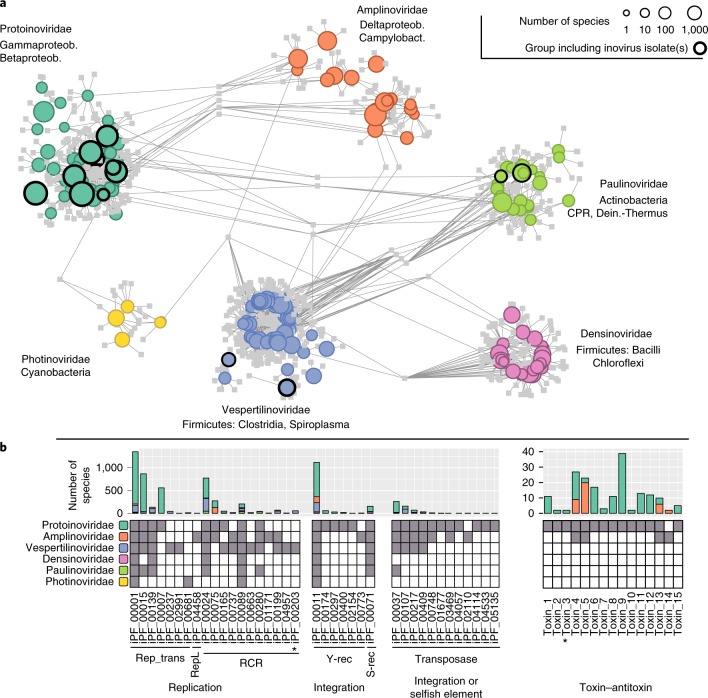
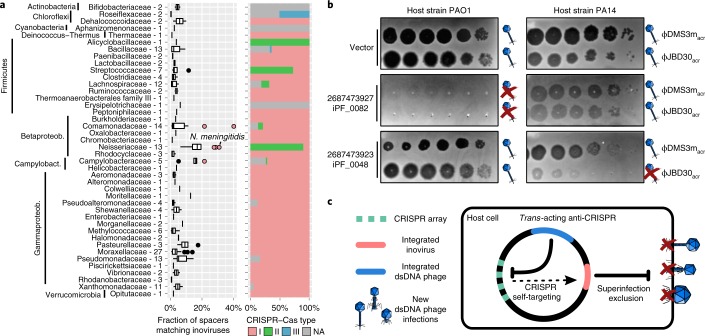
Bacteriophages from the Inoviridae family (inoviruses) are characterized by their unique morphology, genome content and infection cycle. One of the most striking features of inoviruses is their ability to establish a chronic infection whereby the viral genome resides within the cell in either an exclusively episomal state or integrated into the host chromosome and virions are continuously released without killing the host. To date, a relatively small number of inovirus isolates have been extensively studied, either for biotechnological applications, such as phage display, or because of their effect on the toxicity of known bacterial pathogens including Vibrio cholerae and Neisseria meningitidis. Here, we show that the current 56 members of the Inoviridae family represent a minute fraction of a highly diverse group of inoviruses. Using a machine learning approach leveraging a combination of marker gene and genome features, we identified 10,295 inovirus-like sequences from microbial genomes and metagenomes. Collectively, our results call for reclassification of the current Inoviridae family into a viral order including six distinct proposed families associated with nearly all bacterial phyla across virtually every ecosystem. Putative inoviruses were also detected in several archaeal genomes, suggesting that, collectively, members of this supergroup infect hosts across the domains Bacteria and Archaea. Finally, we identified an expansive diversity of inovirus-encoded toxin-antitoxin and gene expression modulation systems, alongside evidence of both synergistic (CRISPR evasion) and antagonistic (superinfection exclusion) interactions with co-infecting viruses, which we experimentally validated in a Pseudomonas model. Capturing this previously obscured component of the global virosphere may spark new avenues for microbial manipulation approaches and innovative biotechnological applications.


Conflict of interest statement

The authors declare no competing interests.

Figures

Fig. 1
Fig. 1. Overview of inovirus infection cycle, diversity and sequence detection process.
a, Schematic of the inovirus persistent infection cycle and virion production. Inovirus genomes and particles are not to scale relative to the host cell and genome. ssDNA, single-stranded DNA. b, Comparison of selected inovirus genomes from isolates. The pI-like genes (the most conserved genes) are coloured in red, and sequence similarity between these genes (based on blastp) is indicated with coloured links between genomes. Putative structural proteins that can be identified based on characteristic features (gene length and presence of a TMD) are coloured in blue. Other genes are coloured in grey. c, Representation of the custom inovirus detection approach. The pI-like ATPase gene is coloured in red and other genes are coloured in grey. Dotted arrows indicate the region around pI-like genes that were searched for signs of an inovirus-like genome context and attachment site (see Supplementary Notes). d, Results of the search for inovirus sequences in prokaryote genomes and assembled metagenomes, after exclusion of putative false positives through manual inspection of predicted pI proteins (see Supplementary Notes). Predictions for which genome ends could be identified are indicated in green, while predictions without clear ends (that is, partial genomes or ‘fuzzy’ prophages with no predicted att site) are in blue, adding up to 10,295 curated predictions in total. Sequences for which no inovirus genome could be predicted around the initial pI-like gene are in grey. See also Supplementary Figs. 1–3.
Fig. 2
Fig. 2. Geographical and biome distribution of inovirus sequences detected in metagenomes.
a, Repartition of samples for which one or more inovirus sequence(s) was detected. Each sample is represented by a circle proportional to the number of inovirus detections and coloured according to their ecosystem type. b, Breakdown of the number of inovirus detections by ecosystem subtype for each major ecosystem. A more detailed ecosystem distribution of each proposed inovirus family is presented in Supplementary Fig. 7. Aq., aquatic; H-a, host-associated; T/S, terrestrial/sediment.
Fig. 3
Fig. 3. Phylum-wide distribution of inovirus detections across microbial genomes.
The bacteria and archaea phylogenetic trees were computed based on 56 universal marker proteins. Monophyletic clades representing a single phylum (or class for proteobacteria) were collapsed when possible, and only clades including ≥30 genomes or associated with an inovirus(es) are displayed. Clades for which one or more inovirus has been isolated and sequenced are coloured in blue, and clades that have not been previously associated with inovirus sequences are coloured in yellow. Clades for which inovirus-like particles had been reported and/or induced are indicated with a filamentous particle symbol. Putative host clades for which inovirus detection might result from sample contamination, that is, no clear host linkage based on an integrated prophage(s) or CRISPR spacer hit(s), are coloured in grey (Supplementary Table 4). Clades robustly associated with inoviruses in this study (that is, one or more detection unlikely to result from sample contamination) are highlighted in bold. The histogram at the centre indicates the total number of inovirus for each clade, on a log10 scale. Alphaprot., Alphaproteobacteria; Betaprot., Betaproteobacteria; Ca. Lambdaprot.; ‘Candidatus Lambdaproteobacteria’; Campylobact., Campylobacterota; CPR, Candidate Phyla Radiation; Creanarch., Crenarchaeota; Dein.–Thermus, Deinococcus–Thermus; Deltaprot., Deltaproteobacteria; Gammaprot., Gammaproteobacteria; Thaumarch., Thaumarchaeota; Zetaprot., Zetaproteobacteria. See also Supplementary Figs. 4 and 5.
Fig. 4
Fig. 4. Characterization of archaea-associated inoviruses.
a, Genome comparison of the four inovirus sequences detected in members of the Methanosarcinaceae family or Aenigmarchaeota candidate phylum. Genes are coloured according to their functional affiliation (light grey indicates ORFan). RC, sequence is reverse complemented. b, PCR validation of the predicted inovirus from the archaea host M.profundi MobM. Three primer pairs were designed and used to amplify across the predicted 5′ insertion site (P primers), within the predicted provirus (B primers) or across the junction of the predicted excised circular genome (C primers). The predicted provirus attachment site is indicated by dotted red lines along with corresponding genome coordinates. Products from C primers were sequenced and aligned to the M.profundi MobM genome to confirm that they spanned both ends of the provirus in the expected orientation and at the predicted coordinates (see Supplementary Notes and Supplementary Fig. 6). Red boxes indicate the expected product lengths. P and B primer amplifications were repeated twice, and the C primer amplifications were repeated three times, with an identical result obtained for each replicate (Supplementary Fig. 11). NC, no template control. c, Phylogenetic tree of archaea-associated inoviruses and related sequences. The tree was built from pI protein multiple alignment with IQ-TREE. Nodes with support of <50% were collapsed. Branches leading to inovirus species associated to a host are coloured in black, and the corresponding host is indicated on the tree. Branches leading to inovirus species assembled from metagenomes are coloured by type of environment. Classification of each inovirus species in proposed families and subfamilies is indicated next to the tree (see Fig. 5).
Fig. 5
Fig. 5. Inovirus genome sequence space and gene content.
a, The bipartite network links genes represented as PCs in squares to proposed subfamilies represented as circles with a size proportional to the number of species in each candidate subfamily (log10 scale), grouped and coloured by proposed family. Proposed subfamilies that include viral isolates are highlighted with a black outline. Candidate subfamilies are connected to PCs when ≥50% of the subfamily members contained this PC or ≥25% for the larger proposed subfamilies (see Methods). b, Distribution of iPFs detected in two or more genomes, associated with genome replication, genome integration and toxin–antitoxin systems (see Supplementary Table 5). The presence of at least one sequence from an iPF (column) in a proposed family (row) is indicated with a grey square. Rolling circle replication (RCR) iPFs include only the RCR endonuclease motif, with the exception of iPF_00203 (highlighted with an asterisk), which also includes the C-terminal S3H motif typical of eukaryotic single-stranded DNA viruses. Transposases used by selfish integrated elements are indistinguishable from transposases domesticated by viral genomes using sequence analysis only; hence, these genes are gathered in a single ‘integration or selfish element’ category. All toxin–antitoxin pairs were predicted to be of type II, except for Toxin_3 (highlighted with an asterisk), which was predicted to be type IV. S-rec, serine recombinase; Y-rec, tyrosine recombinase. See also Supplementary Figs. 7–9.
Fig. 6
Fig. 6. Interaction of inoviruses with CRISPR–Cas systems and co-infecting viruses.
a, Proportion of the spacers matching an inovirus genome and the corresponding distribution of CRISPR–Cas systems. The proportions are calculated only on hosts with at least one spacer matching an inovirus sequence, with hosts grouped at the family rank (hosts unclassified at this rank were not included). In the boxplot, the lower and upper hinges correspond to the first and third quartiles, respectively, and the whiskers extend no further than ±1.5 times the interquartile range. Outliers identified as values larger than the third quartile plus three times the interquartile range from the complete distribution are highlighted in red. The number of observations is indicated next to each family. b, Instances of superinfection exclusion observed when expressing individual inovirus genes in two P.aeruginosa strains: PAO1 and PA14. From top to bottom: cells were transformed with an empty vector, one expressing gene 2687473927 or one expressing gene 2687473923. For each construct, host cells were challenged with serial dilutions (from left to right) of phages: ϕJBD30 and ϕDMS3m. The formation of plaques (dark circles) indicates successful infection, whereas the absence of plaques indicates superinfection exclusion. Interpretation of infection outcome is indicated to the right of each lane, with successful infection represented by a phage symbol and superinfection exclusion represented by a phage symbol barred by a red cross. Results from additional superinfection exclusion experiments are presented in Supplementary Figs. 10 and 12. All superinfection experiments were conducted twice and produced similar results. c, Schematic representation of the possible mutualistic or antagonistic interactions between inovirus prophages (red) and co-infecting Caudovirales (blue). Mutualistic interactions include suppression of the CRISPR–Cas immunity, especially for integrated inoviruses targeted by the host cell CRISPR–Cas system (‘self-targeting’). Antagonistic interactions primarily involve superinfection exclusion, in which a chronic inovirus infection prevents a secondary infection by an unrelated virus.

References

    1. Rakonjac J, Bennett NJ, Spagnuolo J, Gagic D, Russel M. Filamentous bacteriophage: biology, phage display and nanotechnology applications. Curr. Issues Mol. Biol. 2011;13:51–76. - PubMed
    1. Fauquet CM. The diversity of single stranded DNA. Virus Biodivers. 2006;7:38–44. doi: 10.1080/14888386.2006.9712793. - DOI
    1. Marvin DA, Symmons MF, Straus SK. Structure and assembly of filamentous bacteriophages. Prog. Biophys. Mol. Biol. 2014;114:80–122. doi: 10.1016/j.pbiomolbio.2014.02.003. - DOI - PubMed
    1. Bradbury ARM, Marks JD. Antibodies from phage antibody libraries. J. Immunol. Methods. 2004;290:29–49. doi: 10.1016/j.jim.2004.04.007. - DOI - PubMed
    1. Nam KT, et al. Stamped microbattery electrodes based on self-assembled M13 viruses. Proc. Natl Acad. Sci. USA. 2008;105:17227–17231. doi: 10.1073/pnas.0711620105. - DOI - PMC - PubMed

Publication types