. 2019 Aug;25(8):1205-1212.
doi: 10.1038/s41591-019-0525-0. Epub 2019 Jul 22.

Mapping exclusive breastfeeding in Africa between 2000 and 2017

Affiliations

Mapping exclusive breastfeeding in Africa between 2000 and 2017

Natalia V Bhattacharjee et al. Nat Med. 2019 Aug.

Erratum in

  • Publisher Correction: Mapping exclusive breastfeeding in Africa between 2000 and 2017.
    Bhattacharjee NV, Schaeffer LE, Marczak LB, Ross JM, Swartz SJ, Albright J, Gardner WM, Shields C, Sligar A, Schipp MF, Pickering BV, Henry NJ, Johnson KB, Louie C, Cork MA, Steuben KM, Lazzar-Atwood A, Lu D, Kinyoki DK, Osgood-Zimmerman A, Earl L, Mosser JF, Deshpande A, Burstein R, Woyczynski LP, Wilson KF, VanderHeide JD, Wiens KE, Reiner RC Jr, Piwoz EG, Rawat R, Sartorius B, Weaver ND, Nixon MR, Smith DL, Kassebaum NJ, Gakidou E, Lim SS, Mokdad AH, Murray CJL, Dwyer-Lindgren L, Hay SI. Bhattacharjee NV, et al. Nat Med. 2019 Sep;25(9):1458. doi: 10.1038/s41591-019-0577-1. Nat Med. 2019. PMID: 31455921 Free PMC article.

Abstract

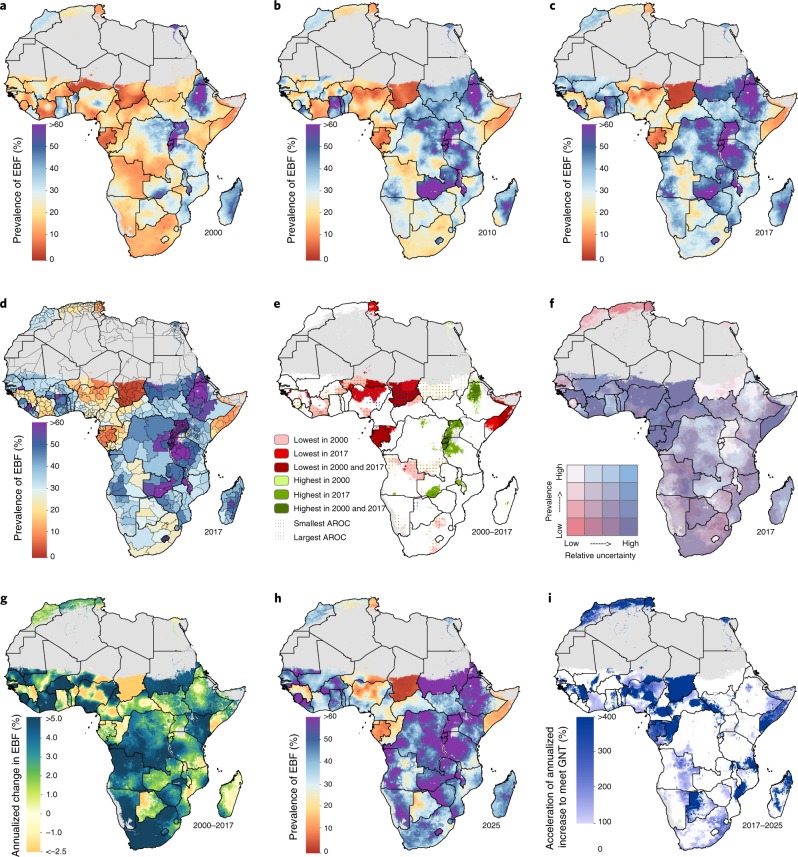
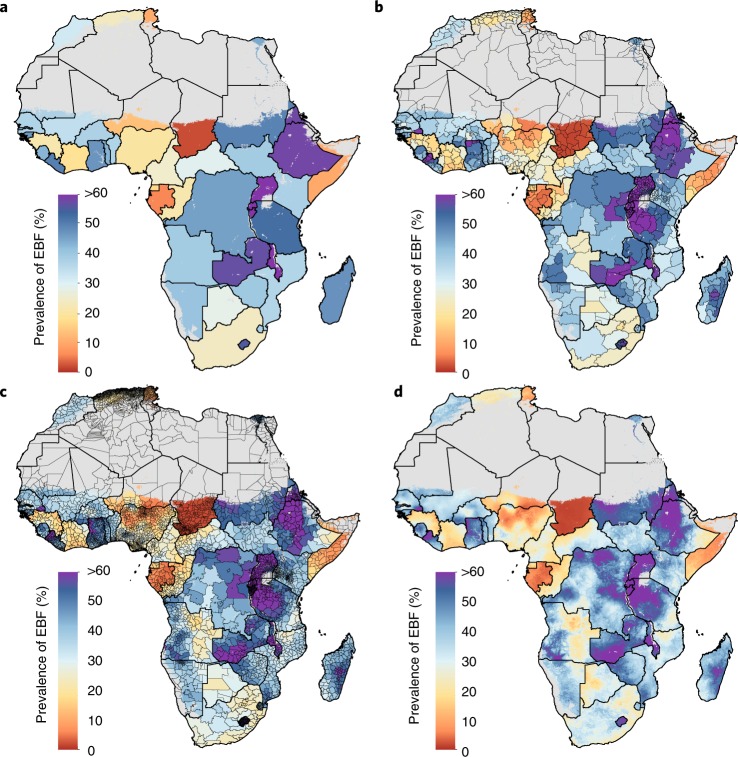
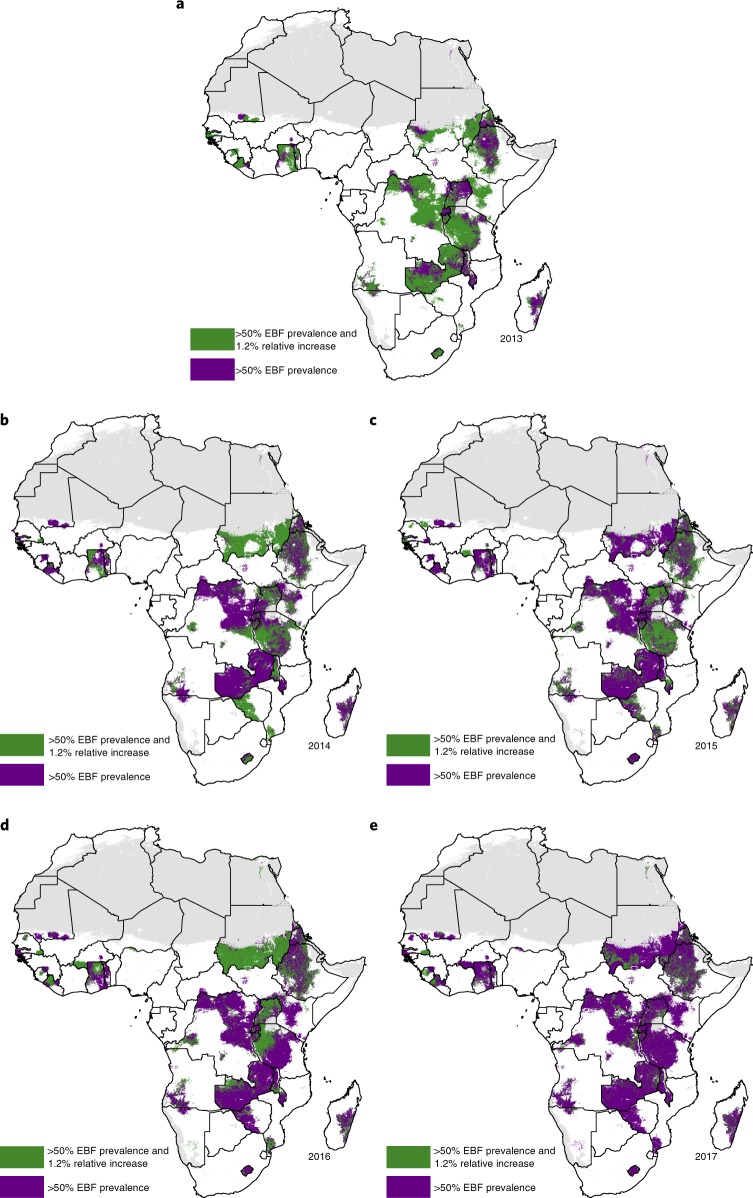
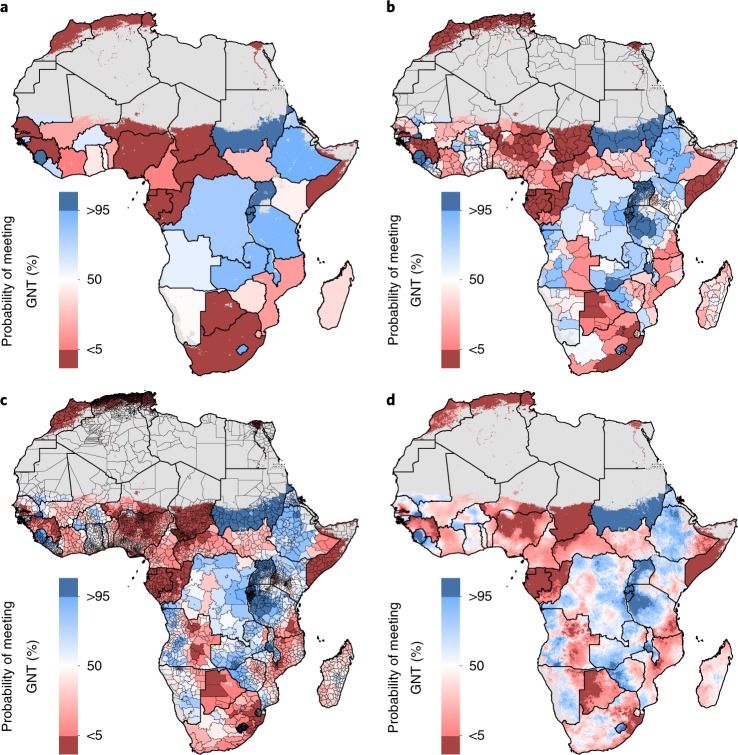
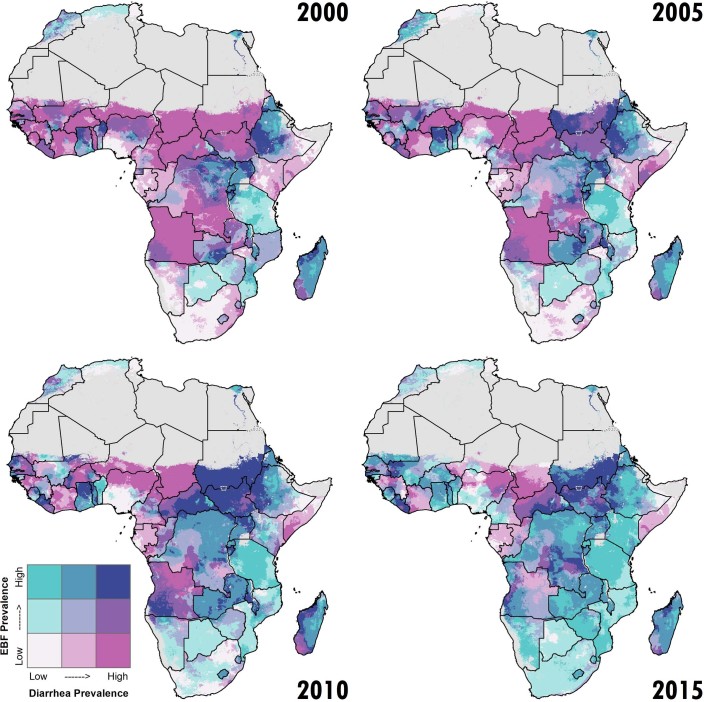
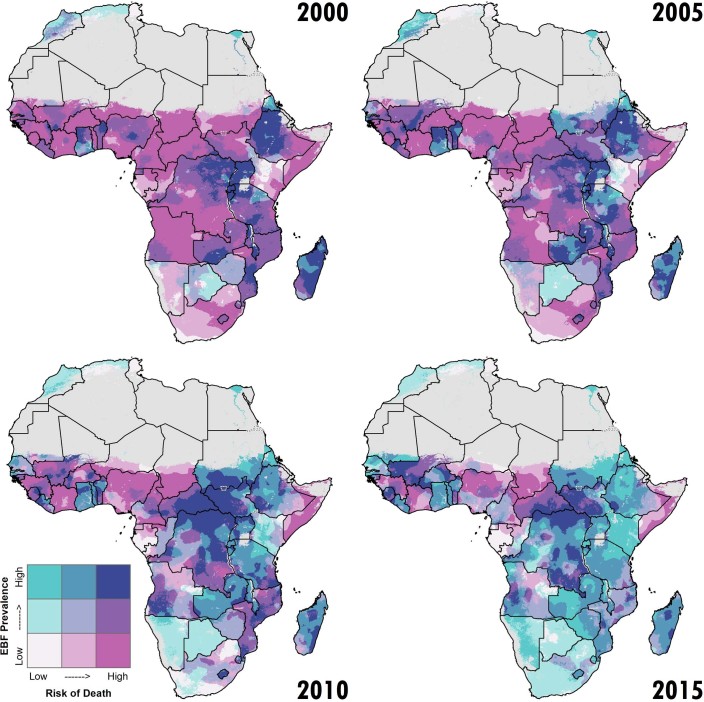
Exclusive breastfeeding (EBF)-giving infants only breast-milk (and medications, oral rehydration salts and vitamins as needed) with no additional food or drink for their first six months of life-is one of the most effective strategies for preventing child mortality1-4. Despite these advantages, only 37% of infants under 6 months of age in Africa were exclusively breastfed in 20175, and the practice of EBF varies by population. Here, we present a fine-scale geospatial analysis of EBF prevalence and trends in 49 African countries from 2000-2017, providing policy-relevant administrative- and national-level estimates. Previous national-level analyses found that most countries will not meet the World Health Organization's Global Nutrition Target of 50% EBF prevalence by 20256. Our analyses show that even fewer will achieve this ambition in all subnational areas. Our estimates provide the ability to visualize subnational EBF variability and identify populations in need of additional breastfeeding support.


Conflict of interest statement

This study was funded by the Bill & Melinda Gates Foundation. Co-authors employed by the Bill & Melinda Gates Foundation provided feedback on initial maps and drafts of this manuscript. Otherwise, the funders had no role in study design, data collection, data analysis, data interpretation, writing of the final report, or decision to publish. The corresponding author had full access to all of the data in the study, and had final responsibility for the decision to submit for publication.

Figures

Fig. 1
Fig. 1. EBF prevalence (2000–2017) among infants under 6 months and progress towards the 2025 WHO GNT.
ac, Prevalence of EBF practices at the 5 km × 5 km resolution in 2000 (a), 2010 (b) and 2017 (c). d, Prevalence of EBF at the first administrative subdivision in 2017. e, Overlapping population-weighted lowest and highest 10% of grid cells and weighted AROC in EBF from 2000–2017. f, Overlapping population-weighted quartiles of EBF and relative 95% uncertainty in 2017. Cut-offs for the quartiles were 25.0% (25th percentile), 38.5% (50th percentile) and 52.3% (75th percentile) for the EBF prevalence axis, and 0.500 (25th percentile), 0.902 (50th percentile) and 0.137 (75th percentile) for the relative uncertainty axis (calculated as the absolute range of the uncertainty intervals divided by the estimate). g, Weighted annualized percentage change in EBF prevalence from 2000–2017. h, Grid cell level prevalence of EBF predicted for 2025, projected from 2017 based on AROC between 2000 and 2017. i, Acceleration in the annualized increase in EBF required to meet WHO GNT by 2025. Dark blue pixels were either non-increasing or must accelerate their rate of increase by more than 400% above 2000–2017 rates during 2017–2025 to achieve the target. White pixels require no increase to meet WHO GNT by 2025. Maps reflect administrative boundaries, land cover, lakes and population; gray-colored grid cells had fewer than ten people per 1 km × 1 km grid cell and were classified as ‘barren or sparsely vegetated’, or were not included in this analysis.
Fig. 2
Fig. 2. EBF prevalence in 2017 among infants under 6 months at different levels of spatial resolution.
ad, Prevalence of EBF in 2017 at the national (a), first administrative subdivision (b), second administrative subdivision (c) and 5 km × 5 km grid cell level (d). Maps reflect administrative boundaries, land cover, lakes and population; gray-colored grid cells had fewer than ten people per 1 km × 1 km grid cell and were classified as ‘barren or sparsely vegetated’, or were not included in this analysis.
Fig. 3
Fig. 3. Progress towards WHO GNT 2025 during 2013–2017.
ae, Results are shown for 2013 (a), 2014 (b), 2015 (c), 2016 (d) and 2017 (e). Areas in purple highlight places that met WHO GNT by achieving at least 50% EBF prevalence. Areas in green highlight locations that achieved a 1.2% annual relative increase in addition to meeting WHO GNT of at least 50% EBF prevalence. Maps reflect administrative boundaries, land cover, lakes and population; gray-colored grid cells had fewer than ten people per 1 km × 1 km grid cell and were classified as ‘barren or sparsely vegetated’, or were not included in this analysis.
Fig. 4
Fig. 4. Probability of meeting WHO GNT for EBF by 2025 at different levels of spatial resolution.
ad, Probability of meeting WHO GNT of at least 50% EBF prevalence by 2025 at the national (a), first administrative subdivision (b), second administrative subdivision (c) and 5 km × 5 km grid cell level (d). Maps reflect administrative boundaries, land cover, lakes and population; gray-colored grid cells had fewer than ten people per 1 km × 1 km grid cell and were classified as ‘barren or sparsely vegetated’, or were not included in this analysis.
Extended Data Fig. 1
Extended Data Fig. 1. Comparison of diarrhea prevalence in children under 5 years and EBF prevalence by area.
Overlapping population-weighted tertiles of diarrhea prevalence (in children under 5 years) and EBF prevalence (in children 0–5 months) in 2000, 2005, 2010 and 2015. Cut-offs for the tertiles were 20.8 and 36.1% for the EBF prevalence axis, and 3.6 and 5.0% for the diarrhea prevalence axis. Maps reflect administrative boundaries, land cover, lakes and population; gray-colored grid cells had fewer than ten people per 1 km × 1 km grid cell and were classified as ‘barren or sparsely vegetated’, or were not included in this analysis.
Extended Data Fig. 2
Extended Data Fig. 2. Comparison of risk of death (age 0–11 months) and EBF prevalence by area.
Overlapping population-weighted tertiles of mortality risk (in children 0–11 months) and EBF prevalence (in children 0–5 months) in 2000, 2005, 2010 and 2015. Cut-offs for the tertiles were 20.8 and 36.1% for the EBF prevalence axis, and 4.3 and 6.4% for the risk of death axis. Maps reflect administrative boundaries, land cover, lakes and population; gray-colored grid cells had fewer than ten people per 1 km × 1 km grid cell and were classified as ‘barren or sparsely vegetated’, or were not included in this analysis.
Extended Data Fig. 3
Extended Data Fig. 3. Analytic process overview and map of modeling regions.
a, The process used to produce EBF prevalence estimates in Africa involved three main parts. In the data-processing steps (peach), data were identified, extracted and prepared for use in the model. In the modeling phase (orange), we used these data and covariates in a stacked generalization ensemble model and spatiotemporal Gaussian process model. In post-processing (red), we calibrated the prevalence estimates to match GBD 2017 estimates and aggregated the estimates to the first- and second-level administrative subdivisions in each country. b, Modeling regions were defined as the five GBD regions for Africa: central (central SSA), east (eastern SSA), north (North Africa and the Middle East), south (southern SSA) and west (western SSA). As this study was limited to mainland Africa and African island nations (except Mauritius, Seychelles, Cape Verde Islands, Libya and Djibouti, where relevant data were not available or did not meet our inclusion and exclusion criteria), Middle East countries were excluded (Afghanistan, Bahrain, Iran, Iraq, Jordan, Kuwait, Lebanon, Oman, Palestine, Qatar, Saudi Arabia, Syria, Turkey, United Arab Emirates and Yemen).
Extended Data Fig. 4
Extended Data Fig. 4. Data availability for EBF among infants under 6 months by type and country, 1998–2017.
a, EBF data used in this study, by region and country. Color indicates the data source: DHS; MICS; or other survey type. Shape type indicates whether a data source has point (GPS) or polygon (for example, aggregated to an administrative level) location information. Size indicates the relative effective sample size for each source. A full list of data sources, with additional details about data type (such as survey microdata and survey reports) and geographical details, is provided in Supplementary Tables 2 and 3. b, Maps of EBF data coverage displayed at 5-year intervals. Maps show the spatial resolution of the underlying data in our models, and the color indicates the EBF prevalence as estimated from the data sources. Countries in white have no available survey data in the given time range.
Extended Data Fig. 5
Extended Data Fig. 5. Map of covariates.
Covariate raster layers of possible socioeconomic, environmental and health-related covariates used as inputs for the stacking modeling process. Time-varying covariates are presented for the year 2017. For additional detail on the year of production of non-time-varying covariates, see the individual covariate citation in Supplementary Table 7. Maps reflect administrative boundaries, land cover, lakes and population; gray-colored grid cells had fewer than ten people per 1 km × 1 km grid cell and were classified as ‘barren or sparsely vegetated’, or were not included in this analysis.
Extended Data Fig. 6
Extended Data Fig. 6. Maps of in-sample predictions from the ensemble covariate modeling process.
ac, Each map represents the in-sample predicted prevalence of EBF generated from the three submodels: (a) a generalized additive model; (b) a boosted regression trees model; and (c) lasso regression, for 2000. Maps reflect administrative boundaries, land cover, lakes and population; gray-colored grid cells had fewer than ten people per 1 km × 1 km grid cell and were classified as ‘barren or sparsely vegetated’, or were not included in this analysis.
Extended Data Fig. 7
Extended Data Fig. 7. Predictions comparison from the covariate sensitivity analysis.
ae, EBF prevalence among infants under 6 months in 2017 at the 5 km × 5 km grid cell level, based on models with no covariates and including: a Gaussian process (a); raw covariates with no Gaussian process (b); raw covariates with a Gaussian process (c); stacked covariates with no Gaussian process (d) and stacked covariates with a Gaussian process (e; the final model). Estimates are shown without calibration to GBD 2017, to better highlight the differences between the models (that would have been masked after calibration). Maps reflect administrative boundaries, land cover, lakes and population; gray-colored grid cells had fewer than ten people per 1 km × 1 km grid cell and were classified as ‘barren or sparsely vegetated’, or were not included in this analysis.
Extended Data Fig. 8
Extended Data Fig. 8. Predictions comparison from the recall period sensitivity analysis.
a,b, EBF prevalence among infants under 6 months in 2000 at the 5 km × 5 km grid cell level, based on models containing only surveys that specify a 24-h recall period (a) and containing all available surveys (b). Estimates are shown after calibration to GBD 2017, to better highlight the differences between the final maps when the models include all surveys or only surveys that specify a 24-h recall period. Maps reflect administrative boundaries, land cover, lakes and population; gray-colored grid cells had fewer than ten people per 1 km × 1 km grid cell and were classified as ‘barren or sparsely vegetated’, or were not included in this analysis.
Extended Data Fig. 9
Extended Data Fig. 9. National time series plots and aggregated input data.
National time series plots of the post-GBD calibration final estimates by country during 2000–2017. Uncertainty ranges are presented in gray, and aggregated input data are classified by survey series (purple, country specific; green, DHS; yellow, MICS), data type (square, polygon; circle, point) and whether the survey is nationally or subnationally representative. A list of subnationlly representative surveys in given in Supplementary Table 10.

References

    1. Ending Preventable Child Deaths from Pneumonia and Diarrhoea by 2025: The Integrated Global Action Plan for Pneumonia and Diarrhoea (GAPPD) (WHO & UNICEF, 2013). - PubMed
    1. Akachi Y, Steenland M, Fink G. Associations between key intervention coverage and child mortality: an analysis of 241 sub-national regions of sub-Saharan Africa. Int. J. Epidemiol. 2017;47:740–751. doi: 10.1093/ije/dyx262. - DOI - PubMed
    1. Darmstadt G, et al. Evidence-based, cost-effective interventions: how many newborn babies can we save? Lancet. 2005;11:977–988. doi: 10.1016/S0140-6736(05)71088-6. - DOI - PubMed
    1. Roberts TJ, Carnahan E, Gakidou E. Can breastfeeding promote child health equity? A comprehensive analysis of breastfeeding patterns across the developing world and what we can learn from them. BMC Med. 2013;11:254. doi: 10.1186/1741-7015-11-254. - DOI - PMC - PubMed
    1. Stanaway JD, et al. Global, regional, and national comparative risk assessment of 84 behavioural, environmental and occupational, and metabolic risks or clusters of risks for 195 countries and territories, 1990–2017: a systematic analysis for the Global Burden of Disease Study 2017. Lancet. 2018;392:1923–1994. doi: 10.1016/S0140-6736(18)32225-6. - DOI - PMC - PubMed

Publication types