. 2019 Sep;36(9):1877-1890.
doi: 10.1007/s10815-019-01530-w. Epub 2019 Jul 22.

Amyloid-like substance in mice and human oocytes and embryos

Affiliations

Amyloid-like substance in mice and human oocytes and embryos

Ricardo N Pimentel et al. J Assist Reprod Genet. 2019 Sep.

Abstract

Purpose: To identify and characterize amyloid-like substance (ALS) in human and mouse oocytes and preimplantation embryos.

Methods: An experimental prospective pilot study. A total of 252 mouse oocytes and preimplantation embryos and 50 immature and in vitro matured human oocytes and parthenogenetic human embryos, from 11 consenting fertility patients, ages 18-45. Fluorescence intensity from immunofluorescent staining and data from confocal microscopy were quantified. Data were compared by one-way analysis of variance, with the least square-MEANS post-test, Pearson correlation coefficients (r), and bivariate analyses (t tests). ALS morphology was verified using transmission electron microscopy.

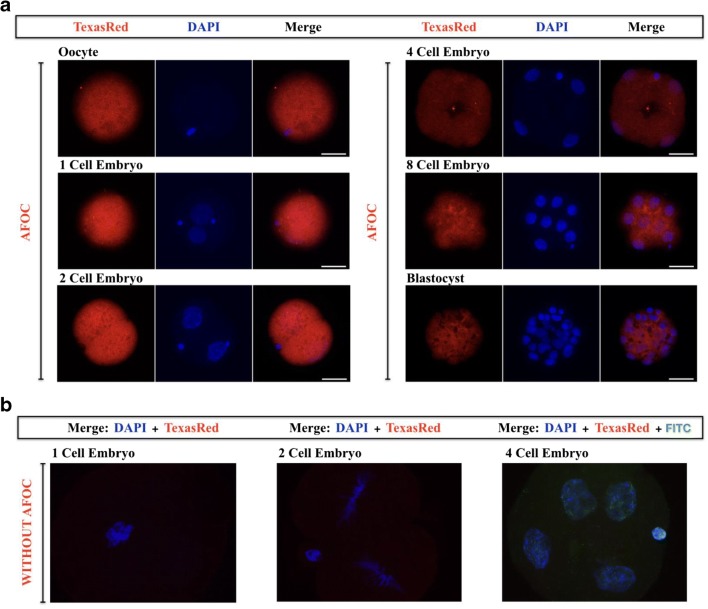
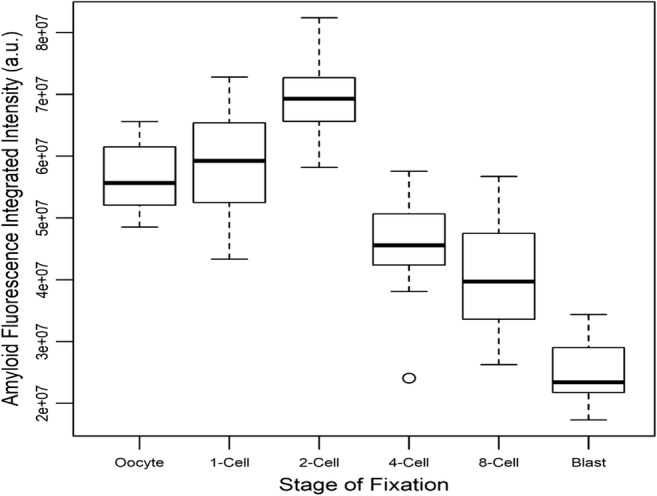
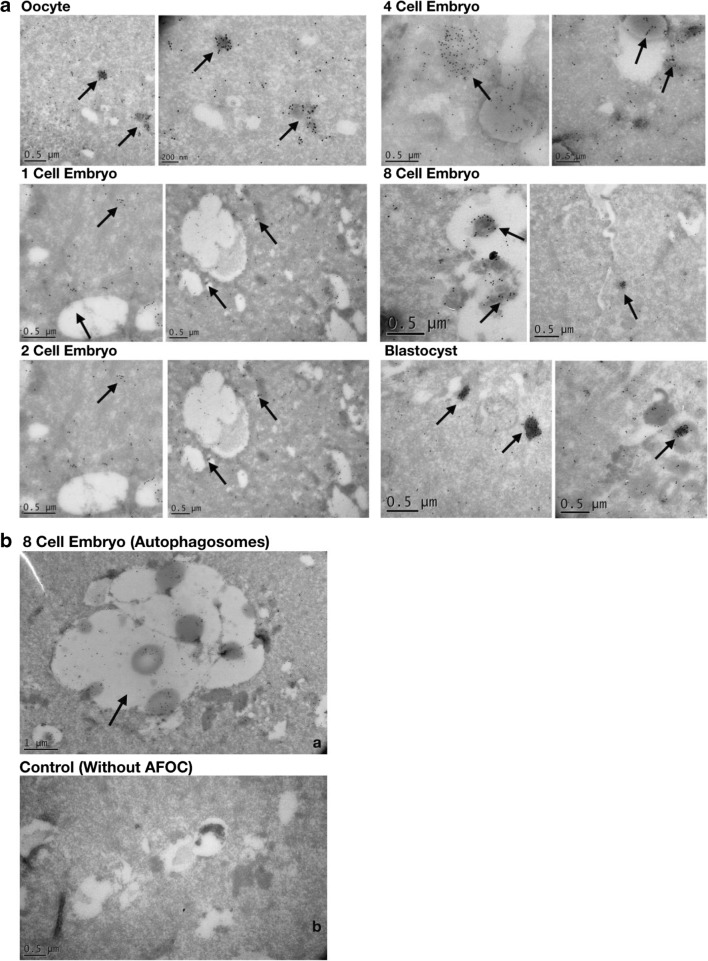
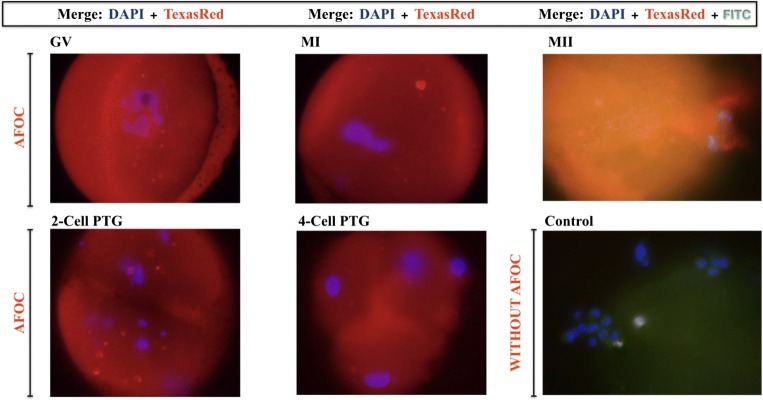
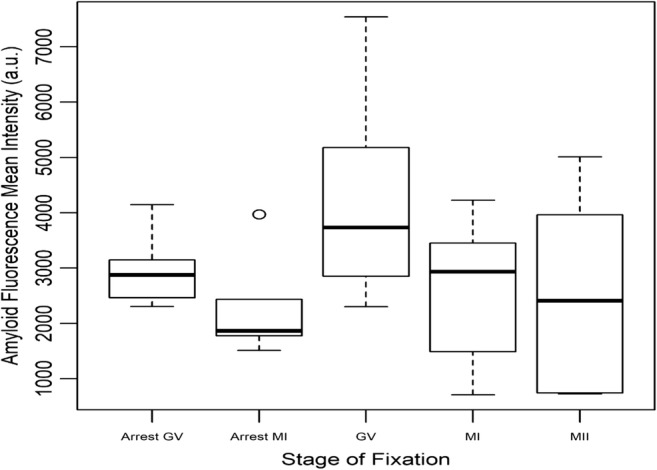
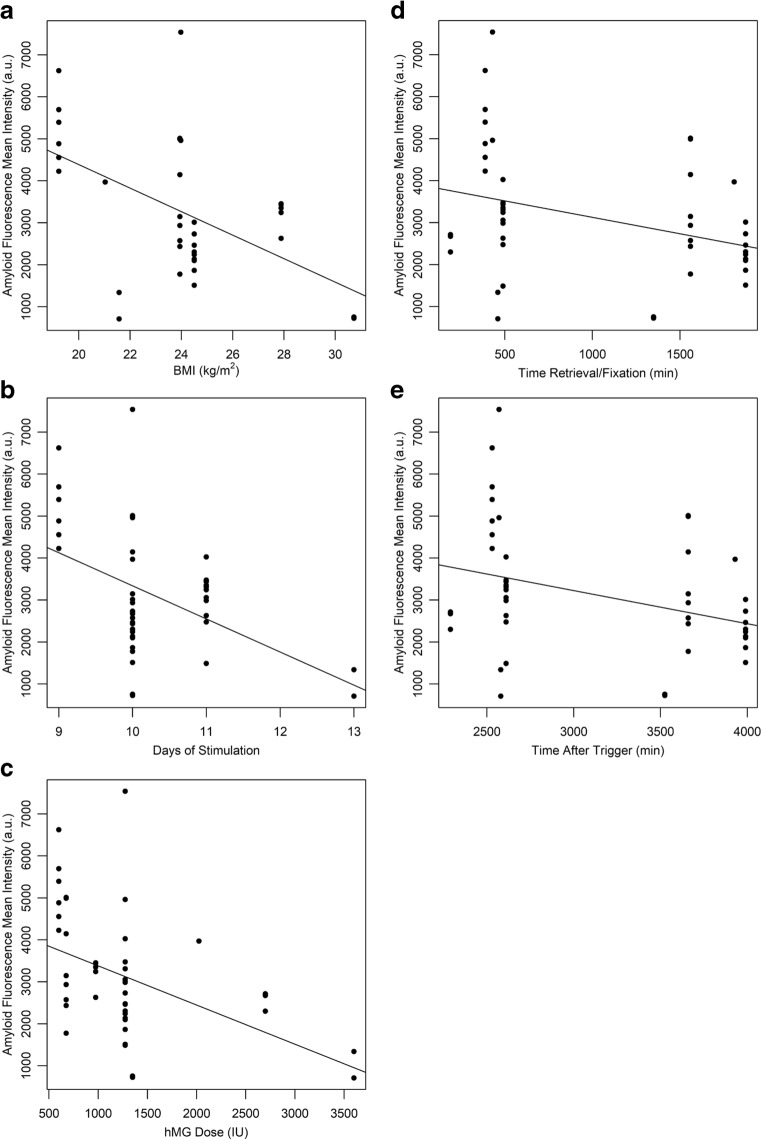
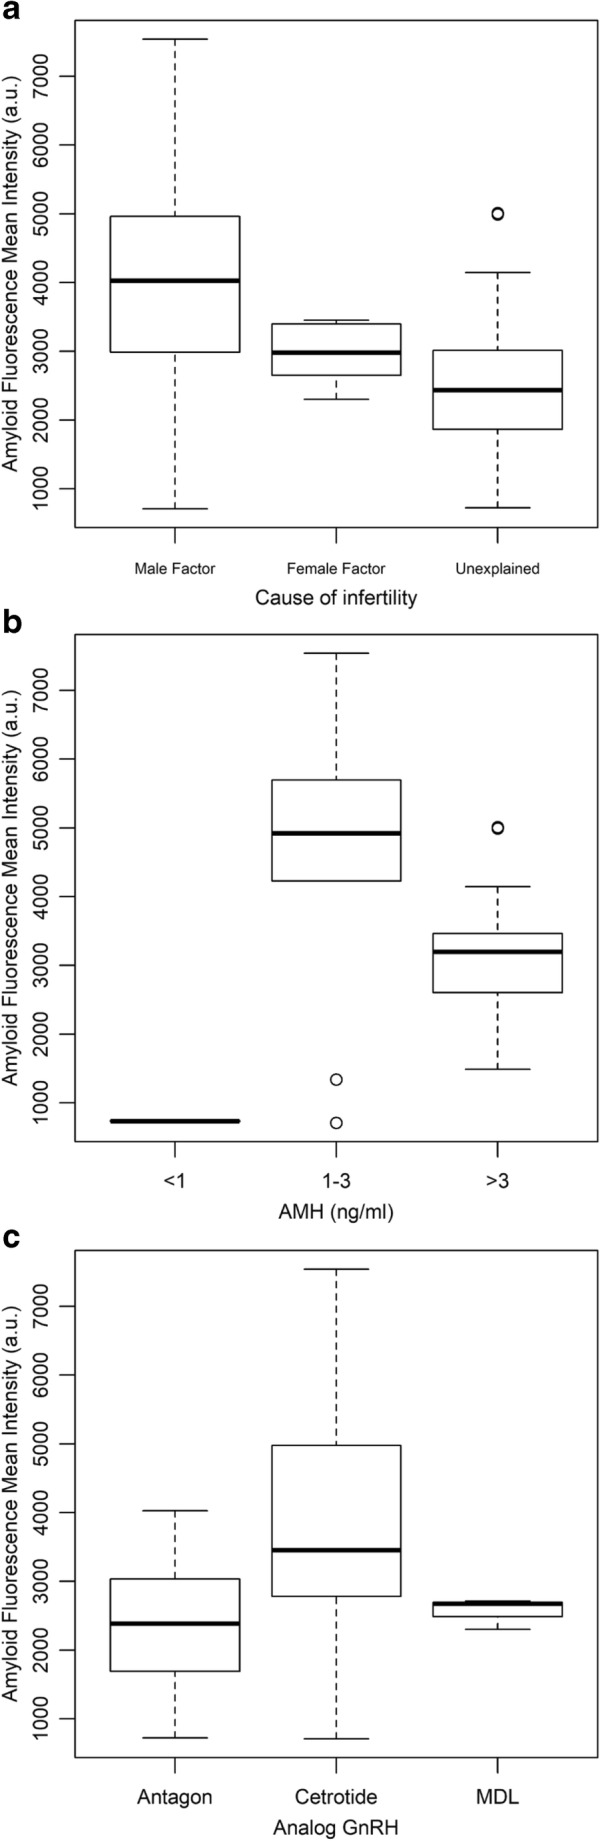
Results: Immunostaining for ALS appears throughout the zona pellucida, as well as in the cytoplasm and nucleus of mouse and human oocytes, polar bodies, and parthenogenetic embryos, and mouse preimplantation embryos. In mouse, 2-cell embryos exhibited the highest level of ALS (69000187.4 ± 6733098.07). Electron microscopy confirmed the presence of ALS. In humans, fresh germinal vesicle stage oocytes exhibited the highest level of ALS (4164.74088 ± 1573.46) followed by metaphase I and II stages (p = 0.008). There was a significant negative association between levels of ALS and patient body mass index, number of days of ovarian stimulation, dose of gonadotropin used, time between retrieval and fixation, and time after the hCG trigger. Significantly higher levels of ALS were found in patients with AMH between 1 and 3 ng/ml compared to < 1 ng/ml.

Conclusion: We demonstrate for the first time the presence, distribution, and change in ALS throughout some stages of mouse and human oocyte maturation and embryonic development. We also determine associations between ALS in human oocytes with clinical characteristics.

Keywords: Amyloid; Oocyte quality; Reproductive aging; female fertility.


Figures

Fig. 1
Fig. 1
Descriptive data of amyloid-like substance using immunostaining among mice oocytes and embryo stages. a Single-plane images of representative oocytes and embryos are shown with a scale bar of 5 μm. Amyloid-like substance forms static aggregates in cells. Cells were imaged starting at 3 h after fixation. Representative cells are shown with AFOC in red and the nucleus in blue. b Control specimens, in which the first antibody in the immunostaining process was omitted, exhibited no significant immuno staining. In the 4-cell embryo stage sample, we used another first antibody (anti-gamma H2A.X antibody [EP854(2)Y], with the secondary antibody FITC) as a positive control
Fig. 2
Fig. 2
Boxplot showing levels of amyloid-like substance by integrated intensity of immunostaining signal according to the stage of fixation in mice oocytes and embryo stages. Quantification of AFOC signal was established using Image J program
Fig. 3
Fig. 3
Distribution of amyloid-like substance among mice oocytes and embryo stages illustrated by immunoelectron microscopy. Gold particles are labeled on protein aggregates (arrows at a) and inside autophagosome (b). There is no labeling on secondary antibody control (b) (the bar is the same for a and b, except oocyte and autophagosome)
Fig. 4
Fig. 4
Descriptive data of amyloid-like substance using immunostaining among human immature and in vitro mature oocytes, and parthenogenetic embryos. Single-plane images of representative single cells are shown. Scale bar, 5 μm. Amyloid-like substance forms static aggregates in cells. Cells were imaged starting at 3 h after fixation. Representative cells are shown with AFOC in red and the nucleus in blue. Control specimens, in which the first antibody in the immunostaining process was omitted, exhibited no significant immuno staining. In the MII and control samples, we used another first antibody (anti-gamma H2A.X antibody [EP854(2)Y], with the secondary antibody FITC) as a positive control
Fig. 5
Fig. 5
Boxplot showing levels of amyloid-like substance by mean intensity of immunostaining signal according to the stage of fixation in human immature and mature oocytes. Quantification of AFOC signal was established using Image J program
Fig. 6
Fig. 6
a Negative linear correlation between levels of amyloid, measured by mean intensity, and BMI (Pearson correlation coefficients 0.54097; p = 0.0007). b Negative linear correlation between levels of amyloid, measured by mean intensity and days of stimulation (Pearson correlation coefficients 0.44136; p = 0.0021). c Negative linear correlation between levels of amyloid, measured by mean intensity, and hMG dose (Pearson correlation coefficients 0.44208; p = 0.0021). d Negative linear correlation between levels of amyloid, measured by mean intensity, and time between retrieval and fixation (Pearson correlation coefficients 0.33304; p = 0.0237). e Negative linear correlation between levels of amyloid, measured by mean intensity, and time after trigger (Pearson correlation coefficients 0.33420; p = 0.0232)
Fig. 7
Fig. 7
Boxplot showing the comparison of amyloid levels between “Cause of infertility” categories. Higher levels of amyloid were found in patients submitted to IVF for male factors when compared to unexplained cause (3926.35259 ± 1861.00 vs. 2550.47619 ± 1222.10; p = 0.0049). p values related to the post-test LS-means (ANOVA). b Boxplot showing the comparison of amyloid levels between AMH categories. Levels of amyloid was higher in the group of AMH between 1 and 3 ng/ml, when compared to < 1 ng/ml (4592.6 ± 2126.3 vs. 737.3 ± 14.7; p = 0.0002) and > 3 ng/ml (4592.6 ± 2126.3 vs. 3197.2 ± 895.0; p = 0.0067). p values related to the post-test LS-means (ANOVA). c Boxplot showing the comparison of amyloid levels between “type of Analog GnRH” categories. Higher levels of amyloid were found in patients who used Cetrotide instead of Antagon (3871.74643 ± 1660.09 vs. 2368.57185 ± 993.40; p = 0.0008). p values related to the post-test LS-means (ANOVA)

References

    1. Pastore LM, Christianson MS, Stelling J, Kearns WG, Segars JH. Reproductive ovarian testing and the alphabet soup of diagnoses: DOR, POI, POF, POR, and FOR. J Assist Reprod Genet. 2018;35(1):17–23. - PMC - PubMed
    1. Adhikari D, Zheng W, Shen Y, et al. Tsc/mTORC1 signaling in oocytes governs the quiescence and activation of primordial follicles. Hum Mol Genet. 2010;19:397–410. doi: 10.1093/hmg/ddp483. - DOI - PMC - PubMed
    1. Zhang H, Liu K. Cellular and molecular regulation of the activation of mammalian primordial follicles: somatic cells initiate follicle activation in adulthood. Hum Reprod Update. 2015;21(6):779–786. doi: 10.1093/humupd/dmv037. - DOI - PubMed
    1. Sun X, Su Y, He Y, Zhang J, Liu W, Zhang H, Hou Z, Liu J, Li J. New strategy for in vitro activation of primordial follicles with mTOR and PI3K stimulators. Cell Cycle. 2015;14(5):721–731. doi: 10.1080/15384101.2014.995496. - DOI - PMC - PubMed
    1. Optimizing natural fertility. Fertil Steril. 2008;90(5 Suppl):S1–6. - PubMed

LinkOut - more resources