Review
. 2019 Jul 22;19(8):62.
doi: 10.1007/s11892-019-1173-y.

The Genetic Epidemiology of Type 2 Diabetes: Opportunities for Health Translation

Affiliations
Review

The Genetic Epidemiology of Type 2 Diabetes: Opportunities for Health Translation

James B Meigs. Curr Diab Rep. .

Abstract

Purpose of review: Genome-wide association studies have delineated the genetic architecture of type 2 diabetes. While functional studies to identify target transcripts are ongoing, new genetic knowledge can be translated directly to health applications. The review covers several translation directions but focuses on genomic polygenic scores for screening and prevention.

Recent findings: Over 400 genomic variants associated with T2D and its related quantitative traits are now known. Genetic scores comprising dozens to millions of associated variants can predict incident T2D. However, measurement of body mass index is more efficient than genetic scores to detect T2D risk groups, and knowledge of T2D genetic risk alone seems insufficient to improve health. Genetically determined metabolic sub-phenotypes can be identified by clustering variants associated with physiological axes like insulin resistance. Genetic sub-phenotyping may be a way forward to identify specific individual phenotypes for prevention and treatment. Genomic polygenic scores for T2D can predict incident diabetes but may not be useful to improve health overall. Genetic detection of T2D sub-phenotypes could be useful to personalize screening and care.

Keywords: Epidemiology; Genetics; Genomics; Health outcomes; Risk score; Type 2 diabetes.


Conflict of interest statement

Compliance with Ethical Standards

Conflict of Interest James B. Meigs reports that he is an Academic Associate for Quest Diagnostics, Inc.

Figures

Fig. 1
Fig. 1
Genomic polygenic risk for coronary artery disease. Three polygenic scores for coronary artery disease were calculated in the UK Biobank (n = 288,978) including 50 (panel a), 49,310 (panel b), and 6,630,150 (panel c) variants. As millions of variants enter a genomic polygenic score, the shape of the risk curve does not change, but a few individuals at relatively high risk of coronary heart disease begin to emerge. While these few additional individuals may be targeted for intervention to reduce risk, sophisticated genomic polygenic scores cannot be expected to improve T2D risk model performance overall (adapted by permission from Springer Nature from Khera et al. Nature Genetics. 2018;50(9):1219–24) [26]
Fig. 2
Fig. 2
Body mass index outperforms genomic polygenic risk when identifying high—T2D risk individuals. In an example, high genetic risk, defined as the top ~ 3% of a genomic polygenic score, confers 3-fold increased risk versus the rest of the distribution and affects ~ 3% of a screened population, by definition. In 2019, a genomic polygenic score costs about $200/person. BMI exceeding 30 kg/m2, which affects about 30% of the US population, also confers about 3-fold increased risk versus non-obese. While consideration of costs of polygenic scores does not take into account other conditions that may be detected by array genotyping, the cost of a stadiometer is essentially free per patient over time
Fig. 3
Fig. 3
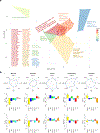
Distinct physiological processes underlying T2D can be defined by genetic variant clusters and “partitioned” polygenic scores. Panel a: clustering variants by direction of effect and magnitude of association with T2D-related metabolic traits defines physiological clusters. Traits like fasting glucose, insulin, lipids or BMI, then further clustering correlated groupings using a fuzzy c-means algorithm that assigns a score to a variant for each cluster (soft clustering, where a variant may be assigned to more than one cluster) produced 5–6 clusters that appeared to represent distinct physiological domains like insulin secretion, insulin action, excess adiposity, or impaired lipid metabolism (panel a is adapted by permission from Springer Nature from Mahajan et al. Nature Genetics. 2018;50(4):559–71) [3]. Panel b: In another study, a similar soft clustering approach defined five distinct physiological domains (columns) with variants combined to generate a “partitioned” polygenic score (PPS). The top row displays spider plots of association of physiological PPSs with metabolic traits (Proins, fasting proinsulin adjusted for fasting insulin; HOMA-B, homeostasis model assessment of beta cell function; TG, serum triglycerides; WC, waist circumference; BMI, body mass index; Fastins, fasting insulin; HOMA-IR, homeostasis model assessment of insulin resistance; WHR-F, waist-hip-ratio in females; WHR-M, waist-hip ratios in males). Points on spider plots in the inner part of the circle show negative association of the PPS and traits and those in the outer circle, positive association. The middle row shows associations of each of five PPSs with metabolic traits in four studies (METSIM, Ashkenazi, Partners Biobank, and UK Biobank, meta-analyzed together), and the bottom row displays the values of individuals with T2D who have each PPS in the highest decile versus all other individuals with T2D. Y-axes are effect size and direction and x-axes are metabolic traits. Soft clustering of genomic data produces genetically defined phenotypes with convincing and distinct patterns, offering potential for genetically based sub-phenotyping of T2D (panel b is adapted from Udler et al. PLoS Medicine. 2018;15(9):e1002654; Creative Commons user license https://creativecommons.org/licenses/by/4.0/)[37]

References

    1. Florez JC, Udler MS, Hanson RL. Genetics of type 2 diabetes. In: Cowie CCCS, Menke A, Cissell MA, Eberhardt MS, Meigs JB, Gregg EW, Knowler WC, Barrett-Connor E, Becker DJ, Brancati FL, Boyko EJ, Herman WH, Howard BV, Narayan KMV, Rewers M, Fradkin JE, editors. Diabetes in America, 3rd ed NIH Pub No. 17–1468 ed. Bethesda: National Institutes of Health; 2018. p. 14.1–25.
    1. Mahajan A, Taliun D, Thurner M, Robertson NR, Torres JM, Rayner NW, et al. Fine-mapping type 2 diabetes loci to single-variant resolution using high-density imputation and islet-specific epigenome maps. Nat Genet. 2018;50(11):1505–13

      •• This genome-wide association study of more than one million people of European ancestry is the current “definitive” framework for T2D common variant genetic architecture. Supplementary Figure 10 shows the distribution of a genomic polygenic score for T2D in individuals of European ancestry.

    1. Mahajan A, Wessel J, Willems SM, Zhao W, Robertson NR, Chu AY, et al. Refining the accuracy of validated target identification through coding variant fine-mapping in type 2 diabetes. Nat Genet. 2018;50(4):559–71. - PMC - PubMed
    1. Fuchsberger C, Flannick J, Teslovich TM, Mahajan A, Agarwala V, Gaulton KJ, et al. The genetic architecture of type 2 diabetes. Nature. 2016;536(7614):41–7. - PMC - PubMed
    1. Pasquali L, Gaulton KJ, Rodriguez-Segui SA, Mularoni L, Miguel-Escalada I, Akerman I, et al. Pancreatic islet enhancer clusters enriched in type 2 diabetes risk-associated variants. Nat Genet. 2014;46(2):136–43. - PMC - PubMed

MeSH terms