. 2020 Feb;59(2):217-227.
doi: 10.1007/s40262-019-00804-x.

Population Pharmacokinetics of an Anti-PD-L1 Antibody, Durvalumab in Patients with Hematologic Malignancies

Affiliations

Population Pharmacokinetics of an Anti-PD-L1 Antibody, Durvalumab in Patients with Hematologic Malignancies

Ken Ogasawara et al. Clin Pharmacokinet. 2020 Feb.

Abstract

Background and objectives: Durvalumab, a human monoclonal antibody targeting programmed cell death ligand 1, has been approved for urothelial carcinoma and stage III non-small cell lung cancer by the US Food and Drug Administration and is being evaluated in various malignancies. The objective of this study was to develop a population-pharmacokinetic model of durvalumab in patients with various hematologic malignancies and to investigate the effects of demographic and disease factors on the pharmacokinetics in this population.

Methods: A total of 1812 concentrations from 267 patients with myelodysplastic syndromes, acute myeloid leukemia, multiple myeloma, non-Hodgkin lymphoma, or Hodgkin lymphoma were included in the analysis.

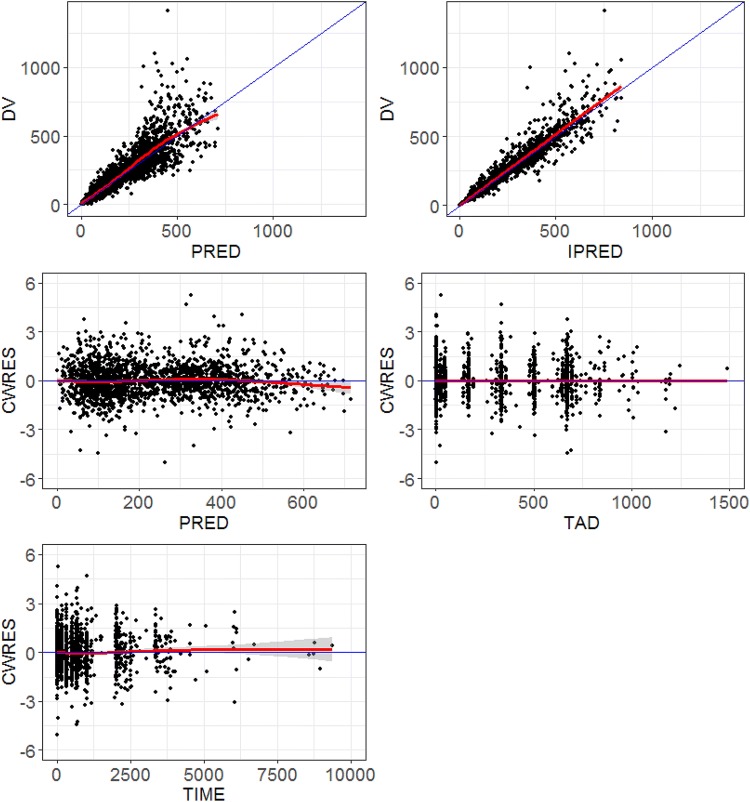
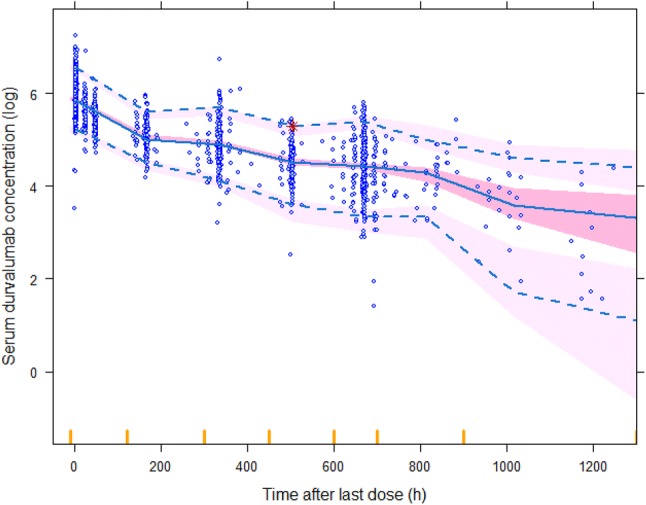
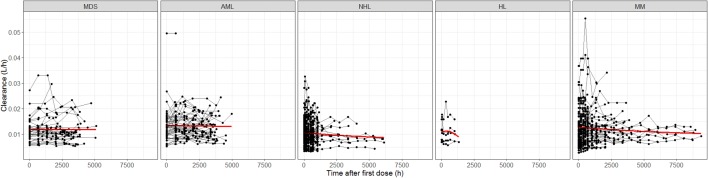
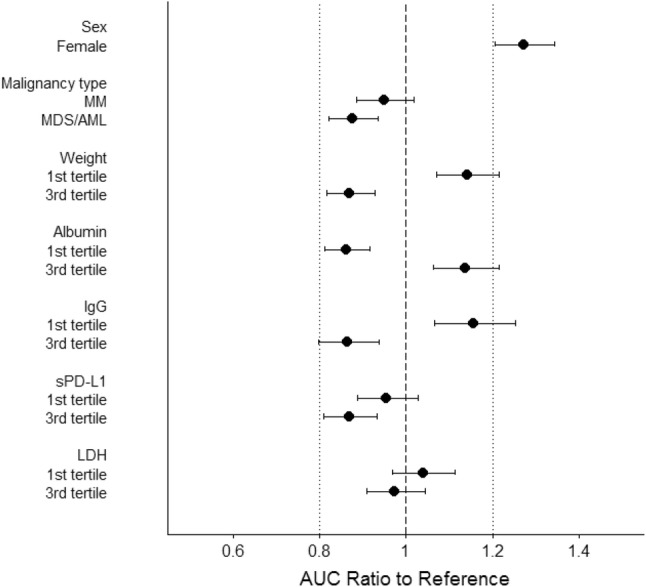
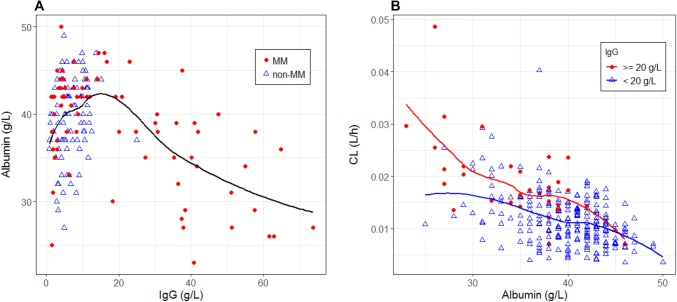
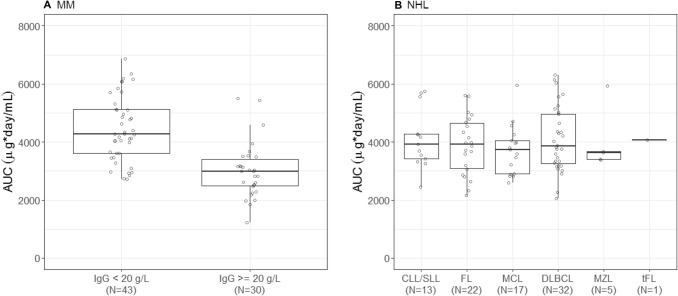
Results: The pharmacokinetics of durvalumab was adequately described by a two-compartment model with first-order elimination. A decrease in durvalumab clearance over time was mainly explained by incorporation of time-dependent changes in albumin (in all patients) and immunoglobulin G (in patients with multiple myeloma) into the model. For multiple myeloma, patients with immunoglobulin G ≥ 20 g/L showed a 30% lower area under the concentration-time curve at cycle 1 compared with patients with immunoglobulin G < 20 g/L. The impact of any baseline covariates on durvalumab pharmacokinetics did not appear to be clinically relevant. The pharmacokinetics of durvalumab in hematologic malignancies was generally consistent with previously reported pharmacokinetics in solid tumors.

Conclusions: These results support the same dosing regimen (1500 mg every 4 weeks) for both solid tumors and hematologic malignancies from the perspective of adequate exposure. Additionally, total immunoglobulin G level could be a critical covariate for the pharmacokinetics of monoclonal antibodies in patients with multiple myeloma.


Conflict of interest statement

Ken Ogasawara, Kathryn Newhall, Stephen E. Maxwell, Justine Dell’Aringa, Vitalina Komashko, Nurgul Kilavuz, Richard Delarue, Myron Czuczman, Lars Sternas, Shelonitda Rose, C.L. Beach, Steven Novick, Simon Zhou, Maria Palmisano, and Yan Li are employees of Celgene Corporation and hold equity ownership in Celgene Corporation.

Figures

Fig. 1
Fig. 1
Goodness-of-fit plots of the final population-pharmacokinetic model of durvalumab in subjects with hematologic malignancies. CWRES conditional weighted residuals, DV observed value, IPRED individual predicted values, PRED predicted values, TAD time after last dose (hour), TIME time after first dose (hour). The blue line represents the identity line or zero line. The red line represents the locally weighted scatterplot smoothing line
Fig. 2
Fig. 2
Visual predictive check for durvalumab in subjects with hematologic malignancies. Circles represent observed data. Lines represent the 5th (dashed), 50th (solid), and 95th (dashed) percentiles of the observed data. Shaded areas represent nonparametric 90% confidence intervals about the 5th (light pink), 50th (dark pink), and 95th (light pink) percentiles for the corresponding model-predicted percentiles
Fig. 3
Fig. 3
Time-dependent clearance of durvalumab by type of hematologic malignancy. The red line represents the locally weighted scatterplot smoothing line. AML acute myeloid leukemia, CL clearance, HL Hodgkin lymphoma, MDS myelodysplastic syndromes, MM multiple myeloma, N number of subjects, NHL non-Hodgkin lymphoma
Fig. 4
Fig. 4
Forest plot of baseline covariates on durvalumab exposure. Data are shown as median (90% confidence interval). References are male (sex), non-Hodgkin lymphoma, and Hodgkin lymphoma (malignancy type) and second tertile (weight, albumin, immunoglobulin G [IgG], soluble programmed cell death ligand 1 [sPD-L1] and lactate dehydrogenase [LDH]). First, second, and third tertile of weight at baseline are 37.7–68.5 kg, 68.6–80.1 kg, and 80.5–121 kg, respectively. First, second, and third tertile of albumin at baseline are 23–38 g/L, 39–42 g/L, and 43–50 g/L, respectively. First, second and third tertile of IgG at baseline are 0.70–4.99 g/L, 5.00–10.4 g/L, and 10.5–73.7 g/L, respectively. First, second, and third tertile of sPD-L1 at baseline are 72.0–145.5 pg/mL, 145.7–204.1 pg/mL, and 204.5–984.6 pg/mL, respectively. First, second, and third tertile of LDH at baseline are 89–190 U/L, 191–261 U/L, and 263–1481 U/L, respectively. Area under the concentration–time curve at cycle 1 (AUC) of durvalumab was used as an exposure parameter and calculated based on individual Bayesian estimates of PK parameters at baseline from the final population-PK model
Fig. 5
Fig. 5
Association of albumin with immunoglobulin G [IgG] (a) and durvalumab clearance (CL) controlling IgG (b). The lines represent the locally weighted scatterplot smoothing lines. MM multiple myeloma
Fig. 6
Fig. 6
Effects of hypergammaglobulinemia in multiple myeloma [MM] (a) and subtype of non-Hodgkin lymphoma [NHL] (b) on durvalumab exposure. AUC area under the concentration–time curve at cycle 1, CLL chronic lymphocytic leukemia, DLBCL diffuse large B-cell lymphoma, FL follicullar lymphoma, IgG immunoglobulin G, MCL mantle cell lymphoma, MZL marginal zone lymphoma, N number of subjects, SLL small lymphocytic leukemia, tFL transformed follicular lymphoma

References

    1. Chen L, Han X. Anti-PD-1/PD-L1 therapy of human cancer: past, present, and future. J Clin Invest. 2015;125(9):3384–3391. doi: 10.1172/JCI80011. - DOI - PMC - PubMed
    1. Stewart R, Morrow M, Hammond SA, Mulgrew K, Marcus D, Poon E, et al. Identification and characterization of MEDI4736, an antagonistic anti-PD-L1 monoclonal antibody. Cancer Immunol Res. 2015;3(9):1052–1062. doi: 10.1158/2326-6066.CIR-14-0191. - DOI - PubMed
    1. US Food and Drug Administration. Drugs@FDA: FDA approved drug products. https://www.accessdata.fda.gov/scripts/cder/daf/. Accessed 11 Feb 2019.
    1. Sheng J, Srivastava S, Sanghavi K, Lu Z, Schmidt BJ, Bello A, et al. Clinical pharmacology considerations for the development of immune checkpoint inhibitors. J Clin Pharmacol. 2017;57(Suppl. 10):S26–S42. doi: 10.1002/jcph.990. - DOI - PubMed
    1. Ahamadi M, Freshwater T, Prohn M, Li CH, de Alwis DP, de Greef R, et al. Model-based characterization of the pharmacokinetics of pembrolizumab: a humanized anti-PD-1 monoclonal antibody in advanced solid tumors. CPT Pharmacometrics Syst Pharmacol. 2017;6(1):49–57. doi: 10.1002/psp4.12139. - DOI - PMC - PubMed

Publication types

MeSH terms