

Graph theory analysis of resting-state functional magnetic resonance imaging in essential tremor
- PMID: 31332912
- PMCID: PMC6865733
- DOI: 10.1002/hbm.24730
Graph theory analysis of resting-state functional magnetic resonance imaging in essential tremor
Abstract
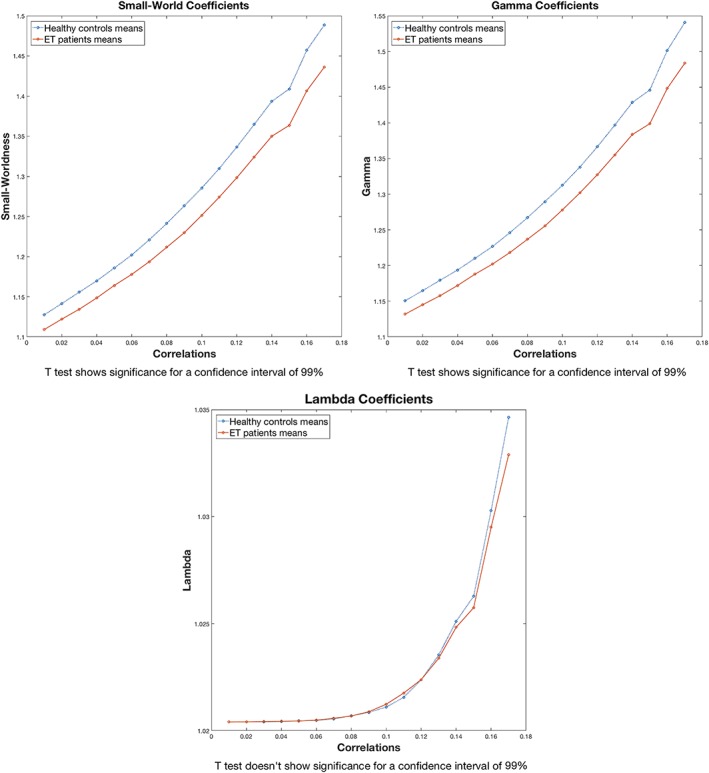
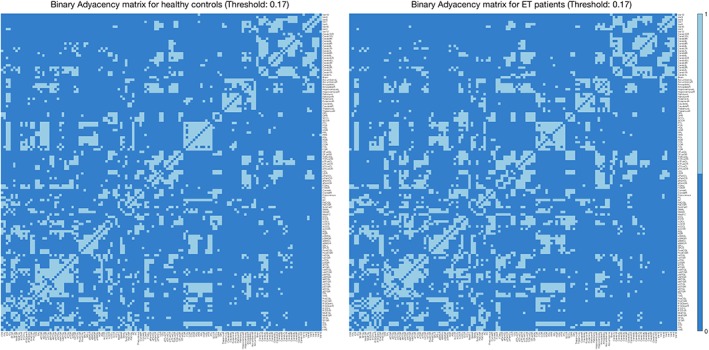
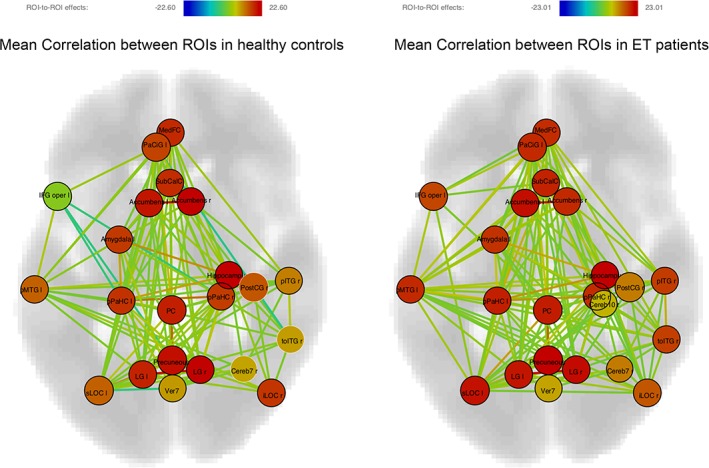
Essential tremor (ET) is a neurological disease with both motor and nonmotor manifestations; however, little is known about its underlying brain basis. Furthermore, the overall organization of the brain network in ET remains largely unexplored. We investigated the topological properties of brain functional network, derived from resting-state functional magnetic resonance imaging (MRI) data, in 23 ET patients versus 23 healthy controls. Graph theory analysis was used to assess the functional network organization. At the global level, the functional network of ET patients was characterized by lower small-worldness values than healthy controls-less clustered functionality of the brain. At the regional level, compared with the healthy controls, ET patients showed significantly higher values of global efficiency, cost and degree, and a shorter average path length in the left inferior frontal gyrus (pars opercularis), right inferior temporal gyrus (posterior division and temporo-occipital part), right inferior lateral occipital cortex, left paracingulate, bilateral precuneus bilaterally, left lingual gyrus, right hippocampus, left amygdala, nucleus accumbens bilaterally, and left middle temporal gyrus (posterior part). In addition, ET patients showed significant higher local efficiency and clustering coefficient values in frontal medial cortex bilaterally, subcallosal cortex, posterior cingulate cortex, parahippocampal gyri bilaterally (posterior division), right lingual gyrus, right cerebellar flocculus, right postcentral gyrus, right inferior semilunar lobule of cerebellum and culmen of vermis. Finally, the right intracalcarine cortex and the left orbitofrontal cortex showed a shorter average path length in ET patients, while the left frontal operculum and the right planum polare showed a higher betweenness centrality in ET patients. In conclusion, the efficiency of the overall brain functional network in ET is disrupted. Further, our results support the concept that ET is a disorder that disrupts widespread brain regions, including those outside of the brain regions responsible for tremor.
Keywords: MRI; biomarker; essential tremor; functional connectivity; graph theory; resting state.
© 2019 Wiley Periodicals, Inc.
Conflict of interest statement
The authors declare no competing conflict of interest.
Figures
Comment in
-
Graph theory analysis of resting-state functional magnetic resonance imaging in essential tremor.Hum Brain Mapp. 2020 Apr 15;41(6):1689-1694. doi: 10.1002/hbm.24900. Epub 2019 Dec 15. Hum Brain Mapp. 2020. PMID: 31840354 Free PMC article. No abstract available.
Similar articles
-
Brain functional connectivity during storage based on resting state functional magnetic resonance imaging with synchronous urodynamic testing in healthy volunteers.Brain Imaging Behav. 2021 Jun;15(3):1676-1684. doi: 10.1007/s11682-020-00362-y. Brain Imaging Behav. 2021. PMID: 32725470
-
Resting state fMRI reveals the altered synchronization of BOLD signals in essential tremor.J Neurol Sci. 2018 Sep 15;392:69-76. doi: 10.1016/j.jns.2018.07.008. Epub 2018 Jul 10. J Neurol Sci. 2018. PMID: 30025236
-
The changes in the topological properties of brain structural network based on diffusion tensor imaging in pediatric epilepsy patients with vagus nerve stimulators: A graph theoretical analysis.Brain Dev. 2021 Jan;43(1):97-105. doi: 10.1016/j.braindev.2020.07.006. Epub 2020 Jul 24. Brain Dev. 2021. PMID: 32713660
-
Alterations in degree centrality and functional connectivity in tension-type headache: a resting-state fMRI study.Brain Imaging Behav. 2024 Aug;18(4):819-829. doi: 10.1007/s11682-024-00875-w. Epub 2024 Mar 21. Brain Imaging Behav. 2024. PMID: 38512647 Review.
-
Mapping Essential Tremor to a Common Brain Network Using Functional Connectivity Analysis.Neurology. 2023 Oct 10;101(15):e1483-e1494. doi: 10.1212/WNL.0000000000207701. Epub 2023 Aug 18. Neurology. 2023. PMID: 37596042 Free PMC article. Review.
Cited by
-
Disrupted brain gray matter networks in drug-naïve participants with essential tremor.Neuroradiology. 2021 Sep;63(9):1501-1510. doi: 10.1007/s00234-021-02653-7. Epub 2021 Mar 29. Neuroradiology. 2021. PMID: 33782719
-
Reclassification of patients with tremor syndrome and comparisons of essential tremor and essential tremor-plus patients.J Neurol. 2022 Jul;269(7):3653-3662. doi: 10.1007/s00415-022-10985-4. Epub 2022 Jan 30. J Neurol. 2022. PMID: 35094153
-
The Contribution of Neuroimaging to the Understanding of Essential Tremor Pathophysiology: a Systematic Review.Cerebellum. 2022 Dec;21(6):1029-1051. doi: 10.1007/s12311-021-01335-7. Epub 2021 Oct 16. Cerebellum. 2022. PMID: 34657271
-
Thalamic and Visual Network Dysfunction Relates to Tremor Response in Thalamic Deep Brain Stimulation.Tremor Other Hyperkinet Mov (N Y). 2025 Aug 1;15:34. doi: 10.5334/tohm.1039. eCollection 2025. Tremor Other Hyperkinet Mov (N Y). 2025. PMID: 40756066 Free PMC article.
-
Identification of essential tremor based on resting-state functional connectivity.Hum Brain Mapp. 2023 Mar;44(4):1407-1416. doi: 10.1002/hbm.26124. Epub 2022 Nov 3. Hum Brain Mapp. 2023. PMID: 36326578 Free PMC article.
References
-
- Ackerman, P. L. , & Cianciolo, A. T. (2000). Cognitive, perceptual‐speed, and psychomotor determinants of individual differences during skill acquisition. Journal of Experimental Psychology. Applied, 6, 259–290. - PubMed
-
- Adolphs, R. , & Spezio, M. (2006). Role of the amygdala in processing visual social stimuli. Progress in Brain Research, 156, 363–378. - PubMed
-
- American Psychiatric, A. (1994). Diagnostic and Statistical Manual of Mental Disorders DSM‐IV. Washington, DC: American Psychiatric Association.
-
- Astafiev, S. V. , Stanley, C. M. , Shulman, G. L. , & Corbetta, M. (2004). Extrastriate body area in human occipital cortex responds to the performance of motor actions. Nature Neuroscience, 7, 542–548. - PubMed
Publication types
MeSH terms
Grants and funding
- FIS PI16/00451/Spanish Health Research Agency/International
- R01 NS039422/NS/NINDS NIH HHS/United States
- DPI-2015-72638-EXP/Spanish Ministry of Economy and Competitiveness/International
- Claire O'Neil Essential Tremor Research Fund/International
- NINDS #R01 NS073872/NH/NIH HHS/United States
- ICT-2011-287739/European Commission/International
- R01 NS094607/NS/NINDS NIH HHS/United States
- NINDS #R01 NS39422/NH/NIH HHS/United States
- R01 NS073872/NS/NINDS NIH HHS/United States
- RTC-2015-3967-1/Ministry of Economy and Competitiveness/International
- DPI-2015-68664-C4-1-R/Spanish Ministry of Economy and Competitiveness/International
- NINDS #R01 NS094607/NH/NIH HHS/United States
- R01 NS088257/NS/NINDS NIH HHS/United States
- NINDS #R01 NS088257/NH/NIH HHS/United States
- NINDS #R01 NS085136/NH/NIH HHS/United States
- R01 NS085136/NS/NINDS NIH HHS/United States
- FIS PI12/01602/Spanish Health Research Agency/International
LinkOut - more resources
Full Text Sources
Medical
Miscellaneous
