. 2019 Jul 3:13:682.
doi: 10.3389/fnins.2019.00682. eCollection 2019.

Empiric Methods to Account for Pre-analytical Variability in Digital Histopathology in Frontotemporal Lobar Degeneration

Affiliations

Empiric Methods to Account for Pre-analytical Variability in Digital Histopathology in Frontotemporal Lobar Degeneration

Lucia A A Giannini et al. Front Neurosci. .

Abstract

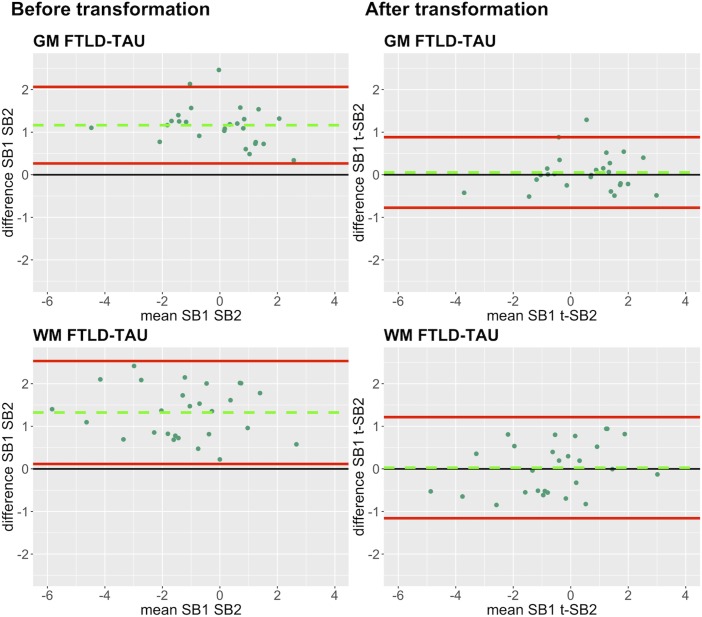
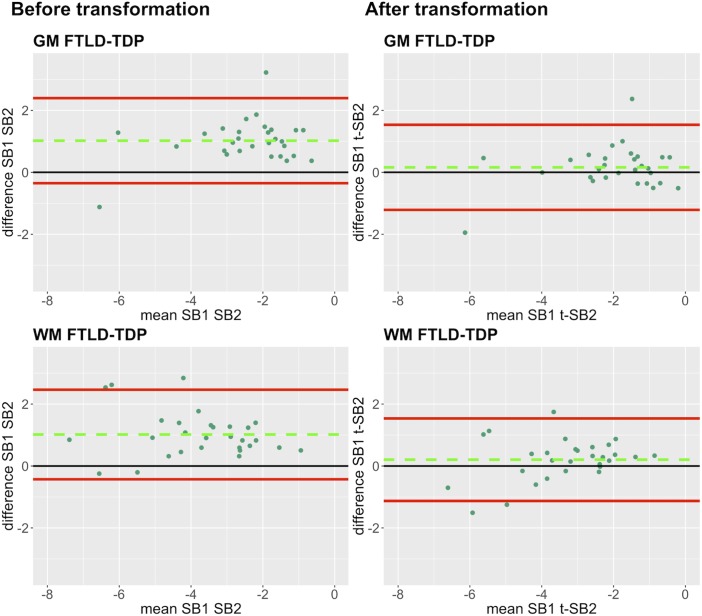
Digital pathology is increasingly prominent in neurodegenerative disease research, but variability in immunohistochemical staining intensity between staining batches prevents large-scale comparative studies. Here we provide a statistically rigorous method to account for staining batch effects in a large sample of brain tissue with frontotemporal lobar degeneration with tau inclusions (FTLD-Tau, N = 39) or TDP-43 inclusions (FTLD-TDP, N = 53). We analyzed the relationship between duplicate measurements of digital pathology, i.e., percent area occupied by pathology (%AO) for grey matter (GM) and white matter (WM), from two distinct staining batches. We found a significant difference in duplicate measurements from distinct staining batches in FTLD-Tau (mean difference: GM = 1.13 ± 0.44, WM = 1.28 ± 0.56; p < 0.001) and FTLD-TDP (GM = 0.95 ± 0.66, WM = 0.90 ± 0.77; p < 0.001), and these measurements were linearly related (R-squared [Rsq]: FTLD-Tau GM = 0.92, WM = 0.92; FTLD-TDP GM = 0.75, WM = 0.78; p < 0.001 all). We therefore used linear regression to transform %AO from distinct staining batches into equivalent values. Using a train-test set design, we examined transformation prerequisites (i.e., Rsq) from linear-modeling in training sets, and we applied equivalence factors (i.e., beta, intercept) to independent testing sets to determine transformation outcomes (i.e., intraclass correlation coefficient [ICC]). First, random iterations (×100) of linear regression showed that smaller training sets (N = 12-24), feasible for prospective use, have acceptable transformation prerequisites (mean Rsq: FTLD-Tau ≥0.9; FTLD-TDP ≥0.7). When cross-validated on independent complementary testing sets, in FTLD-Tau, N = 12 training sets resulted in 100% of GM and WM transformations with optimal transformation outcomes (ICC ≥ 0.8), while in FTLD-TDP N = 24 training sets resulted in optimal ICC in testing sets (GM = 72%, WM = 98%). We therefore propose training sets of N = 12 in FTLD-Tau and N = 24 in FTLD-TDP for prospective transformations. Finally, the transformation enabled us to significantly reduce batch-related difference in duplicate measurements in FTLD-Tau (GM/WM: p < 0.001 both) and FTLD-TDP (GM/WM: p < 0.001 both), and to decrease the necessary sample size estimated in a power analysis in FTLD-Tau (GM:-40%; WM: -34%) and FTLD-TDP (GM: -20%; WM: -30%). Finally, we tested generalizability of our approach using a second, open-source, image analysis platform and found similar results. We concluded that a small sample of tissue stained in duplicate can be used to account for pre-analytical variability such as staining batch effects, thereby improving methods for future studies.

Keywords: batch effects; digital histopathology; frontotemporal lobar degeneration; linear transformation method; pre-analytical variability; validation of a method.


Figures

FIGURE 1
FIGURE 1
Objectives and methods of this validation study and stepwise validation protocol. Panel outlines the aim and methods of our validation study to account for staining batch effects in digital pathology, including a stepwise protocol to assess relevant aspects of our proposed methodology. delta abs-diff, change in absolute difference; est. sample size, estimated required sample size in a power analysis; ICC, intraclass correlation coefficient; N, number of tissue samples; Rsq, R squared; SB1, staining batch 1 (original); SB2, staining batch 2 (new); t-SB2, transformed staining batch 2 (new).
FIGURE 2
FIGURE 2
Representative photomicrographs of staining batch variability in FTLD-Tau and FTLD-TDP. Photomicrographs depict a mid-frontal cortex section of FTLD-Tau (Corticobasal degeneration; left) and FTLD-TDP (TDP type A; right) with raw and digital %AO detection red overlay of pathology in gray matter (top) and white matter (bottom) in approximate matched areas in staining batch 1 (SB1) vs. staining batch 2 (SB2). There is slightly darker DAB chromogen signal and thus greater %AO in SB1 compared to SB2. Scale bar = 100 μm. FTLD-Tau, frontotemporal lobar degeneration with inclusions of the tau protein; FTLD-TDP, frontotemporal lobar degeneration with inclusions of the transactive response DNA-binding protein 43 kDa; GM, gray matter; SB1, staining batch 1 (original); SB2, staining run 2 (new); WM, white matter.
FIGURE 3
FIGURE 3
Bland-Altman plots of test-retest agreement between duplicate measurements of pathology from two distinct staining batches. Bland-Altman plots show test-retest agreement between SB1 and SB2 measurements of digital pathology (i.e., ln %AO). The green dashed line indicates the mean difference between SB1 and SB2 measurements, while the red solid lines mark the 95% limits of agreement between the two measurements. We find that mean difference between SB1 and SB2 significantly differs from zero (p < 0.001) in FTLD-Tau (A) and FTLD-TDP (B) in both GM and WM. FTLD-Tau, frontotemporal lobar degeneration with inclusions of the tau protein; FTLD-TDP, frontotemporal lobar degeneration with inclusions of the transactive response DNA-binding protein 43 kDa; GM, gray matter; SB1, staining batch 1 (original); SB2, staining batch 2 (new); WM, white matter.
FIGURE 4
FIGURE 4
Linear relationship between duplicate measurements of pathology from two distinct staining batches (SB1 Y-axis, SB2 X-axis). Scatterplots display the linear relationship between duplicate measurements of digital pathology (i.e., ln %AO) from SB1 (y-axis) and SB2 (x-axis) in FTLD-Tau (A) and FTLD-TDP (B), for both GM and WM measurements. In FTLD-Tau GM, the model Rsq is 0.92 (p < 0.001); in FTLD-Tau WM, the model Rsq is 0.92 (p < 0.001). In FTLD-TDP GM, the model Rsq is 0.75 (p < 0.001); in FTLD-TDP WM, the model Rsq is 0.78 (p < 0.001). FTLD-Tau, frontotemporal lobar degeneration with inclusions of the tau protein; FTLD-TDP, frontotemporal lobar degeneration with inclusions of the transactive response DNA-binding protein 43 kDa; GM, gray matter; ln %AO, natural logarithmic transformation of percent area occupied by pathology; Rsq, R squared; SB1, staining batch 1 (original); SB2, staining batch 2 (new); WM, white matter.
FIGURE 5
FIGURE 5
Bland-Altman plots of test-retest agreement between duplicate measurements of pathology before vs. after transformation in FTLD-Tau. Plots portray test-retest agreement between duplicate measurements of digital pathology (i.e., ln %AO) in FTLD-Tau from SB1 and SB2 before and after transforming the data using our validated linear regression-based method. Here we illustrate the reduction in batch-related difference in digital measurements resulting from the application of our transformation method in a single train-test split in FTLD-Tau (Step 3). The green dashed line indicates the mean difference between SB1 and SB2 measurements, while the red solid lines mark the 95% limits of agreement between the two measurements. We find that mean difference between SB1 and SB2/t-SB2 is significantly different from zero before transformation (p < 0.05, one-sample t-test), whereas it is not significantly different from zero after transformation (p > 0.05) in both GM and WM. FTLD-Tau, frontotemporal lobar degeneration with inclusions of the tau protein; GM, gray matter; SB1, staining batch 1 (original); SB2, staining batch 2 (new); t-SB2, transformed staining batch 2 (new); WM, white matter.
FIGURE 6
FIGURE 6
Bland-Altman plots of test-retest agreement between duplicate measurements of pathology before vs. after transformation in FTLD-TDP. Plots portray test-retest agreement between duplicate measurements of digital pathology (i.e., ln %AO) in FTLD-TDP from SB1 and SB2 before and after transforming the data using our validated linear regression-based method. Here we illustrate the reduction in batch-related difference in digital measurements resulting from the application of our transformation method in a single train-test split in FTLD-TDP (Step 3). The green dashed line indicates the mean difference between SB1 and SB2 measurements, while the red solid lines mark the 95% limits of agreement between the two measurements. We find that mean difference between SB1 and SB2/t-SB2 is significantly different from zero before transformation (p < 0.05, one-sample t-test), whereas it is not significantly different from zero after transformation (p > 0.05) in both GM and WM. FTLD-TDP, frontotemporal lobar degeneration with inclusions of the transactive response DNA-binding protein 43; GM, gray matter; SB1, staining batch 1 (original); SB2, staining batch 2 (new); t-SB2, transformed staining batch 2 (new); WM, white matter.
FIGURE 7
FIGURE 7
Standard operating procedure for prospective use of our validated transformation method. Panel outlines a standard operating procedure (SOP) for prospective addition of new data to existing datasets where we use our validated transformation method to account for staining batch effects. FTLD-Tau, frontotemporal lobar degeneration with inclusions of the tau protein; FTLD-TDP, frontotemporal lobar degeneration with inclusions of the transactive response DNA-binding protein 43; LMN, number of tissue samples; SB1, staining batch 1 (original); SB2, staining batch 2 (new); SOP, standard operating procedure; t-SB2, transformed staining batch 2 (new).

References

    1. Bankhead P., Loughrey M. B., Fernández J. A., Dombrowski Y., McArt D. G., Dunne P. D., et al. (2017). QuPath: open source software for digital pathology image analysis. Sci. Rep. 7 168–178. 10.1038/s41598-017-17204-17205 - DOI - PMC - PubMed
    1. Bland M. J., Altman D. G. (1986). Statistical methods for assessing agreement between two methods of clinical measurement. Lancet 1 307–310. 10.1016/S0140-6736(86)90837-90838 - DOI - PubMed
    1. Boxer A. L., Gold M., Huey E., Hu W. T., Rosen H., Kramer J., et al. (2013). The advantages of frontotemporal degeneration drug development (part 2 of frontotemporal degeneration: the next therapeutic frontier). Alzheimer’s Dement. 9 189–198. 10.1016/j.jalz.2012.03.003 - DOI - PMC - PubMed
    1. Cash D. M., Frost C., Iheme L. O., Ünay D., Kandemir M., Fripp J., et al. (2015). Assessing atrophy measurement techniques in dementia: results from the MIRIAD atrophy challenge. Neuroimage 123 149–164. 10.1016/j.neuroimage.2015.07.087 - DOI - PMC - PubMed
    1. Cohen J. (1988). Statistical Power Anaylsis for the Behavioural Science, 2nd Edn Hillsdale, NJ: Lawrence Erlbaum.

LinkOut - more resources