. 2019 Jul 5:13:297.
doi: 10.3389/fncel.2019.00297. eCollection 2019.

PARK2 Mutation Causes Metabolic Disturbances and Impaired Survival of Human iPSC-Derived Neurons

Affiliations

PARK2 Mutation Causes Metabolic Disturbances and Impaired Survival of Human iPSC-Derived Neurons

Helle Bogetofte et al. Front Cell Neurosci. .

Abstract

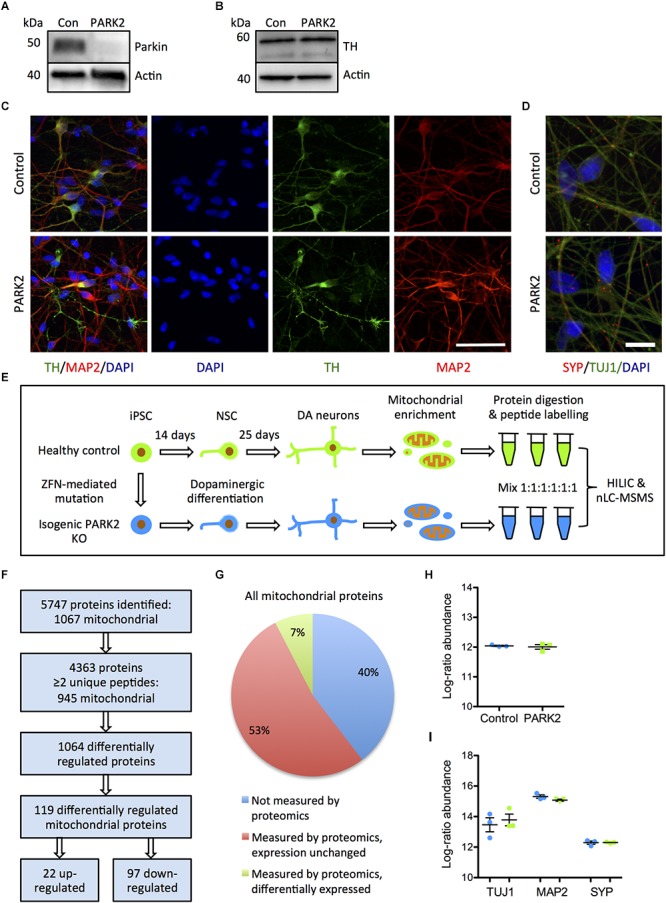
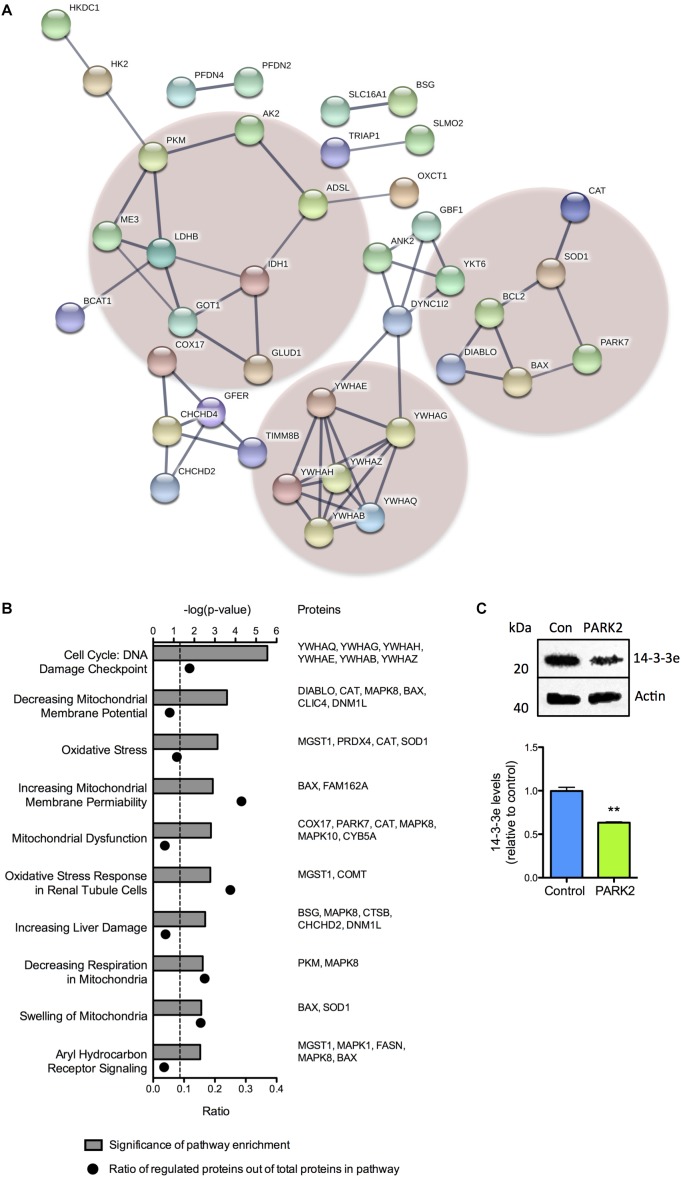
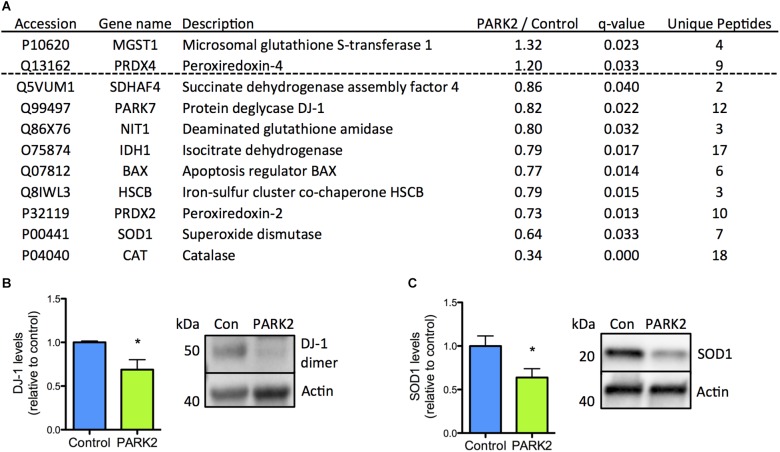
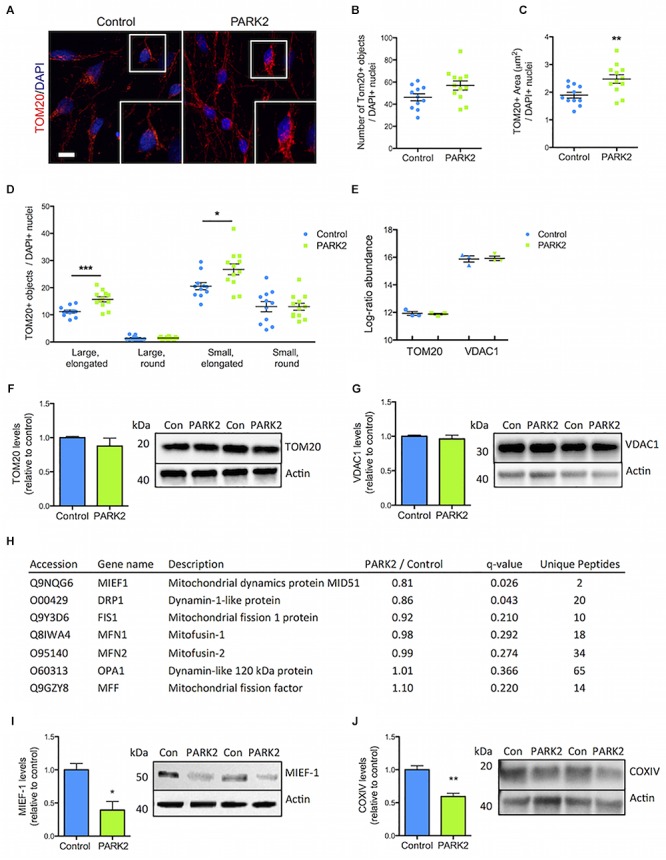
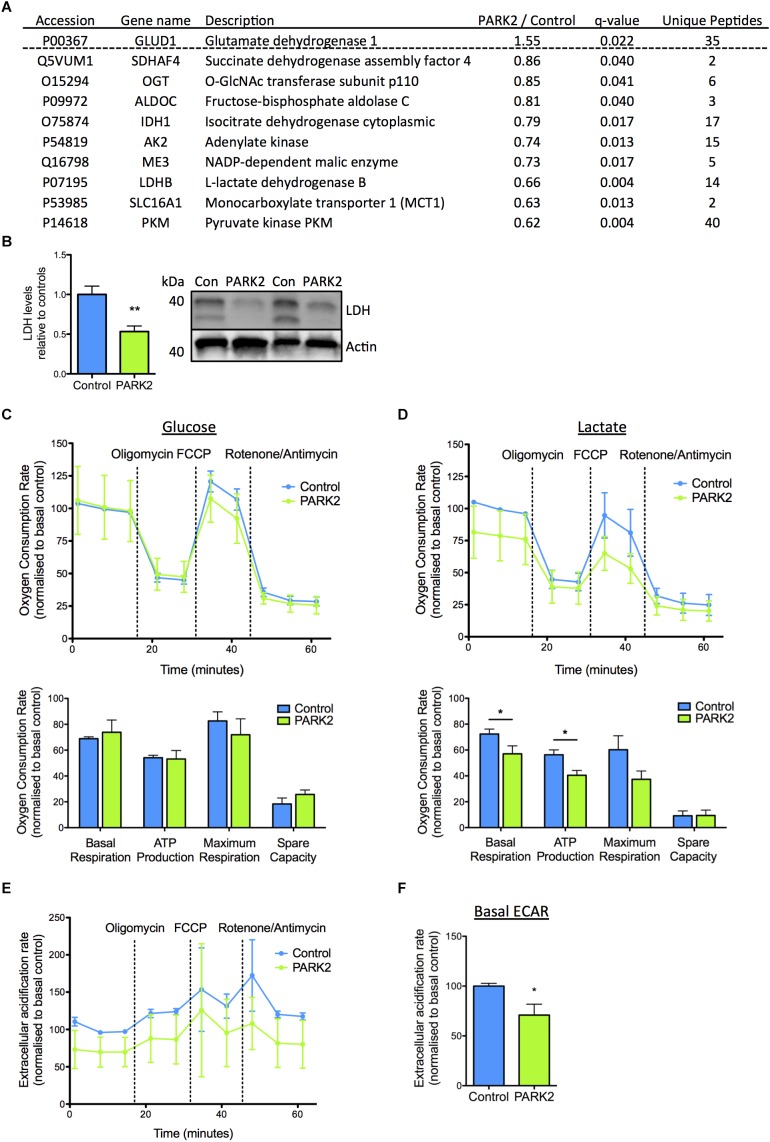
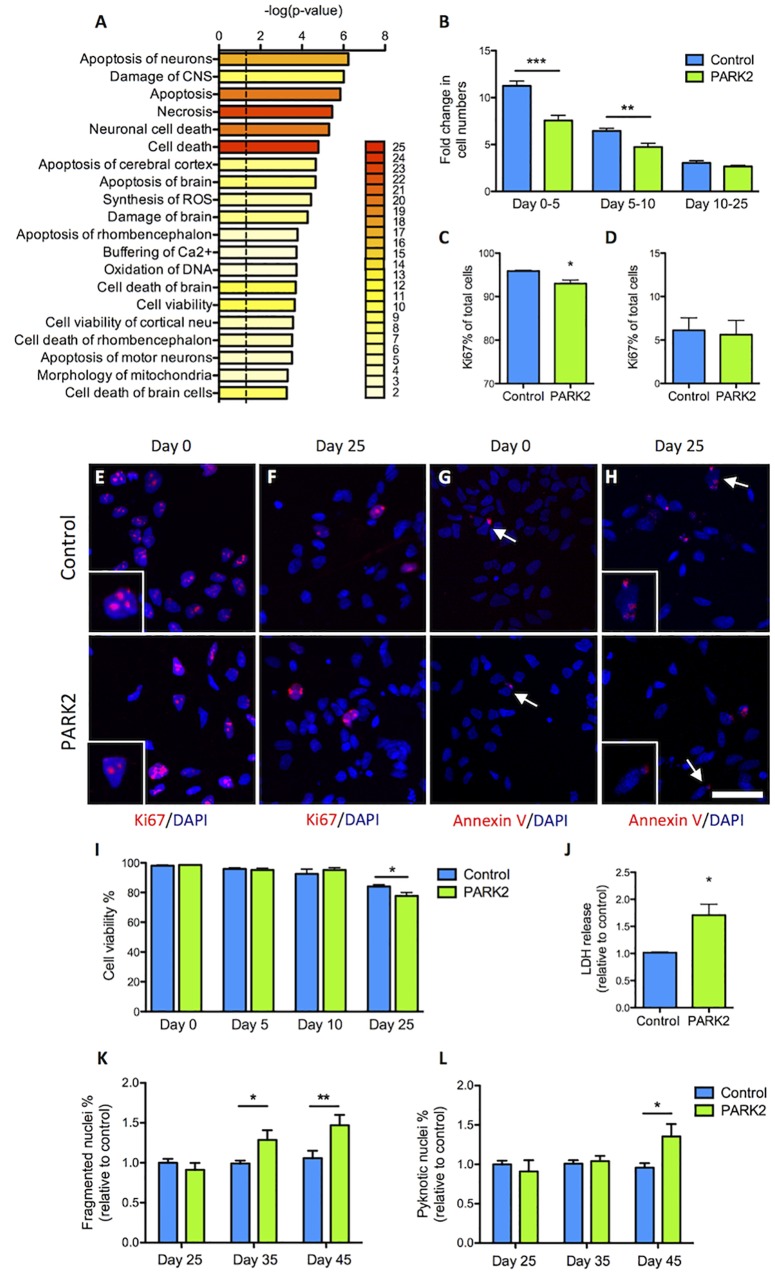
The protein parkin, encoded by the PARK2 gene, is vital for mitochondrial homeostasis, and although it has been implicated in Parkinson's disease (PD), the disease mechanisms remain unclear. We have applied mass spectrometry-based proteomics to investigate the effects of parkin dysfunction on the mitochondrial proteome in human isogenic induced pluripotent stem cell-derived neurons with and without PARK2 knockout (KO). The proteomic analysis quantified nearly 60% of all mitochondrial proteins, 119 of which were dysregulated in neurons with PARK2 KO. The protein changes indicated disturbances in oxidative stress defense, mitochondrial respiration and morphology, cell cycle control, and cell viability. Structural and functional analyses revealed an increase in mitochondrial area and the presence of elongated mitochondria as well as impaired glycolysis and lactate-supported respiration, leading to an impaired cell survival in PARK2 KO neurons. This adds valuable insight into the effect of parkin dysfunction in human neurons and provides knowledge of disease-related pathways that can potentially be targeted for therapeutic intervention.

Keywords: Parkinson’s; metabolism; mitochondria; oxidative stress; proteomics; survival.


Figures

FIGURE 1
FIGURE 1
Proteomic analysis of mitochondrial changes in PARK2 knockout (KO)-induced pluripotent stem cell (iPSC)-derived neurons. (A,B) Western blotting for (A) parkin protein verifying the PARK2 KO and (B) tyrosine hydroxylase (TH) indicating comparable dopaminergic (DA) differentiation. (C) Immunofluorescence staining of control and PARK2 KO neurons on differentiation day 25 showed no differences in levels of TH (green) and microtubule-associated protein 2 (MAP2, red) positive neurons. Scale bar = 50 μm. (D) Immunofluorescence staining for synaptophysin (SYP) and β-III-tubulin (TUJ1) confirmed the presence of mature PARK2 KO and control neurons. Scale bar = 25 μm. (E) Schematic illustration of the experimental set-up: PARK2 KO iPSCs created by zinc finger nucleases (ZFNs) and the isogenic healthy control iPSC line were differentiated to neural stem cells (NSCs) and onward to DA neurons. Mitochondrial enrichment was performed on cell lysates from three independent differentiations. Proteins were digested to peptides, which were labeled and mixed in 1:1:1:1:1:1 ratio prior to hydrophilic interaction liquid chromatography (HILIC) and nano-liquid chromatography tandem mass spectrometry analysis (nLC-MSMS). (F) Overview of the identified proteins: 945 mitochondrial proteins were identified by two or more peptides and levels of 119 of these were significantly altered in PARK2 KO neurons. (G) The analysis identified 60% of all mitochondrial proteins listed in the Gene Ontology (GO) Database (GO term: mitochondrion, organism: homo sapiens, type: protein), 7% of these were differentially expressed in PARK2 KO neurons. (H,I) The average proteomics-identified abundances (log ratio) of (H) all mitochondrial proteins as well as (I) the neuronal markers TUJ1, MAP2, and SYP were similar between control and PARK2 KO neurons. Mean ± SEM, n = 3 independent differentiations.
FIGURE 2
FIGURE 2
Cluster and pathway analysis of proteomic changes in PARK2 KO neurons. (A) STRING analysis on the 119 significantly dysregulated mitochondrial proteins identified by the proteomic analysis, revealed three clusters of proteins related to lactate–pyruvate metabolism (left cluster), oxidative stress (right cluster), and cell cycle regulation and cell death (lower cluster), respectively. Only connected nodes are shown. The line thickness indicates the strength of the supporting data. (B) Top toxicity-related pathways identified by ingenuity pathway analysis (IPA) of the significantly dysregulated mitochondrial proteins. Bar graphs indicate the enrichment level of each pathway shown as –log(P-value). The corresponding dots indicate the ratio of identified proteins out of the total number of proteins in the pathway. (C) Western blotting confirming a significant decrease in the level of 14-3-3𝜀 in PARK2 KO neurons. Protein expression levels were normalized to β-actin and shown relative to control neurons. Mean ± SEM, n = 3 technical replicates, data from three independent differentiations. ∗∗P < 0.01, Student’s T-test.
FIGURE 3
FIGURE 3
Confirmation of down-regulation of oxidative stress defense proteins identified by the proteomic analysis. (A) Table listing the proteins related to oxidative stress defense identified by the mitochondrial proteomic analysis with the ratio of protein levels in PARK2 KO neurons compared to controls; q-value (FDR-adjusted P-value) and number of unique peptides, n = 3 independent differentiations. (B,C) Western blotting confirmed a significant decrease in levels of (B) DJ-1 and (C) superoxide dismutase 1 (SOD1) in PARK2 KO neurons. Expression levels were normalized to β-actin and shown relative to control neurons. Mean ± SEM, n = 6 technical replicates, data from three independent differentiations. P < 0.05, Student’s T-test.
FIGURE 4
FIGURE 4
Perturbed mitochondrial morphology in PARK2 KO neurons. (A) TOM20 (red) immunofluorescence staining and (B,C) quantification in control and PARK2 KO neurons showed (B) unchanged numbers of TOM20+ objects and (C) significantly increased area of TOM20 staining when normalized to number of DAPI+ nuclei (blue). (D) The number of elongated mitochondria was significantly increased in PARK2 KO cells, whereas the number of round mitochondria was unchanged, when separating TOM20+ objects depending on size (small vs. large) and shape (round vs. elongated). Scale bar = 10 μm. Mean ± SEM, n = 11–12 technical replicates, data from four independent differentiations. (E) The average proteomics-identified abundance (log ratio) of TOM20 and VDAC1 was similar between control and PARK2 KO neurons. Mean ± SEM, n = 3 independent differentiations. (F,G) Western blotting showed no changes in (F) TOM20 and (G) VDAC1 levels. Protein expression levels were normalized to β-actin and shown relative to control neurons. Mean ± SEM, n = 4–10 technical replicates, data from three independent differentiations. (H) Table listing the proteins related to mitochondrial dynamics identified by the mitochondrial proteomic analysis with the ratio of protein levels in PARK2 KO neurons compared to controls; q-value (FDR-adjusted P-value) and number of unique peptides, n = 3 independent differentiations. (I,J) Western blotting showed a significant decrease in the levels of (I) MIEF1 and (J) COXIV in PARK2 KO neurons. Protein expression levels were normalized to β-actin and shown relative to control neurons. Mean ± SEM, n = 3–4 technical replicates, data from three independent differentiations. P < 0.05, ∗∗P < 0.01, ∗∗∗P < 0.005, Student’s T-test.
FIGURE 5
FIGURE 5
Functional changes in lactate metabolism in PARK2 KO neurons support protein changes revealed by proteomic analysis. (A) Table listing the mitochondrial proteins related to lactate–pyruvate metabolism identified by the proteomic analysis with the ratio of protein levels in PARK2 KO neurons compared to controls; q-value (FDR-adjusted P-value) and number of unique peptides, n = 3 independent differentiations. (B) Western blotting confirmed a significant decrease in levels of lactate dehydrogenase (LDH) in PARK2 KO neurons. Expression levels were normalized to β-actin and shown relative to control neurons. Mean ± SEM, n = 6 technical replicates, data from three independent differentiations. (C–F) Oxygen consumption rates (OCRs) and extracellular acidification rates (ECARs) of PARK2 KO and control neurons normalized to protein content illustrating basal respiration, the respiration coupled to mitochondrial ATP production after oligomycin treatment, maximal respiration after FCCP treatment, and non-mitochondrial respiration after rotenone/antimycin treatment. The spare respiratory activity is defined as the difference between the baseline and FCCP-induced maximal respiration. (C) PARK2 KO neurons had similar OCR when incubated in medium with 2.5 mM glucose and (D) significantly decreased basal respiration and ATP production in medium with 2.5 mM lactate. (E,F) Basal ECAR was significantly decreased in PARK2 KO neurons. Mean ± SEM, n = 3–9 technical replicates, data from three independent differentiations. P < 0.05, ∗∗P < 0.01, Student’s T-test.
FIGURE 6
FIGURE 6
Cell proliferation and survival is impeded in PARK2 KO neurons. (A) Pathway analysis on the differentially expressed proteins showing with bar graphs the enrichment score –log 10(P-value) and with color labeling the number of identified proteins belonging to each pathway. Only pathways with two or more proteins are shown. (B) Cell counts on differentiation days 0, 5, 10, and 25 from the NSC stage indicated that the fold change in cell numbers from days 0–5 and 5–10 was significantly lower in PARK2 KO cells compared to isogenic controls, whereas from days 10 to 25 there was no such difference between the lines. Mean ± SEM, n = 5–10 independent differentiations. (C,E) Quantification of immunofluorescence staining for Ki67+ (red) cells at differentiation day 0 revealed significantly lower levels of proliferation in PARK2 KO cultures. (D,F) At differentiation day 25, no difference in the relative content of Ki67+ cells was observed between PARK2 KO and control neurons. Mean ± SEM, N = 2 independent differentiations. (G,H) Immunofluorescence staining for Annexin V (red) on control and PARK2 KO cells on differentiation day 0 and day 25 identified very few apoptotic cells in both cell lines. Cell nuclei were stained with DAPI (blue). Scale bar = 50 μm. (I) Cell viability as measured by Trypan blue staining of cells in suspension at differentiation days 0, 5, 10, and 25 showed significantly decreased survival of PARK2 KO neurons at day 25. Mean ± SEM, N = 4 independent differentiations. (J) LDH release to the medium was increased in PARK2 KO cultures compared to isogenic controls at day 25. Data presented relative to average controls. Mean ± SEM, n = 3 independent differentiations. (K,L) Analysis of nuclear morphologies at differentiation days 25, 35, and 45 indicating the percentage of fragmented and pyknotic nuclei as a proportion of total cells per field of view. Mean ± SEM, N = 15–36 fields of view, data from two independent differentiations. P < 0.05, ∗∗P < 0.01, ∗∗∗P < 0.001, Student’s T-test.

References

    1. Abou-Sleiman P. M., Muqit M. M. K., Wood N. W. (2006). Expanding insights of mitochondrial dysfunction in Parkinson’s disease. Nat. Rev. Neurosci. 7 207–219. 10.1038/nrn1868 - DOI - PubMed
    1. Alam Z. I., Daniel S. E., Lees A. J., Marsden D. C., Jenner P., Halliwell B. (1997). A generalised increase in protein carbonyls in the brain in Parkinson’s but not incidental Lewy body disease. J. Neurochem. 69 1326–1329. 10.1046/j.1471-4159.1997.69031326.x - DOI - PubMed
    1. Aroso M., Ferreira R., Freitas A., Vitorino R., Gomez-Lazaro M. (2016). New insights on the mitochondrial proteome plasticity in Parkinson’s disease. Proteomics Clin. Appl. 10 416–429. 10.1002/prca.201500092 - DOI - PubMed
    1. Bender A., Krishnan K. J., Morris C. M., Taylor G. A., Reeve A. K., Perry R. H., et al. (2006). High levels of mitochondrial DNA deletions in substantia nigra neurons in aging and Parkinson disease. Nat. Genet. 38 515–517. 10.1038/ng1769 - DOI - PubMed
    1. Buhlman L., Damiano M., Bertolin G., Ferrando-Miguel R., Lombès A., Brice A., et al. (2014). Functional interplay between Parkin and Drp1 in mitochondrial fission and clearance. Biochim. Biophys. Acta 1843 2012–2026. 10.1016/j.bbamcr.2014.05.012 - DOI - PubMed