Stimulus-Specific Adaptation Decreases the Coupling of Spikes to LFP Phase
- PMID: 31333419
- PMCID: PMC6616079
- DOI: 10.3389/fncir.2019.00044
Stimulus-Specific Adaptation Decreases the Coupling of Spikes to LFP Phase
Abstract
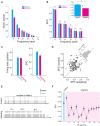
Stimulus repetition suppresses the neural activity in different sensory areas of the brain. This mechanism of so-called stimulus-specific adaptation (SSA) has been observed in both spiking activity and local field potential (LFP) responses. However, much remains to be known about the effect of SSA on the spike-LFP relation. In this study, we approached this issue by investigating the spike-phase coupling (SPC) in control and adapting paradigms. For the control paradigm, pure tones were presented in a random unbiased sequence. In the adapting paradigm, the same stimuli were presented in a random pattern but it was biased to an adapter stimulus. In fact, the adapter occupied 80% of the adapting sequence. During the tasks, LFP and multi-unit activity were recorded simultaneously from the primary auditory cortex of 15 anesthetized rats. To clarify the effect of adaptation on the relation between spike and LFP responses, the SPC of the adapter stimulus in these two paradigms was evaluated. Here, we employed phase locking value method for calculating the SPC. Our data show a strong coupling of spikes to LFP phase most prominently in beta band. This coupling was observed to decrease in the adapting condition compared to the control one. Importantly, we found that adaptation reduces spikes dominantly from the preferred phase of LFP in which spikes are more likely to be present there. As a result, the preferred phase of LFP may play a key role in coordinating neuronal spiking activity in neural adaptation mechanism. This finding is important for interpretation of the underlying neural mechanism of adaptation and also can be used in the context of the network and related connectivity models.
Keywords: local field potential (LFP); multi-unit activity (MUA); primary auditory cortex; spike-phase coupling (SPC); stimulus-specific adaptation.
Figures


Similar articles
-
Adaptation Modulates Spike-Phase Coupling Tuning Curve in the Rat Primary Auditory Cortex.Front Syst Neurosci. 2020 Aug 3;14:55. doi: 10.3389/fnsys.2020.00055. eCollection 2020. Front Syst Neurosci. 2020. PMID: 32848646 Free PMC article.
-
Phase Locking of Multiple Single Neurons to the Local Field Potential in Cat V1.J Neurosci. 2016 Feb 24;36(8):2494-502. doi: 10.1523/JNEUROSCI.2547-14.2016. J Neurosci. 2016. PMID: 26911695 Free PMC article.
-
The effect of adaptation on the tuning curves of rat auditory cortex.PLoS One. 2015 Feb 26;10(2):e0115621. doi: 10.1371/journal.pone.0115621. eCollection 2015. PLoS One. 2015. PMID: 25719404 Free PMC article.
-
Stimulus-specific adaptation (SSA) in the auditory system: Functional relevance and underlying mechanisms.Neurosci Biobehav Rev. 2023 Jun;149:105190. doi: 10.1016/j.neubiorev.2023.105190. Epub 2023 Apr 20. Neurosci Biobehav Rev. 2023. PMID: 37085022 Review.
-
Adaptive stimulus optimization for sensory systems neuroscience.Front Neural Circuits. 2013 Jun 6;7:101. doi: 10.3389/fncir.2013.00101. eCollection 2013. Front Neural Circuits. 2013. PMID: 23761737 Free PMC article. Review.
Cited by
-
Advancing brain-inspired computing with hybrid neural networks.Natl Sci Rev. 2024 Feb 26;11(5):nwae066. doi: 10.1093/nsr/nwae066. eCollection 2024 May. Natl Sci Rev. 2024. PMID: 38577666 Free PMC article. Review.
-
Machine learning-based high-frequency neuronal spike reconstruction from low-frequency and low-sampling-rate recordings.Nat Commun. 2024 Jan 20;15(1):635. doi: 10.1038/s41467-024-44794-2. Nat Commun. 2024. PMID: 38245509 Free PMC article.
-
Adaptation Modulates Spike-Phase Coupling Tuning Curve in the Rat Primary Auditory Cortex.Front Syst Neurosci. 2020 Aug 3;14:55. doi: 10.3389/fnsys.2020.00055. eCollection 2020. Front Syst Neurosci. 2020. PMID: 32848646 Free PMC article.
-
Task-specific modulation of PFC activity for matching-rule governed decision-making.Brain Struct Funct. 2021 Mar;226(2):443-455. doi: 10.1007/s00429-020-02191-7. Epub 2021 Jan 4. Brain Struct Funct. 2021. PMID: 33398431 Free PMC article.
-
Theta Phase Entrainment of Single-Cell Spiking in Rat Somatosensory Barrel Cortex and Secondary Visual Cortex Is Enhanced during Multisensory Discrimination Behavior.eNeuro. 2024 Apr 26;11(4):ENEURO.0180-23.2024. doi: 10.1523/ENEURO.0180-23.2024. Print 2024 Apr. eNeuro. 2024. PMID: 38621992 Free PMC article.
References
Publication types
MeSH terms
LinkOut - more resources
Full Text Sources
Research Materials

