. 2019 Jul 3:10:740.
doi: 10.3389/fphar.2019.00740. eCollection 2019.

Nrf2 Plays a Protective Role Against Intravascular Hemolysis-Mediated Acute Kidney Injury

Affiliations

Nrf2 Plays a Protective Role Against Intravascular Hemolysis-Mediated Acute Kidney Injury

Alfonso Rubio-Navarro et al. Front Pharmacol. .

Abstract

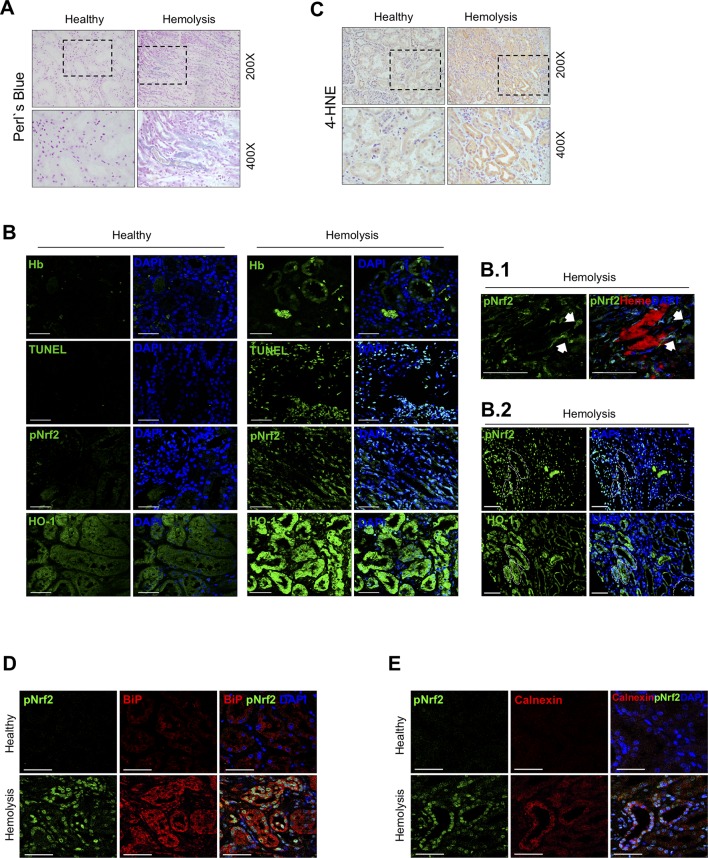
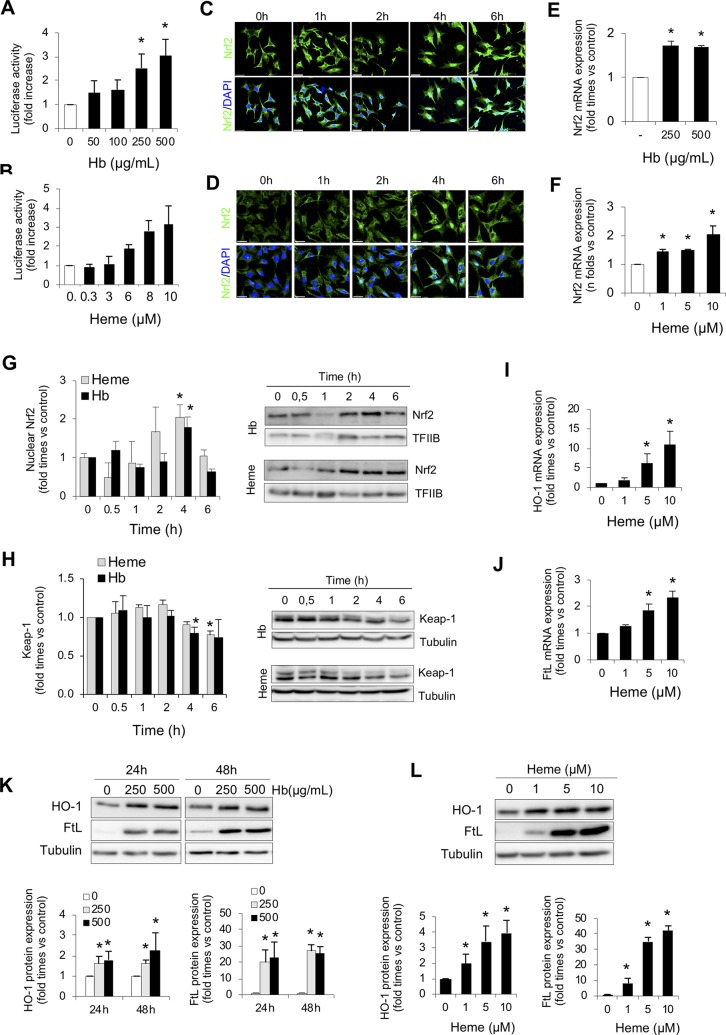
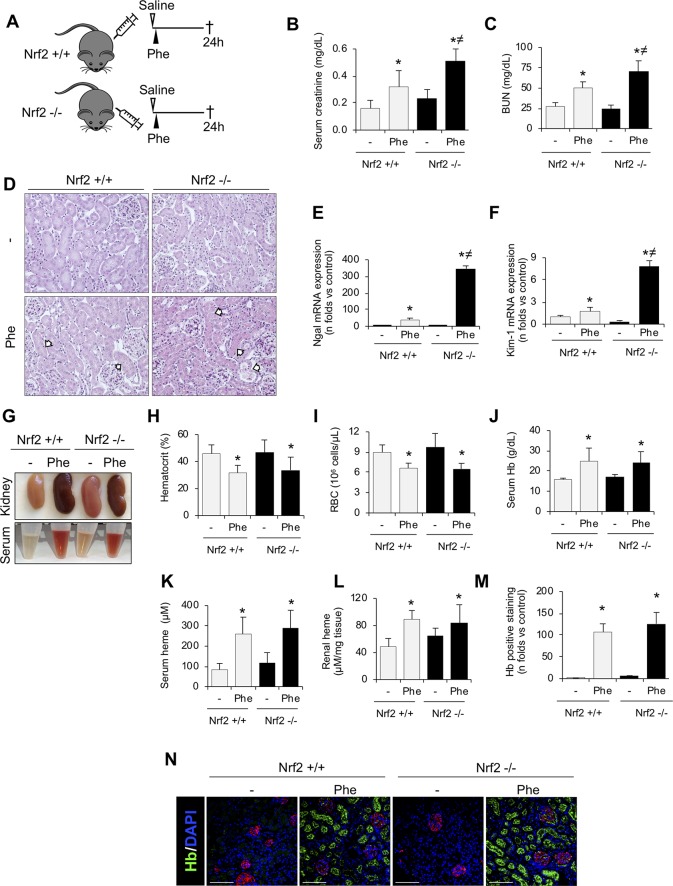
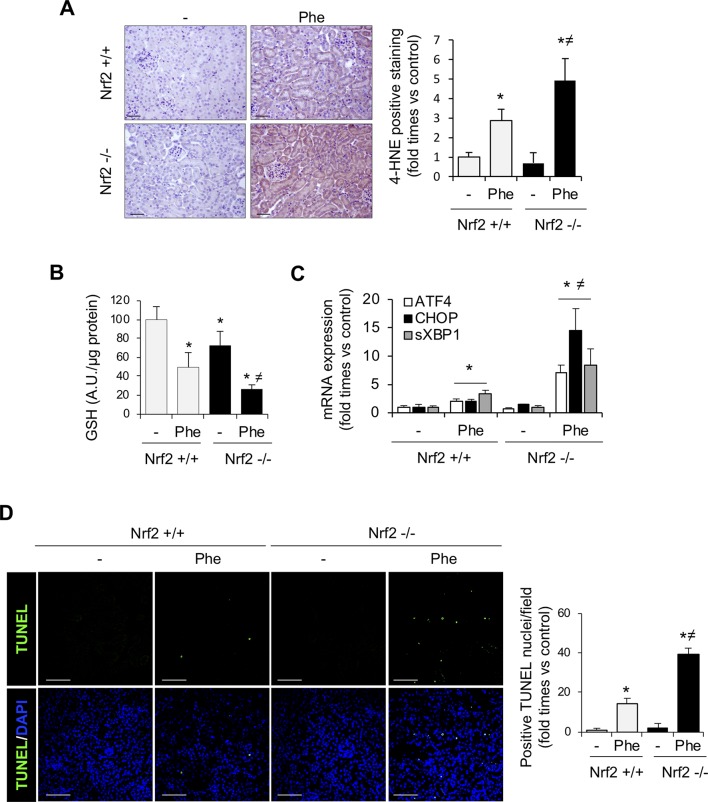
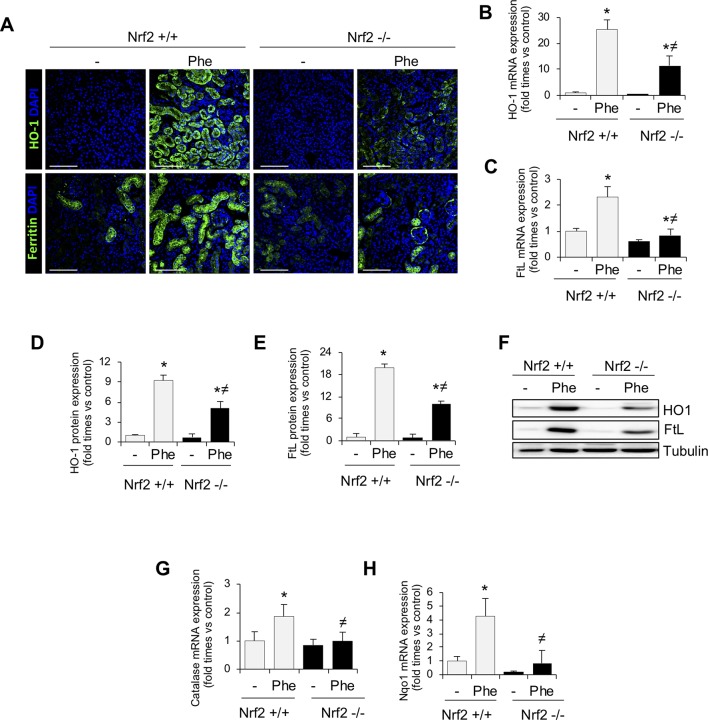
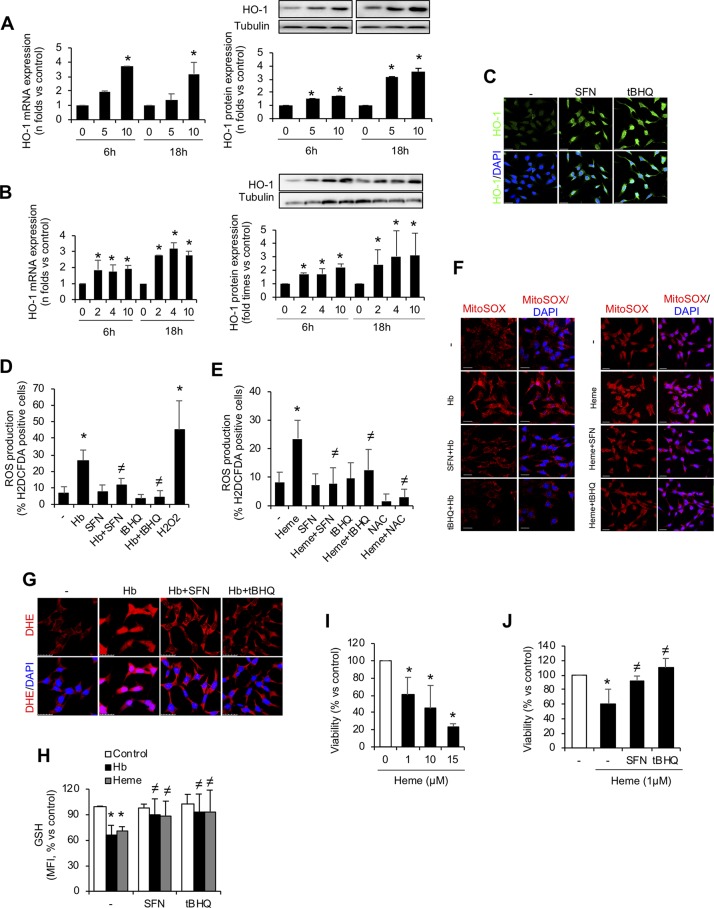
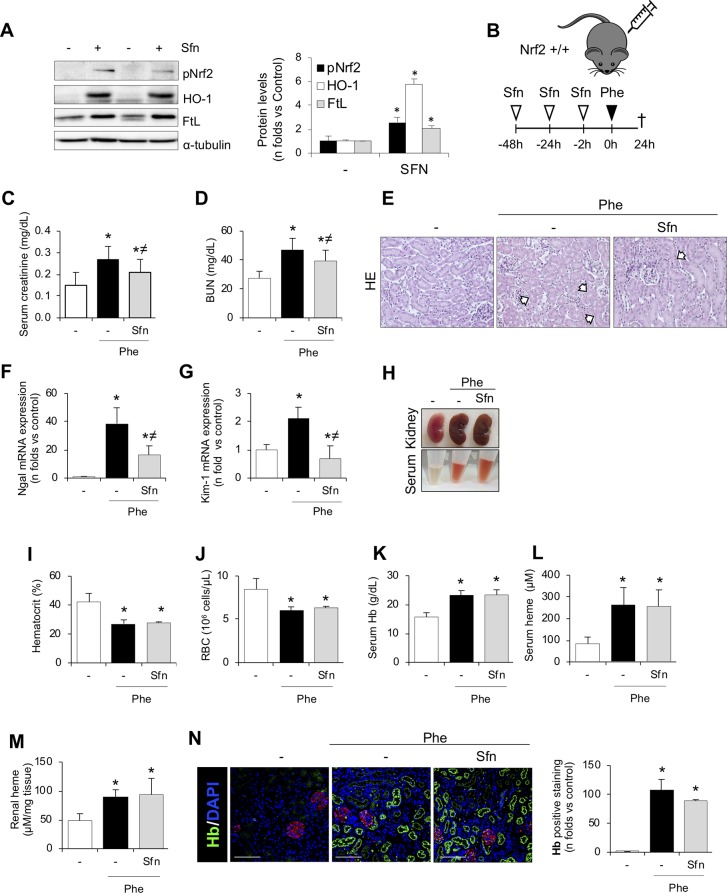
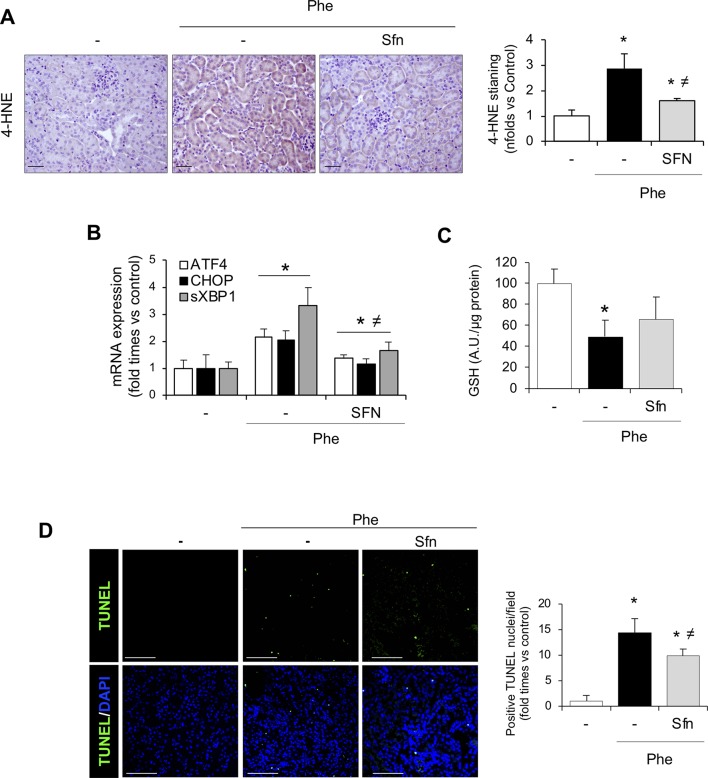
Massive intravascular hemolysis is associated with acute kidney injury (AKI). Nuclear factor erythroid-2-related factor 2 (Nrf2) plays a central role in the defense against oxidative stress by activating the expression of antioxidant proteins. We investigated the role of Nrf2 in intravascular hemolysis and whether Nrf2 activation protected against hemoglobin (Hb)/heme-mediated renal damage in vivo and in vitro. We observed renal Nrf2 activation in human hemolysis and in an experimental model of intravascular hemolysis promoted by phenylhydrazine intraperitoneal injection. In wild-type mice, Hb/heme released from intravascular hemolysis promoted AKI, resulting in decreased renal function, enhanced expression of tubular injury markers (KIM-1 and NGAL), oxidative and endoplasmic reticulum stress (ER), and cell death. These features were more severe in Nrf2-deficient mice, which showed decreased expression of Nrf2-related antioxidant enzymes, including heme oxygenase 1 (HO-1) and ferritin. Nrf2 activation with sulforaphane protected against Hb toxicity in mice and cultured tubular epithelial cells, ameliorating renal function and kidney injury and reducing cell stress and death. Nrf2 genotype or sulforaphane treatment did not influence the severity of hemolysis. In conclusion, our study identifies Nrf2 as a key molecule involved in protection against renal damage associated with hemolysis and opens novel therapeutic approaches to prevent renal damage in patients with severe hemolytic crisis. These findings provide new insights into novel aspects of Hb-mediated renal toxicity and may have important therapeutic implications for intravascular hemolysis-related diseases.

Keywords: Nrf2; heme; hemoglobin; intravascular hemolysis; oxidative stress; sulforaphane; tubular injury.


Figures

Figure 1
Figure 1
Nuclear factor erythroid-2-related factor 2 (Nrf2) activation in a patient with massive intravascular hemolysis-associated acute kidney injury (AKI). (A) Representative image of Perls’ Prussian blue staining showing iron accumulation in the renal biopsy of a patient with massive intravascular hemolysis as compared with healthy control (200× upper panel, 400× lower panel). (B) Representative confocal microscopy images showing Hb accumulation (green, first row), terminal deoxynucleotidyl transferase (TdT) dUTP nick-end labeling (TUNEL)-positive cells (green, second row), phospho-Nrf2 (green, third row), and HO-1 (green, fourth row). Nuclei were stained with 4′-6-diamidino-2-phenylindole (DAPI) (blue); scale bar, 100 µm. B.1. Representative confocal microscopy images showing the presence of heme cast (red) and nuclear phospho-Nrf2 (green); scale bar, 50 µm. B.2. Representative serial immunofluorescence images showing nuclear Nrf2 translocation (phospho-Nrf2, green) in HO-1-rich areas. White circles indicate similar regions in serial immunostained sections. Scale bar, 100 µm. (C) Representative image of 4-hydroxynonenal (4-HNE) staining (200× upper panel, 400× lower panel). Representative confocal microscopy images showing the presence of nuclear Nrf2 translocation (phospho-Nrf2, green) and the endoplasmic reticulum stress markers BiP (red, D) and calnexin (red, E). Scale bar, 50 µm.
Figure 2
Figure 2
Hemoglobin and heme promote Nrf2 activation in cultured renal cells. Nrf2 transcriptional activity was measured by a luciferase reporter assay in AREc32 cells treated with increasing concentrations of Hb (0–500 µg/ml, 0–30 µM heme equivalents) (A) or heme (0–10 µM) (B) for 24 h. Representative confocal microscopy images showing Nrf2 nuclear translocation (green) in murine tubular (MCT) cells after exposure to Hb (500 µg/ml, 30 µM heme equivalents) (C) or heme (1 µM) (D) at different times (0–6 h). Nuclei were stained with DAPI (blue). Nrf2 mRNA expression measured by real-time-quatitative polymerase chain reaction (RT-qPCR) in MCT cells treated with Hb (E) or heme (F) for 6 h. (G) Nuclear Nrf2 levels in MCT cells treated with Hb (500 µg/ml, 30 µM heme equivalents) and heme (1 µM) at different times (0–6 h). Representative western blot image from nuclear protein fraction. TFIIB (transcription factor II B) was used as loading control. (H) Keap1 protein content in MCT cells treated with Hb (500 µg/ml, 30 µM heme equivalents) and heme (1 µM) at different times (0–6 h). HO-1 (I) and FtL (J) mRNA expression measured by RT-qPCR in MCT cells treated with heme for 6 h. (K–L) Representative western blot image showing HO-1 and FtL expression in MCT cells treated with Hb (0–500 µg/ml, 0–30 µM heme equivalents) and heme (0–10 µM) for up to 48 h (upper panel). Quantification of HO-1 and FtL by western blot (lower panel). Results are expressed as mean ± SE. *p < 0.05 vs non-treated cells.
Figure 3
Figure 3
Nrf2 plays a protective role against kidney injury associated with intravascular hemolysis. C57BL/6 (Nrf2+/+) or Nrf2−/− mice (12 weeks old) were i.p. injected with saline (vehicle) or phenylhydrazine (Phe, 2 mg/10 g of body weight) to induce intravascular hemolysis (n = 8/group). (A) Schematic representation of intravascular hemolysis mouse model. Serum measurement of creatinine (B) and blood urea nitrogen (BUN) (C). (D) Representative images showing hematoxylin and eosin staining in kidneys from mice with intravascular hemolysis. Arrows indicate signs of acute tubular injury: presence of intratubular debris, pyknotic nuclei from apoptotic cells, tubular epithelial cells into the lumen, and loss of nuclei in the tubular epithelium. Expression of tubular injury biomarkers NGAL (E) and KIM-1 (F), as determined by real-time RT-qPCR, in kidneys from mice with intravascular hemolysis. (G) Representatives images showing kidneys (upper row) and serum (lower row) after intravascular hemolysis in both Nrf2+/+ and Nrf2−/− mice. Hematocrit (H), total red blood cell (RBC) counts (I), serum levels of Hb (J) and heme (K), and heme concentrations in renal tissue (L). (M) Semi-quantification of hemoglobin (Hb)-positive staining per renal cross section. (N) Representative images showing Hb (green) accumulation obtained by confocal microscopy. The podocyte marker nephrin (red) was used to delimitate the glomerular area. Nuclei were stained with DAPI (blue); scale bar, 100 µm. Results are expressed as mean ± SE. *p < 0.05 vs Nrf2+/+ control mice, p < 0.05 vs Nrf2+/+ Phe-injected mice.
Figure 4
Figure 4
Nrf2 protects against oxidative stress and cell death associated with intravascular hemolysis. C57BL/6 (Nrf2+/+) or Nrf2−/− mice (12 weeks old) were i.p. injected with saline (vehicle) or phenylhydrazine (Phe, 2 mg/10 g of body weight) to induce intravascular hemolysis (n = 8/group). (A) Representative image of 4-hydroxynonenal (4-HNE) staining. Semi-quantification of 4-HNE-positive staining per renal cross section. (B) GSH content in renal tissue. (C) ATF4, CHOP, and sXBP1 mRNA levels determined in kidney by real-time RT-qPCR. (D) Representative confocal microscopy images showing nuclear staining of TUNEL (green) (left panel). Nuclei were stained with DAPI (blue); scale bar, 100 µm. Semi-quantitative analysis of TUNEL-positive cells (right panel). Results are expressed as mean ± SE. *p < 0.05 vs Nrf2+/+ control mice, p < 0.05 vs Nrf2+/+ Phe-injected mice.
Figure 5
Figure 5
Nrf2-related proteins in kidney from mice with intravascular hemolysis. C57BL/6 (Nrf2+/+) or Nrf2−/− mice (12 weeks old) were i.p. injected with saline (vehicle) or phenylhydrazine (Phe, 2 mg/10 g of body weight) to induce intravascular hemolysis (n = 8/group). (A) Representative immunofluorescence images obtained by confocal microscopy showing expression of HO-1 (green, upper panel) and FtL (green, lower panel). Nuclei were stained with DAPI (blue); scale bar, 100 µm. HO-1 (B) and FtL (C) mRNA expression measured by RT-qPCR. Semi-quantification of HO-1 (D) and FtL (E) protein expression determined by western blot. (F) Representative western blot image of HO-1 amd FtL expression in kidneys from mice of the experimental model. Catalase (G) and NQO1 (H) mRNA expression measured by RT-qPCR. Results are expressed as mean ± SEM. *p < 0.05 vs Nrf2+/+ control mice, p < 0.05 vs Nrf2+/+ Phe-injected mice.
Figure 6
Figure 6
In vitro Nrf2 induction ameliorates oxidative stress and cell death. HO-1 mRNA and protein expression in MCT cells treated with the Nrf2 inducers tert-butylhydroquinone (tBHQ) (A) or sulforaphane (SFN) (B) at different concentrations (µM) for up to 18 h. (C) Representative confocal microscopy images showing HO-1 (green) staining in MCT cells pre-treated with Nrf2 inducers SFN and tBHQ with or without Hb. Nuclei were stained with DAPI (blue); scale bar, 20 µm. Quantification of ROS production (hydrogen peroxide) by flow cytometry with the fluorescent dye H2DCFDA in MCT cells stimulated with Hb (D) or heme (E) for 6 h. (F) Representative image of MitoSOX showing mitochondrial superoxide production by Hb (left panel) and heme (right panel) in cells pre-treated with SFN (2 µM) and tBHQ (1 µM) for 16 h. Nuclei were stained with DAPI (blue); scale bar, 20 µm. (G) Representative image of superoxide anion production determined by confocal microscopy using dihydroethidium (DHE) assay. Nuclei were stained with DAPI (blue); scale bar, 20 µm. (H) Intracellular GSH content in MCT cells treated with heme (1 µM) for 6 h with or without SFN (2 µM) or tBHQ (1 µM). (I–J) Cell viability determined in MCT cells stimulated with heme (1 µM) for 24 h and pre-treated with SFN (2 µM) or tBHQ (1 µM). Results are expressed as mean ± SEM. *p < 0.05 vs non-treated cells. p < 0.05 vs Hb or heme-treated cells.
Figure 7
Figure 7
SFN treatment ameliorates acute kidney injury and tubular damage induced by intravascular hemolysis. (A) C57BI/6 mice (males, 12 weeks old) were i.p. treated with saline or sulforaphane (SFN, 12.5 mg/kg) for 3 days (n = 5/group). Representative western blot image showing phospho-Nrf2 (Ser40), HO-1, and FtL protein expression. (B) C57BI/6 mice (males, 12 weeks old) were i.p. treated with saline or sulforaphane (SFN, 12.5 mg/kg) for 48, 24, and 2 h before phenylhydrazine (n = 5/group). Mice were sacrificed 24 h after phenylhydrazine administration. Schematic representation of intravascular hemolysis mouse model. Serum measurement of creatinine (C) and blood urea nitrogen (BUN) (D). Representative images showing hematoxylin and eosin staining (E). Expression of tubular injury biomarkers NGAL (F) and KIM-1(G), as determined by real-time RT-qPCR, in kidneys from mice with intravascular hemolysis. (H) Representatives images showing kidney and serum after intravascular hemolysis in mice treated with SFN. Hematocrit (I) and total red blood cell (RBC) counts (J). Serum levels of Hb (K) and heme (L). (M) Heme concentrations in renal tissue. (N) Representative images showing hemoglobin (Hb, green) accumulation obtained by confocal microscopy (left panel). The podocyte marker nephrin (red) was used to delimitate the glomerular area. Nuclei were stained with DAPI (blue); scale bar, 100 µm. Semi-quantification Hb-positive staining per cross section (right panel). Results are expressed as mean ± SEM. *p < 0.05 vs control mice, p < 0.05 vs Phe-injected mice.
Figure 8
Figure 8
Nrf2 activation pathway in kidney from SFN-treated mice. (A) Representative image of 4-HNE staining in the experimental model (left). Semi-quantification 4-HNE-positive staining per cross section (right). (B) ATF4, CHOP, and sXBP1 mRNA levels determined in kidney by real-time RT-qPCR. (C) GSH content in renal tissue. (D) Representative confocal microscopy images showing nuclear staining of TUNEL (green) (left) and semi-quantitative analysis of TUNEL-positive cells (right). Nuclei were stained with DAPI (blue); scale bar, 100 µm. Results are expressed as mean ± SEM. *p < 0.05 vs control mice, p < 0.05 vs Phe-injected mice.

Similar articles

  • New insights into the role of heme oxygenase-1 in acute kidney injury.
    Nath M, Agarwal A. Nath M, et al. Kidney Res Clin Pract. 2020 Dec 31;39(4):387-401. doi: 10.23876/j.krcp.20.091. Kidney Res Clin Pract. 2020. PMID: 33184238 Free PMC article. Review.
  • Podocytes are new cellular targets of haemoglobin-mediated renal damage.
    Rubio-Navarro A, Sanchez-Niño MD, Guerrero-Hue M, García-Caballero C, Gutiérrez E, Yuste C, Sevillano Á, Praga M, Egea J, Román E, Cannata P, Ortega R, Cortegano I, de Andrés B, Gaspar ML, Cadenas S, Ortiz A, Egido J, Moreno JA. Rubio-Navarro A, et al. J Pathol. 2018 Mar;244(3):296-310. doi: 10.1002/path.5011. Epub 2018 Jan 10. J Pathol. 2018. PMID: 29205354
  • Characterization of Renal Injury and Inflammation in an Experimental Model of Intravascular Hemolysis.
    Merle NS, Grunenwald A, Figueres ML, Chauvet S, Daugan M, Knockaert S, Robe-Rybkine T, Noe R, May O, Frimat M, Brinkman N, Gentinetta T, Miescher S, Houillier P, Legros V, Gonnet F, Blanc-Brude OP, Rabant M, Daniel R, Dimitrov JD, Roumenina LT. Merle NS, et al. Front Immunol. 2018 Mar 1;9:179. doi: 10.3389/fimmu.2018.00179. eCollection 2018. Front Immunol. 2018. PMID: 29545789 Free PMC article.
  • Nox4 is involved in acute kidney injury associated to intravascular hemolysis.
    García-Caballero C, Guerrero-Hue M, Vallejo-Mudarra M, Palomino Antolin A, Decouty-Pérez C, Sánchez-Mendoza LM, Villalba JM, González-Reyes JA, Opazo-Rios L, Vázquez-Carballo C, Herencia C, Leiva-Cepas F, Cortegano I, Andrés B, Egido J, Egea J, Moreno JA. García-Caballero C, et al. Free Radic Biol Med. 2024 Nov 20;225:430-444. doi: 10.1016/j.freeradbiomed.2024.10.283. Epub 2024 Oct 15. Free Radic Biol Med. 2024. PMID: 39413979
  • Protective Role of Nrf2 in Renal Disease.
    Guerrero-Hue M, Rayego-Mateos S, Vázquez-Carballo C, Palomino-Antolín A, García-Caballero C, Opazo-Rios L, Morgado-Pascual JL, Herencia C, Mas S, Ortiz A, Rubio-Navarro A, Egea J, Villalba JM, Egido J, Moreno JA. Guerrero-Hue M, et al. Antioxidants (Basel). 2020 Dec 31;10(1):39. doi: 10.3390/antiox10010039. Antioxidants (Basel). 2020. PMID: 33396350 Free PMC article. Review.

Cited by

References

    1. Baddam S., Aban I., Hilliard L., Howard T., Askenazi D., Lebensburger J. D. (2017). Acute kidney injury during a pediatric sickle cell vaso-occlusive pain crisis. Pediatr. Nephrol. 32 (8), 1451–1456. 10.1007/s00467-017-3623-6 - DOI - PMC - PubMed
    1. Balla G., Jacob H. S., Balla J., Rosenberg M., Nath K., Apple F., et al. (1992). Ferritin: a cytoprotective antioxidant strategem of endothelium. J. Biol. Chem. 267 (25), 18148–18153. - PubMed
    1. Balla J., Jacob H. S., Balla G., Nath K., Eaton J. W., Vercellotti G. M. (1993). Endothelial-cell heme uptake from heme proteins: induction of sensitization and desensitization to oxidant damage. Proc. Natl. Acad. Sci. U. S. A. 90 (20), 9285–9289. 10.1073/pnas.90.20.9285 - DOI - PMC - PubMed
    1. Ballarin J., Arce Y., Torra Balcells R., Diaz Encarnacion M., Manzarbeitia F., Ortiz A., et al. (2011). Acute renal failure associated to paroxysmal nocturnal haemoglobinuria leads to intratubular haemosiderin accumulation and CD163 expression. Nephrol. Dial. Transplant. 26 (10), 3408–3411. 10.1093/ndt/gfr391 - DOI - PubMed
    1. Bayrak O., Uz E., Bayrak R., Turgut F., Atmaca A. F., Sahin S., et al. (2008). Curcumin protects against ischemia/reperfusion injury in rat kidneys. World J. Urol. 26 (3), 285–291. 10.1007/s00345-008-0253-4 - DOI - PubMed