

Heterogeneity and Delayed Activation as Hallmarks of Self-Organization and Criticality in Excitable Tissue
- PMID: 31333504
- PMCID: PMC6624746
- DOI: 10.3389/fphys.2019.00869
Heterogeneity and Delayed Activation as Hallmarks of Self-Organization and Criticality in Excitable Tissue
Abstract
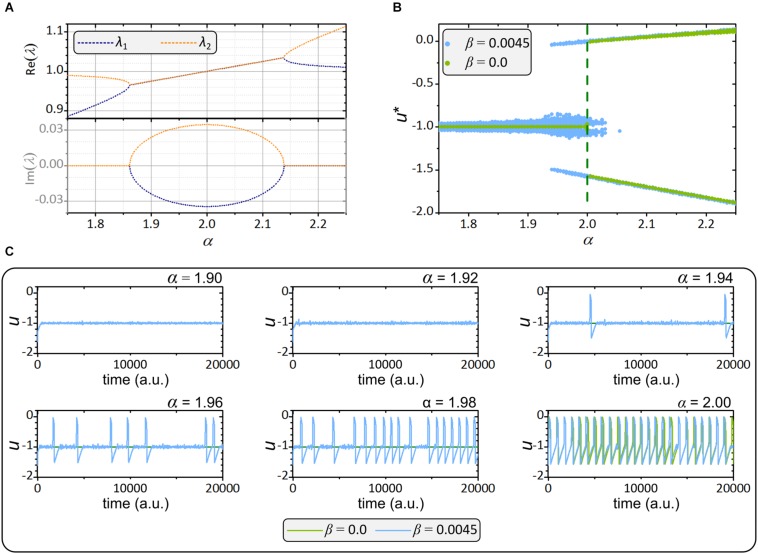
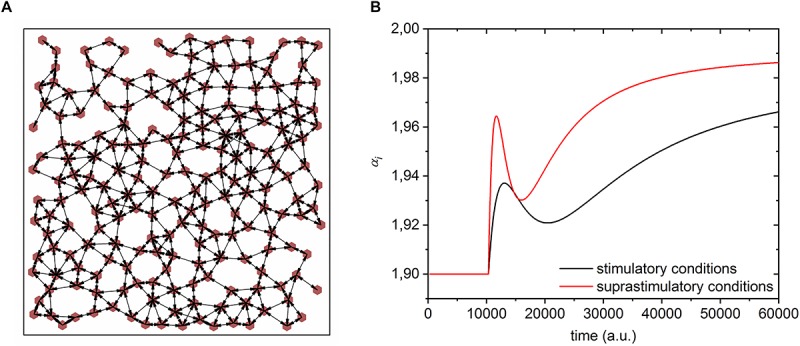
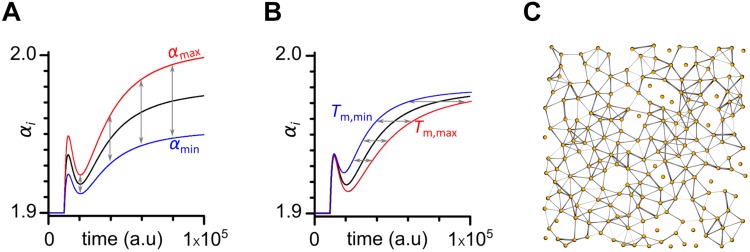
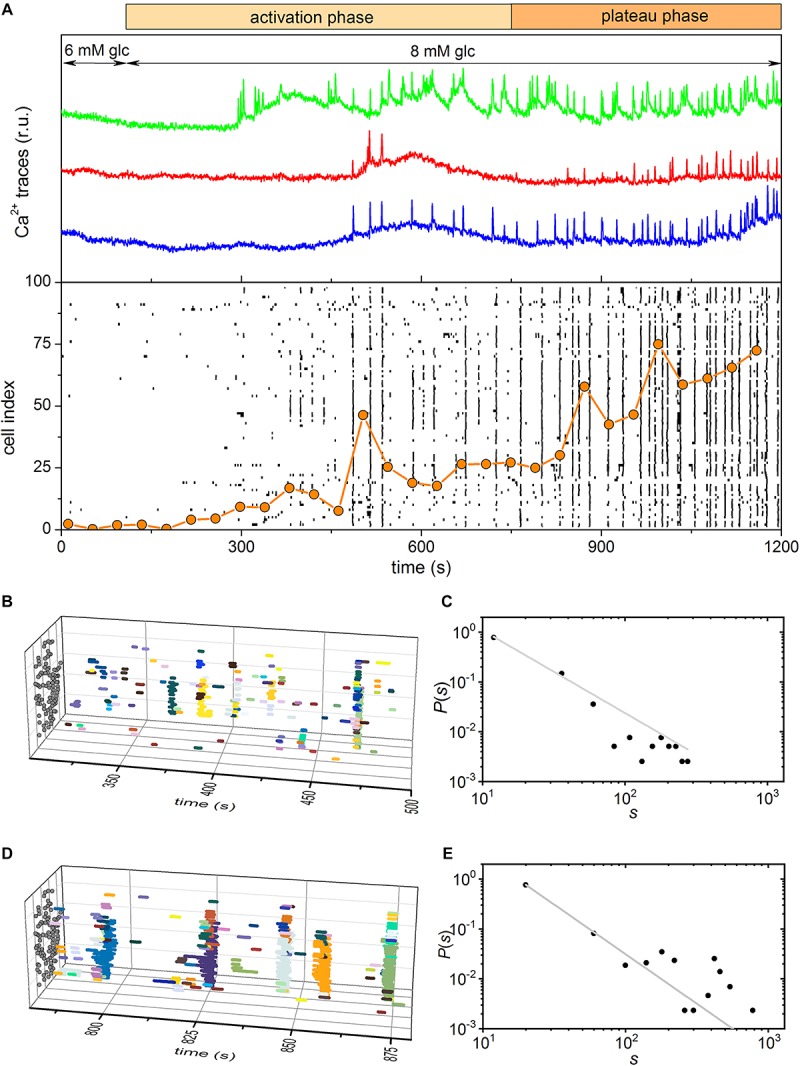
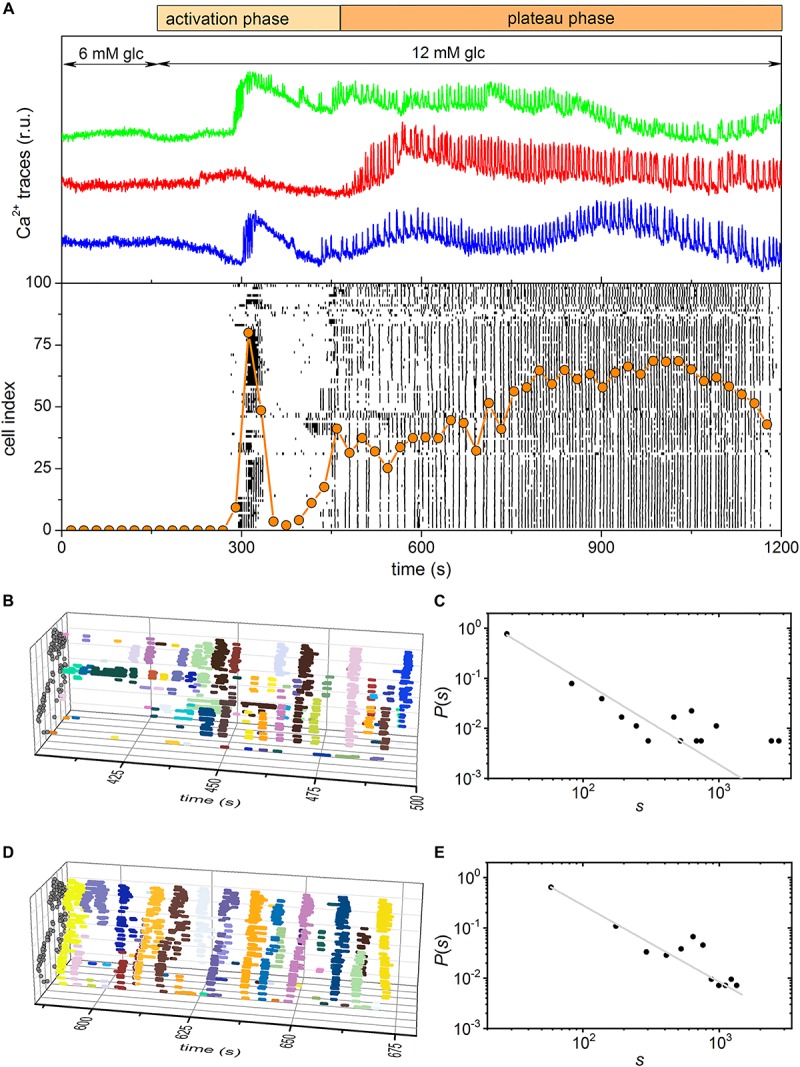
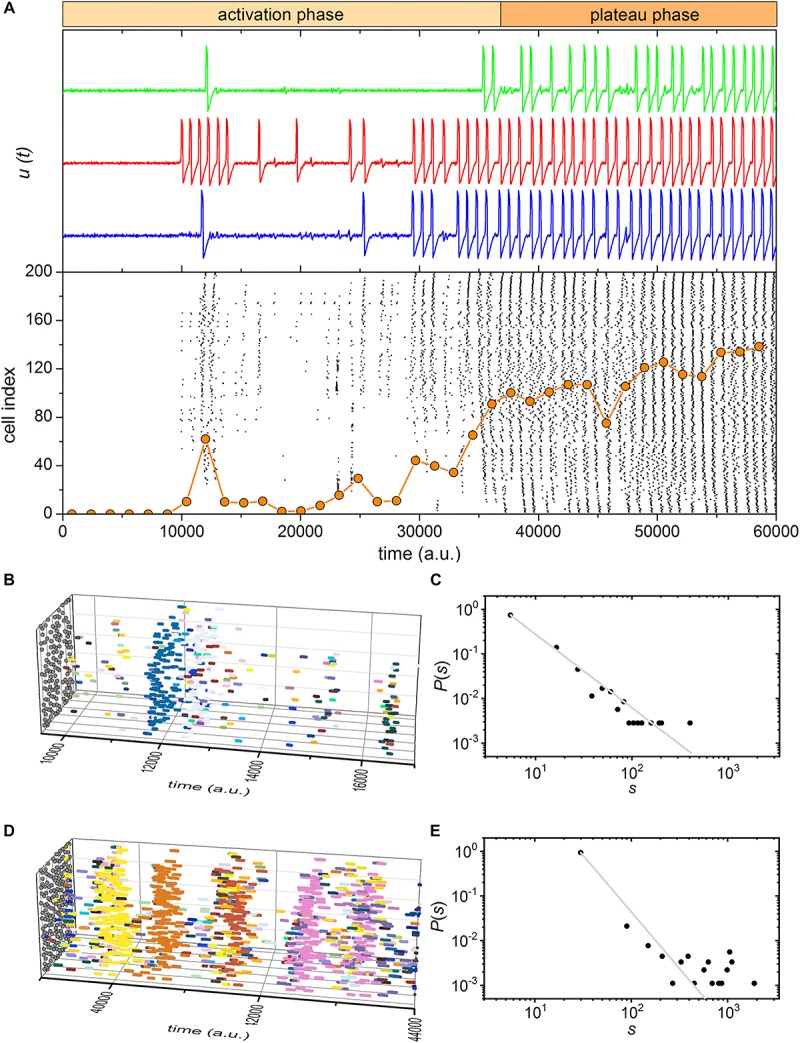
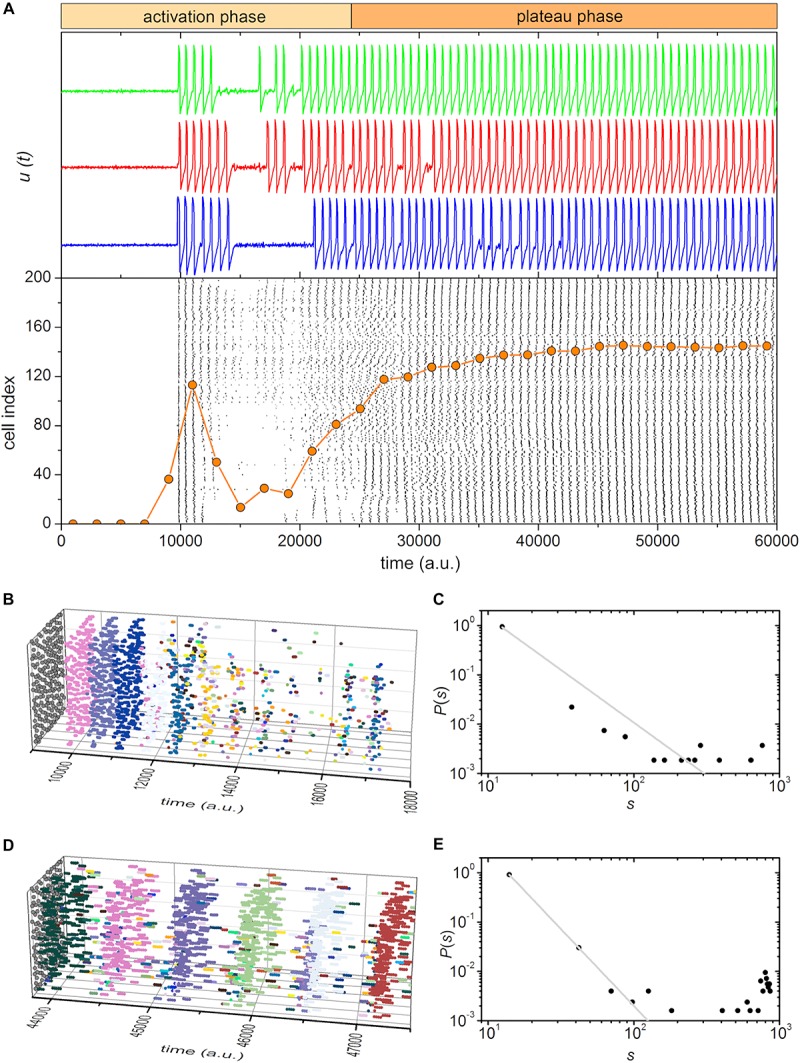
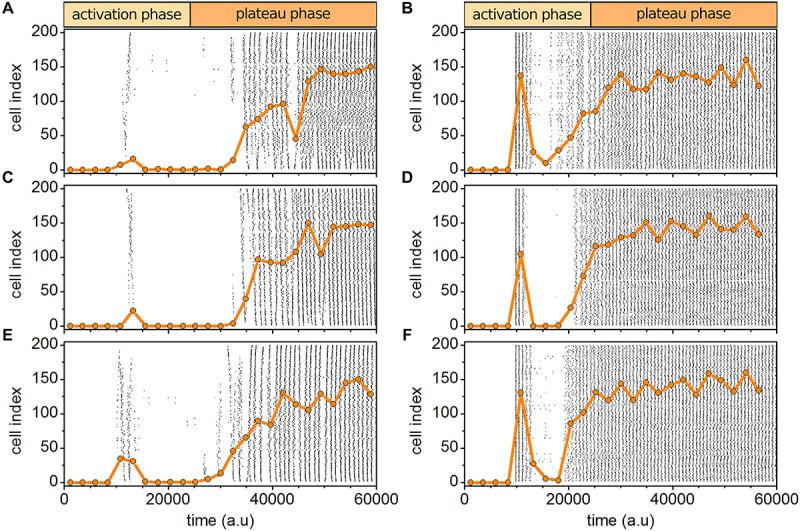
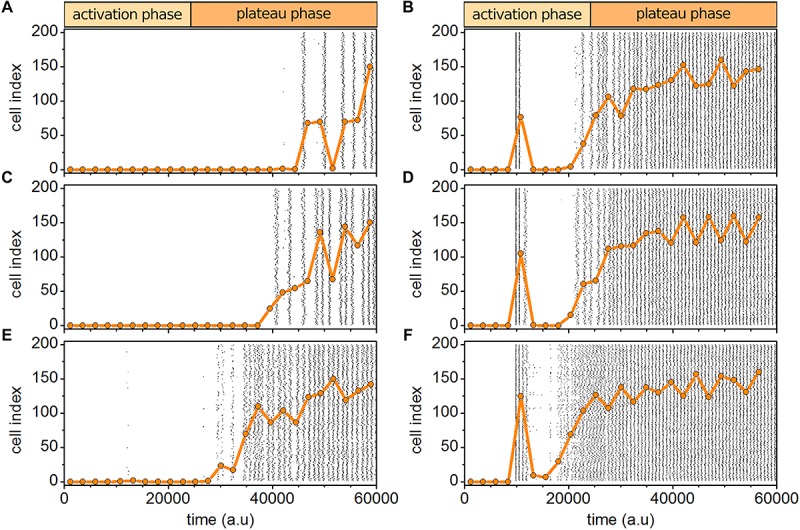
Self-organized critical dynamics is assumed to be an attractive mode of functioning for several real-life systems and entails an emergent activity in which the extent of observables follows a power-law distribution. The hallmarks of criticality have recently been observed in a plethora of biological systems, including beta cell populations within pancreatic islets of Langerhans. In the present study, we systematically explored the mechanisms that drive the critical and supercritical behavior in networks of coupled beta cells under different circumstances by means of experimental and computational approaches. Experimentally, we employed high-speed functional multicellular calcium imaging of fluorescently labeled acute mouse pancreas tissue slices to record calcium signals in a large number of beta cells simultaneously, and with a high spatiotemporal resolution. Our experimental results revealed that the cellular responses to stimulation with glucose are biphasic and glucose-dependent. Under physiological as well as under supraphysiological levels of stimulation, an initial activation phase was followed by a supercritical plateau phase with a high number of global intercellular calcium waves. However, the activation phase displayed fingerprints of critical behavior under lower stimulation levels, with a progressive recruitment of cells and a power-law distribution of calcium wave sizes. On the other hand, the activation phase provoked by pathophysiologically high glucose concentrations, differed considerably and was more rapid, less continuous, and supercritical. To gain a deeper insight into the experimentally observed complex dynamical patterns, we built up a phenomenological model of coupled excitable cells and explored empirically the model's necessities that ensured a good overlap between computational and experimental results. It turned out that such a good agreement between experimental and computational findings was attained when both heterogeneous and stimulus-dependent time lags, variability in excitability levels, as well as a heterogeneous cell-cell coupling were included into the model. Most importantly, since our phenomenological approach involved only a few parameters, it naturally lends itself not only for determining key mechanisms of self-organized criticality at the tissue level, but also points out various features for comprehensive and realistic modeling of different excitable systems in nature.
Keywords: activation delay; beta cells; calcium imaging; cellular heterogeneity; computational model; excitable cells; self-organized criticality.
Figures
Similar articles
-
Critical and Supercritical Spatiotemporal Calcium Dynamics in Beta Cells.Front Physiol. 2017 Dec 22;8:1106. doi: 10.3389/fphys.2017.01106. eCollection 2017. Front Physiol. 2017. PMID: 29312008 Free PMC article.
-
Macromolecular crowding: chemistry and physics meet biology (Ascona, Switzerland, 10-14 June 2012).Phys Biol. 2013 Aug;10(4):040301. doi: 10.1088/1478-3975/10/4/040301. Epub 2013 Aug 2. Phys Biol. 2013. PMID: 23912807
-
Glucose-dependent activation, activity, and deactivation of beta cell networks in acute mouse pancreas tissue slices.Am J Physiol Endocrinol Metab. 2021 Aug 1;321(2):E305-E323. doi: 10.1152/ajpendo.00043.2021. Epub 2021 Jul 19. Am J Physiol Endocrinol Metab. 2021. PMID: 34280052
-
In Vivo Observations of Rapid Scattered Light Changes Associated with Neurophysiological Activity.In: Frostig RD, editor. In Vivo Optical Imaging of Brain Function. 2nd edition. Boca Raton (FL): CRC Press/Taylor & Francis; 2009. Chapter 5. In: Frostig RD, editor. In Vivo Optical Imaging of Brain Function. 2nd edition. Boca Raton (FL): CRC Press/Taylor & Francis; 2009. Chapter 5. PMID: 26844322 Free Books & Documents. Review.
-
Folic acid supplementation and malaria susceptibility and severity among people taking antifolate antimalarial drugs in endemic areas.Cochrane Database Syst Rev. 2022 Feb 1;2(2022):CD014217. doi: 10.1002/14651858.CD014217. Cochrane Database Syst Rev. 2022. PMID: 36321557 Free PMC article.
Cited by
-
A primer on modelling pancreatic islets: from models of coupled β-cells to multicellular islet models.Islets. 2023 Dec 31;15(1):2231609. doi: 10.1080/19382014.2023.2231609. Islets. 2023. PMID: 37415423 Free PMC article. Review.
-
Ca2+ Oscillations, Waves, and Networks in Islets From Human Donors With and Without Type 2 Diabetes.Diabetes. 2022 Dec 1;71(12):2584-2596. doi: 10.2337/db22-0004. Diabetes. 2022. PMID: 36084321 Free PMC article.
-
β Cells Operate Collectively to Help Maintain Glucose Homeostasis.Biophys J. 2020 May 19;118(10):2588-2595. doi: 10.1016/j.bpj.2020.04.005. Epub 2020 Apr 15. Biophys J. 2020. PMID: 32353256 Free PMC article.
-
NMDA receptor inhibition increases, synchronizes, and stabilizes the collective pancreatic beta cell activity: Insights through multilayer network analysis.PLoS Comput Biol. 2021 May 11;17(5):e1009002. doi: 10.1371/journal.pcbi.1009002. eCollection 2021 May. PLoS Comput Biol. 2021. PMID: 33974632 Free PMC article.
-
The effects of beta-cell mass and function, intercellular coupling, and islet synchrony on [Formula: see text] dynamics.Sci Rep. 2021 May 13;11(1):10268. doi: 10.1038/s41598-021-89333-x. Sci Rep. 2021. PMID: 33986325 Free PMC article.
References
-
- Allegrini P., Paradisi P., Menicucci D., Laurino M., Piarulli A., Gemignani A. (2015). Self-organized dynamical complexity in human wakefulness and sleep: different critical brain-activity feedback for conscious and unconscious states. Phys. Rev. E 92 32808–32820. 10.1103/PhysRevE.92.032808 - DOI - PMC - PubMed
Grants and funding
LinkOut - more resources
Full Text Sources