. 2019 Jul 4:10:1540.
doi: 10.3389/fmicb.2019.01540. eCollection 2019.

Deciphering the Composition and Functional Profile of the Microbial Communities in Chinese Moutai Liquor Starters

Affiliations

Deciphering the Composition and Functional Profile of the Microbial Communities in Chinese Moutai Liquor Starters

Shu-Heng Gan et al. Front Microbiol. .

Abstract

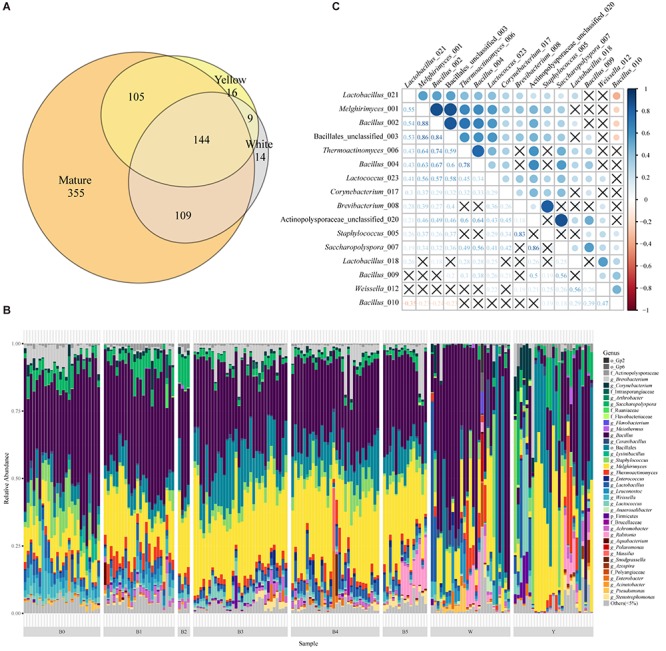
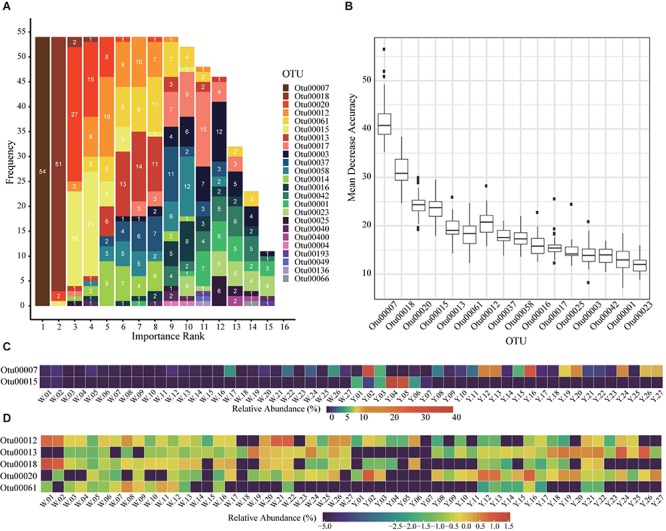
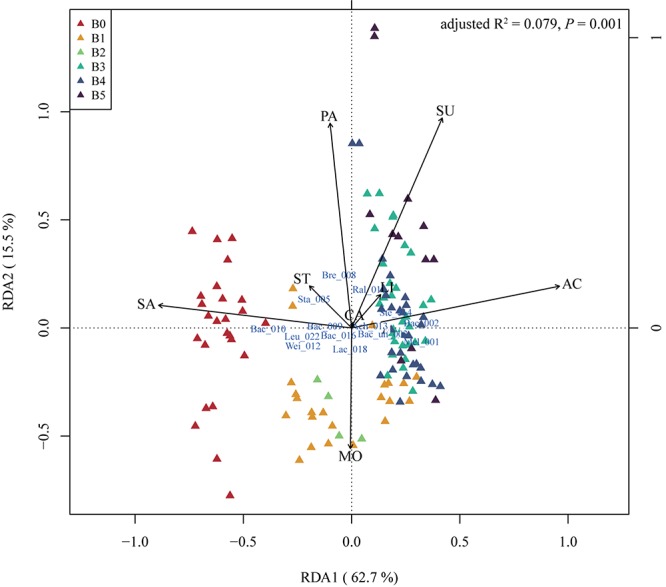
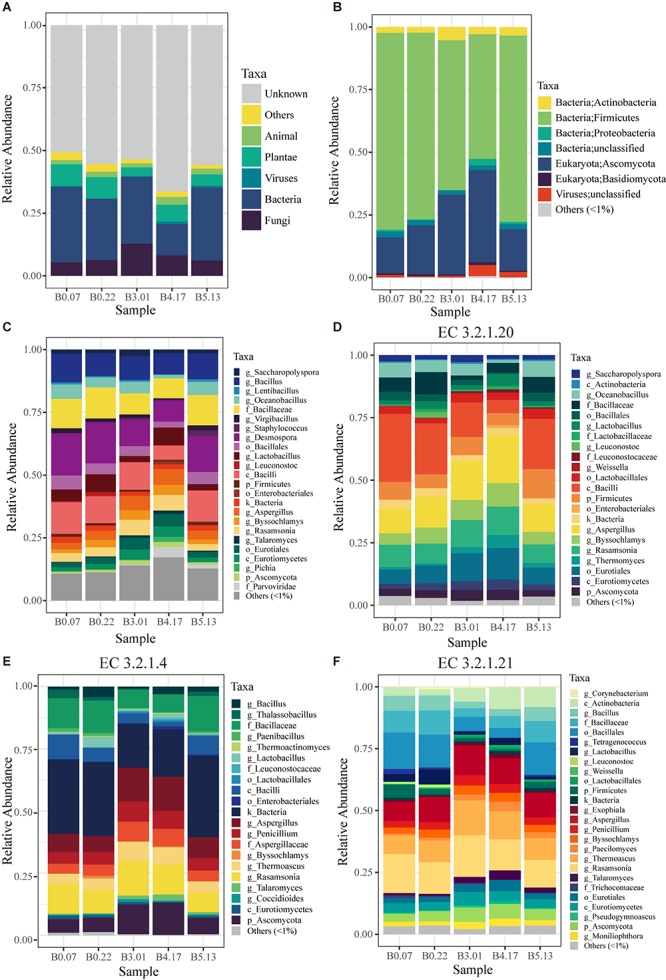
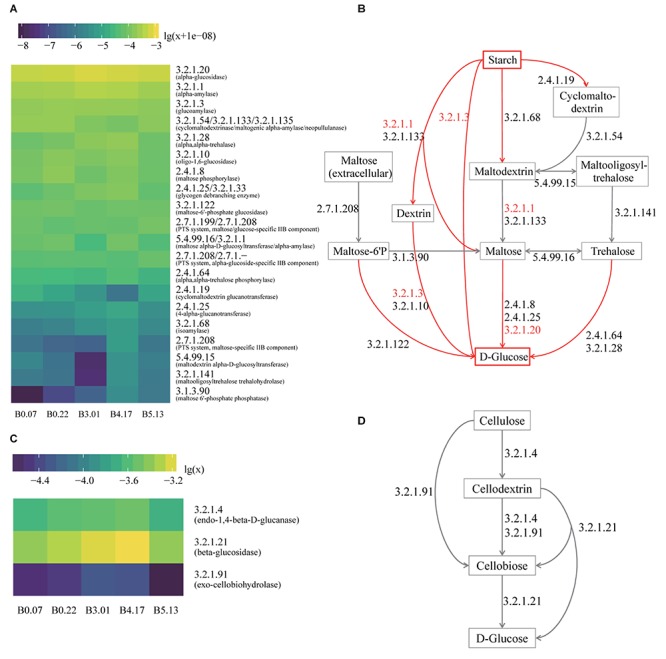
Moutai is a world-famous traditional Chinese liquor with complex taste and aroma, which are considered to be strongly influenced by the quality of fermentation starters (Daqu). However, the role of microbial communities in the starters has not been fully understood. In this study, we revealed the microbial composition of 185 Moutai starter samples, covering three different types of starters across immature and mature phases, and functional gene composition of mature starter microbiome. Our results showed that microbial composition patterns of immature starters varied, but they eventually were similar and steady when they became mature starters, after half-year storage and subsequent mixing. To help identify two types of immature starters, we selected seven operational taxonomic unit (OTU) markers by leave-one-out cross validation (LOOCV) and an OTU classified as Saccharopolyspora was the most decisive one. For mature starters, we identified a total of 16 core OTUs, one of which annotated as Bacillus was found positively associated with saccharifying power. We also identified the functional gene and microbial composition in starch and cellulose hydrolysis pathways. Microbes with higher abundances of alpha-glucosidase, alpha-amylase, and glucoamylase probably contributed to high saccharifying power. Overall, this study reveals the features of Moutai starter microbial communities in different phases and improves understanding of the relationships between microbiota and functional properties of the starters.

Keywords: 16S rRNA gene; Daqu; Moutai liquor; OTU; fermentation starter; immature starter; metagenomics; saccharifying power.


Figures

FIGURE 1
FIGURE 1
The taxonomic profile and important OTUs among Moutai starters (Daqu). (A) The Venn diagram of OTUs in yellow, white, and mature starters. (B) Taxonomic profile and the relative abundance of all 185 samples based on 16S rRNA metagenomic sequencing. Shown are the lowest taxonomic levels the OTUs can be annotated to, including phylum (p_), order (o_), family (f_), and genus (g_). “Others (<5%)” includes all taxa less than 5%. W and Y stand for white and yellow immature starters. B0 to B5 stands for six batches of mature starters. (C) The Spearman correlations between 16 core OTUs present in more than 95% mature starter samples (significance level is 0.05, P value is adjusted in the FDR method). The labels are composed of the taxa and the last three numbers of OTUs original names.
FIGURE 2
FIGURE 2
Seven marker OTUs selected with Leave-One-Out Cross Validation (LOOCV). (A) The rank of OTUs in LOOCV with random forest classifier. The labels are all feature OTUs in a total of 54 classifier. The x axis is the rank and the y axis is the frequency of each rank. The number in each bar is the frequency of each OTU in each rank. The OTUs with sum of numbers greater than 50 are identified as marker OTUs. (B) The mean decrease accuracy boxplot of OTUs in the 54 random forest classifiers for LOOCV. The present OTUs are used in more than 10 classifiers. (C,D) The relative abundance of the seven marker OTUs in 54 immature starters. (C) The relative abundances are percentages (x%). (D) The relative abundances are percentages transformed with formula log10 (relative abundance+1e-08).
FIGURE 3
FIGURE 3
The redundancy analysis (RDA) triplot of the 126 mature samples. Hellinger-transformed OTUs table, constrained by eight physical and chemical properties, including acidity (AC), reducing sugar (SU), moisture (MO), starch (ST), saccharification (SA), liquefaction (LI), protease activity (PA), and cellulase activity (CA). The labels of OTUs are composed of the first three letters of taxa and the last three number of OTUs original names, “un” means unclassified. As there are too many OTUs to present, only OTUs with (weighted) orthonormal species scores of RDA1 and RDA2 greater than 0.15 are plotted. “Mel” – Melghirimyces, “Bac” – Bacillus, “Bac_un” – Bacillales_unclassified, “Sta” – Staphylococcus, “Bre” – Brevibacterium, “Ral” – Ralstonia, “Wei” – Weissella, “Ach” – Achromobacter, “Ste” – Stenotrophomonas, “Lac” – Lactobacillus, and “Leu” – Leuconostoc. B0 to B5 stands for six batches of mature starters.
FIGURE 4
FIGURE 4
The taxonomic profiles of five mature samples based on metagenomic sequencing. (A) The profile of all data in kingdom level: “Unknown” means having no blast result in “nr” database; “Others” includes unclassified kingdom and protist. (B) The profile of microbial data (archaea, bacteria, fungi, and viruses) in phylum level: “unclassified” includes the data that have no annotation information in phylum level. (C) The profile of microbial data clustered by the lowest common level. (D) The microbial profile of alpha-glucosidase (EC 3.2.1.20) encoding genes grouped by the lowest annotation level. (E,F) The microbial profiles of enzyme encoding genes in cellulose hydrolysis, including endoglucanase (EC 3.2.1.4) and beta-glucosidase (EC 3.2.1.21). “Others (<1%)” includes all the taxonomic groups with relative abundance less than 1%.
FIGURE 5
FIGURE 5
The functional analysis of five mature samples based on metagenome annotation. (A) The heatmap of all genes annotated to the enzymes in the hydrolysis of starch to glucose. The values are decimal abundances transformed with the formula log10(relative abundance+1e-08) (the sum of relative abundances of total genes including other enzymes equals to 1). The labels of Y axis are the EC numbers and enzyme names within parentheses. (B) The hydrolysis pathway of starch to glucose. The red arrows are the actual process of liquefaction and saccharification, which are the hydrolysis of the starch and the production of the glucose. The EC numbers in red refer to the top three enzymes with high gene abundance. (C) The heatmap of all genes annotated to the enzymes in cellulose hydrolysis. The values are decimal abundances transformed with the formula log10(relative abundance). (D) The hydrolysis pathway of cellulose to glucose, which is the process in CA detection.

References

    1. Beaumont M. (2002). Flavouring composition prepared by fermentation with Bacillus spp. Int. J. Food Microbiol. 75 189–196. 10.1016/s0168-1605(01)00706-1 - DOI - PubMed
    1. Beller H. R., Han R., Karaoz U., Lim H., Brodie E. L. (2012). Genomic and physiological characterization of the chromate-reducing, aquifer-derived firmicute Pelosinus sp. strain HCF1. Appl. Environ. Microbiol. 79 63–73. 10.1128/AEM.02496-12 - DOI - PMC - PubMed
    1. Cai H., Zhang T., Zhang Q., Luo J., Cai C., Mao J. (2018). Microbial diversity and chemical analysis of the starters used in traditional Chinese sweet rice wine. Food Microbiol. 73 319–326. 10.1016/j.fm.2018.02.002 - DOI - PubMed
    1. Caporaso J. G., Kuczynski J., Stombaugh J., Bittinger K., Bushman F. D., Costello E. K., et al. (2010). QIIME allows analysis of high-throughput community sequencing data. Nat. Methods 7 335–336. - PMC - PubMed
    1. Caporaso J. G., Lauber C. L., Walters W. A., Berg-Lyons D., Lozupone C. A., Turnbaugh P. J., et al. (2011). Global patterns of 16S rRNA diversity at a depth of millions of sequences per sample. Proc. Natl. Acad. Sci. U.S.A. 108(Suppl. 1), 4516–4522. 10.1073/pnas.1000080107 - DOI - PMC - PubMed

LinkOut - more resources