

Marijuana use in U.S. teen drivers: a comparison of a road-side survey of reported use and fluid tests for tetrahydrocannabinol (THC)
- PMID: 31333991
- PMCID: PMC6616460
- DOI: 10.1186/s40621-019-0204-0
Marijuana use in U.S. teen drivers: a comparison of a road-side survey of reported use and fluid tests for tetrahydrocannabinol (THC)
Abstract
Background: Although the growth of state-level legalization of marijuana is aimed at increasing availability for adults and the chronically ill, one fear is that this trend may also increase accessibility in younger populations. The objectives of this study are to evaluate marijuana use in teen driver study participants and to compare their survey self-reported use with oral fluid and blood tests for psychoactive metabolites of tetrahydrocannabinol (THC).
Methods: The National Roadside Survey (NRS) of 2013-2014 was used to examine marijuana use in drivers aged 16-19 years. Of 11,100 drivers surveyed at 300 U.S. locations in 24 states, 718 were 16-19 years, and 666 (92.8%) provided oral fluid and/or blood. We examined weighted and unweighted data, but present unweighted findings. Kappa statistics, Chi square, and multivariable logistic regressions were used to assess agreement, associations and independent predictors of outcomes.
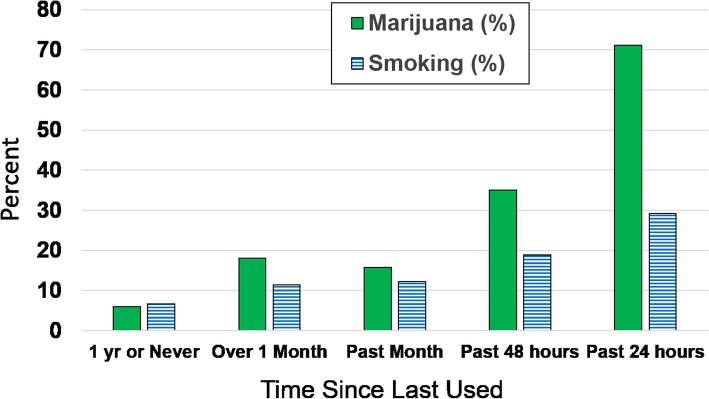
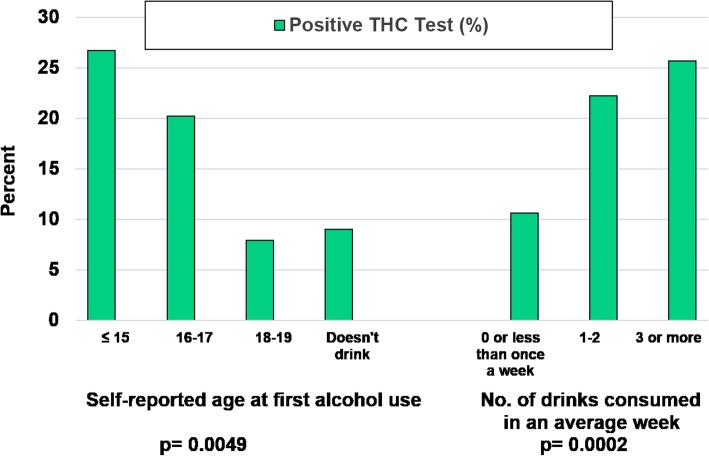
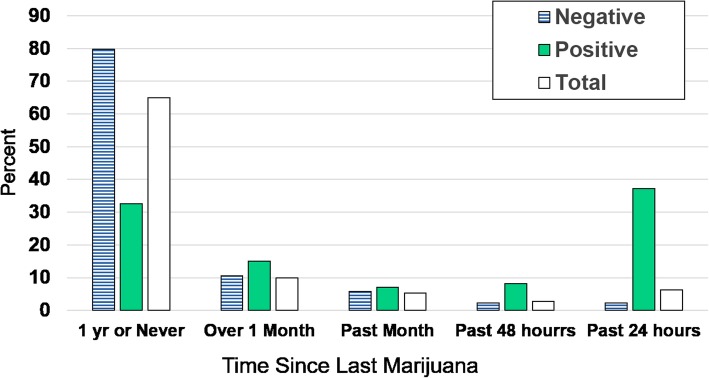
Results: More than one-quarter (203/718) of teen drivers reported either using marijuana in the last year or were THC positive. Overall incidence of a THC positive fluid test was 13.7%. In addition to 175 (27.3%) teen drivers who reported use in the last year, 28 (4.4%) who denied using in the past year, tested positive for THC. Of 45 teen drivers reporting use in the last 24 h, more than two-thirds (71.1%) were THC positive. Disagreement between the oral and blood test for 305 teen drivers who had both tests was 17 (5.6%), with a Kappa of 0.78 (95% CI 0.69-0.88). Of THC-positive drivers, nearly 20% started drinking alcohol by age 14 and more than 70% by age 16. Age, gender- and income-adjusted independent predictors of a positive THC test included survey completion during the school year (OR 3.2, 95% CI 1.6-6.2), survey-reported marijuana use in last year (OR 5.3, 95% CI 3.0-9.2), current smoker (OR 2.1, 95% CI 1.1-3.7), and alcohol consumption before age 16 (OR 2.3, 95% CI 1.1-3.7).
Conclusions: Although specific THC thresholds for safe driving have not been established, taken in the context of teen crash statistics, THC documented impairments and rapidly relaxing marijuana laws, these findings suggest the need for increased vigilance and stepped-up surveillance in teen drivers.
Keywords: Drivers; Impaired driving; Marijuana; National Roadside Survey (NRS); Surveillance; Teens; Tetrahydrocannabinol (THC).
Conflict of interest statement
Competing interestsThe authors declare that they have no competing interests.
Figures
Similar articles
-
Marijuana use and driving in Washington State: Risk perceptions and behaviors before and after implementation of retail sales.Traffic Inj Prev. 2019;20(1):23-29. doi: 10.1080/15389588.2018.1530769. Epub 2019 Mar 1. Traffic Inj Prev. 2019. PMID: 30822133
-
Validity of oral fluid test for Delta-9-tetrahydrocannabinol in drivers using the 2013 National Roadside Survey Data.Inj Epidemiol. 2018 Feb 19;5(1):3. doi: 10.1186/s40621-018-0134-2. Inj Epidemiol. 2018. PMID: 29457201 Free PMC article.
-
Comparison of teen and adult driver crash scenarios in a nationally representative sample of serious crashes.Accid Anal Prev. 2014 Nov;72:302-8. doi: 10.1016/j.aap.2014.07.016. Epub 2014 Aug 5. Accid Anal Prev. 2014. PMID: 25103321
-
Correlation between oral fluid and blood THC concentration: A systematic review and discussion of policy implications.Accid Anal Prev. 2022 Aug;173:106694. doi: 10.1016/j.aap.2022.106694. Epub 2022 May 26. Accid Anal Prev. 2022. PMID: 35640367
-
Establishing legal limits for driving under the influence of marijuana.Inj Epidemiol. 2014 Dec;1(1):26. doi: 10.1186/s40621-014-0026-z. Epub 2014 Oct 29. Inj Epidemiol. 2014. PMID: 27747660 Free PMC article. Review.
References
-
- Berning A, Compton R, Wochinger K. Results of the 2013–2014 National Roadside Survey of alcohol and drug use by drivers. Washington, DC: National Highway Traffic Safety Administration; 2015. - PubMed
-
- Center for Behavioral Health Statistics and Quality (CBHSQ) Behavioral Health Trends in the United States: Results from the 2014 National Survey on Drug Use and Health. Rockville: Substance Abuse and Mental Health Services Administration; 2015.
-
- Centers for Disease Control and Prevention (CDC), High School Youth Risk Behavior Survey Data, 2016. http://nccd.cdc.gov/youthonline/. Accessed 1 Oct 2018.
-
- Compton R. Marijuana-impaired driving - a report to congress. Washington, DC: National Highway Traffic Safety Administration; 2017.
Grants and funding
LinkOut - more resources
Full Text Sources
Miscellaneous
