. 2019 Sep;19(9):1075-1102.
doi: 10.1089/ast.2018.1903. Epub 2019 Jul 22.

Deciphering Biosignatures in Planetary Contexts

Affiliations

Deciphering Biosignatures in Planetary Contexts

Marjorie A Chan et al. Astrobiology. 2019 Sep.

Abstract

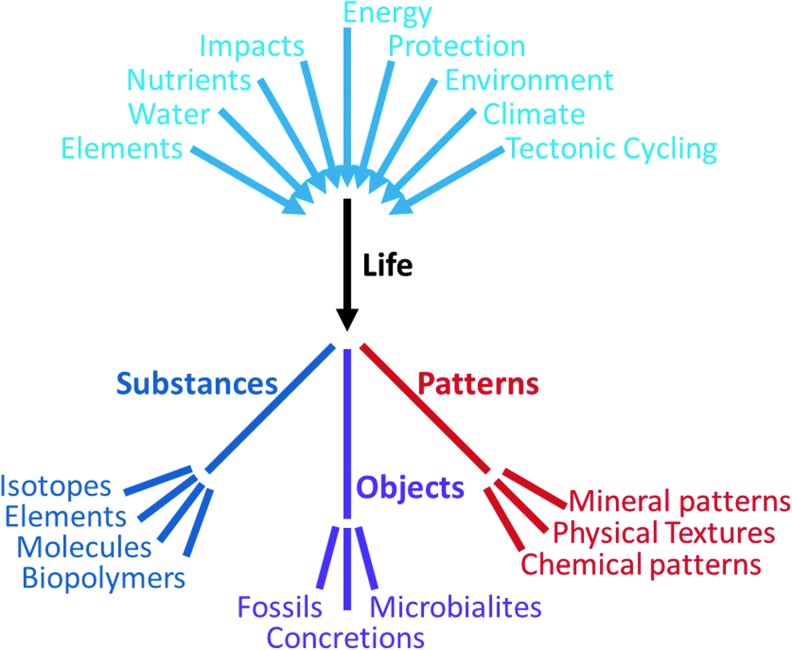
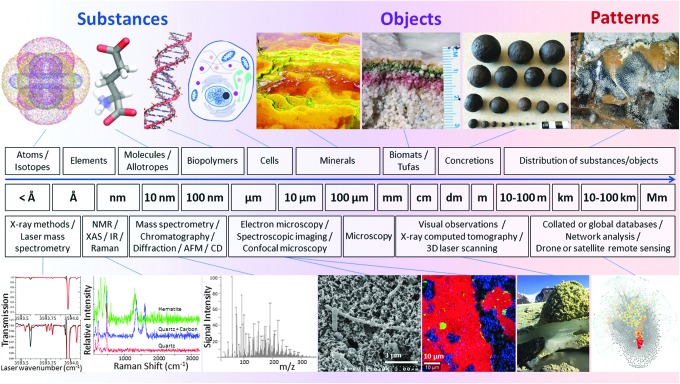
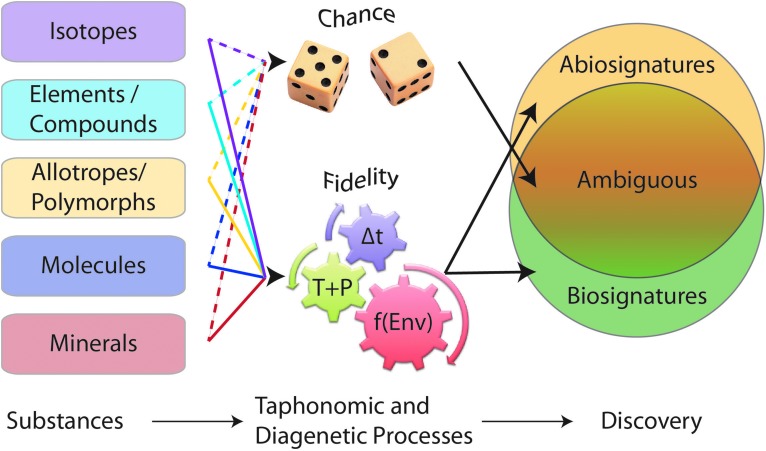
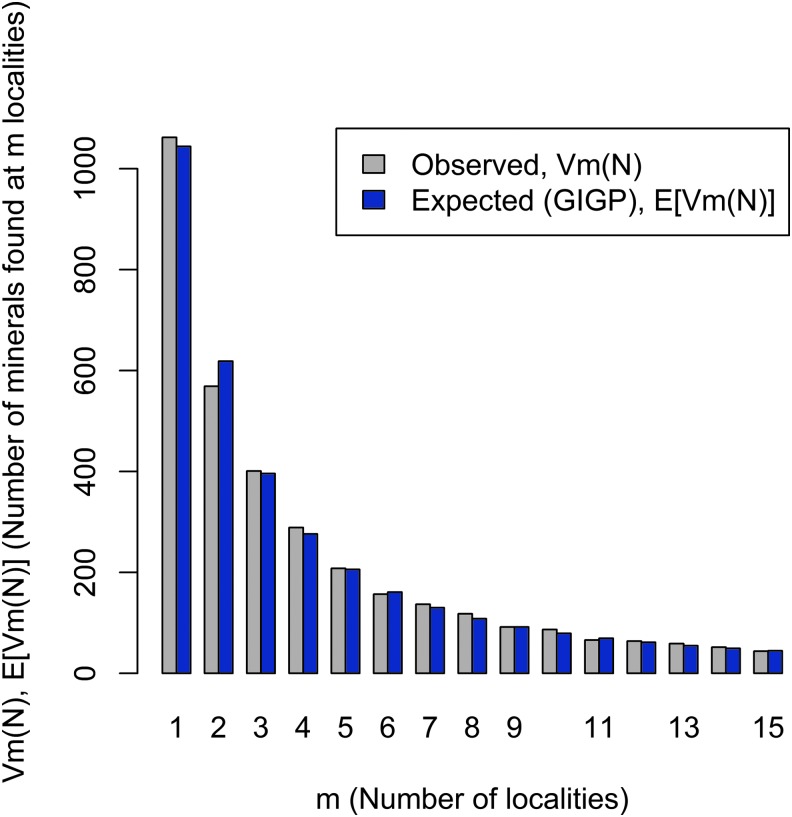
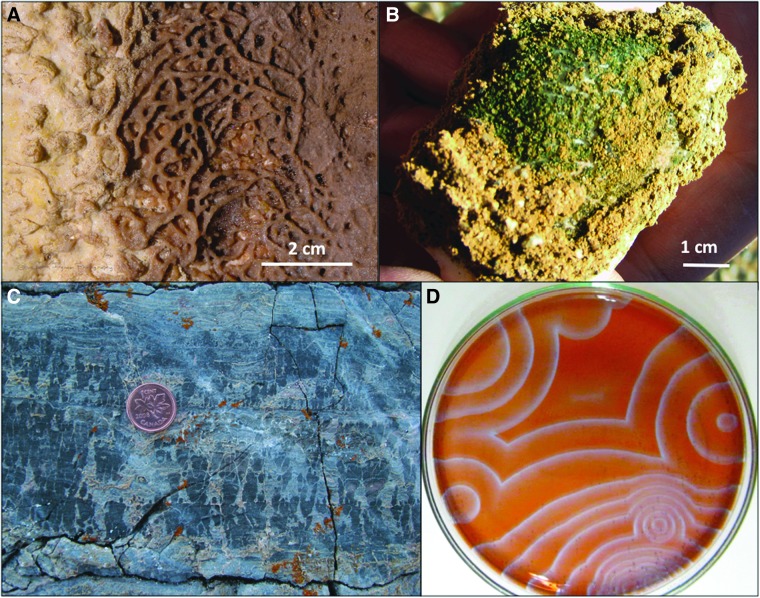
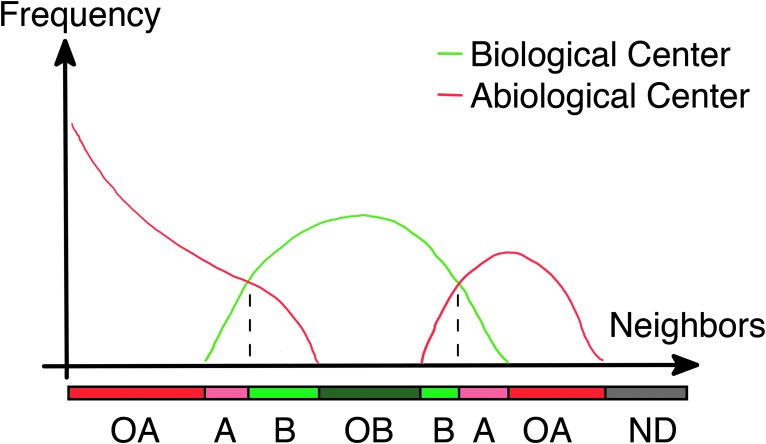
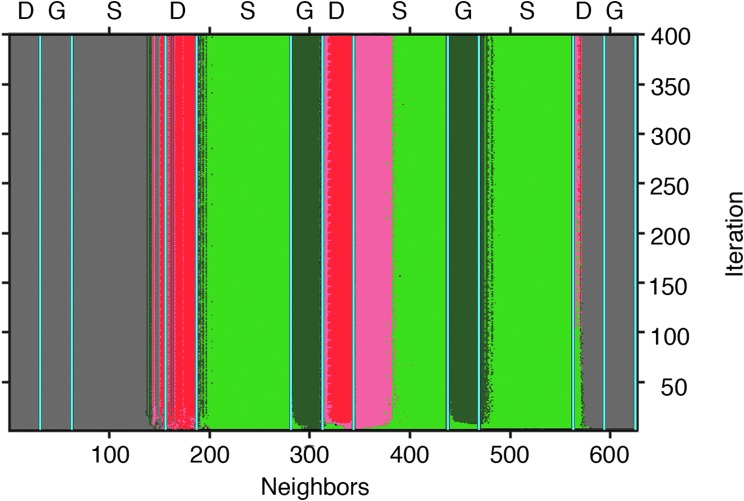
Microbial life permeates Earth's critical zone and has likely inhabited nearly all our planet's surface and near subsurface since before the beginning of the sedimentary rock record. Given the vast time that Earth has been teeming with life, do astrobiologists truly understand what geological features untouched by biological processes would look like? In the search for extraterrestrial life in the Universe, it is critical to determine what constitutes a biosignature across multiple scales, and how this compares with "abiosignatures" formed by nonliving processes. Developing standards for abiotic and biotic characteristics would provide quantitative metrics for comparison across different data types and observational time frames. The evidence for life detection falls into three categories of biosignatures: (1) substances, such as elemental abundances, isotopes, molecules, allotropes, enantiomers, minerals, and their associated properties; (2) objects that are physical features such as mats, fossils including trace-fossils and microbialites (stromatolites), and concretions; and (3) patterns, such as physical three-dimensional or conceptual n-dimensional relationships of physical or chemical phenomena, including patterns of intermolecular abundances of organic homologues, and patterns of stable isotopic abundances between and within compounds. Five key challenges that warrant future exploration by the astrobiology community include the following: (1) examining phenomena at the "right" spatial scales because biosignatures may elude us if not examined with the appropriate instrumentation or modeling approach at that specific scale; (2) identifying the precise context across multiple spatial and temporal scales to understand how tangible biosignatures may or may not be preserved; (3) increasing capability to mine big data sets to reveal relationships, for example, how Earth's mineral diversity may have evolved in conjunction with life; (4) leveraging cyberinfrastructure for data management of biosignature types, characteristics, and classifications; and (5) using three-dimensional to n-D representations of biotic and abiotic models overlain on multiple overlapping spatial and temporal relationships to provide new insights.

Keywords: Astrobiology; Biosignatures; Extraterrestrial life; Extremophile.; Taphonomy.


Conflict of interest statement

No competing financial interests exist.

Figures

<b>FIG. 1.</b>
FIG. 1.
Tree diagram of the relationship of variables affecting the formation and development of life, and the resulting biosignatures in the three categories of substances, objects, and patterns. These major components and products capture the current state of opinion in astrobiology. Within each category, there are challenges to identify and measure the type of biosignatures, evaluate the fluxes that may be relevant to enhancing life, understand the context of scales and relationships, and evaluate importance, applicability, and confidence in the signature.
<b>FIG. 2.</b>
FIG. 2.
Biosignatures and life detection methods range from microscopic (left) to planetary scales (right). A nested astrobiological approach will provide context for the physicochemical parameters and processes governing the preservation of biosignatures. Images created by R.J.G. using VMD software (Humphrey et al., 1996). Top row images: carbonate formation in Río Tinto (Fernández-Remolar et al., 2012); biomats (Des Marais, 2003); concretions (M.A.C.); and biovermiculation patterns, Cueva de Villa Luz, Tabasco, Mexico (P.J.B.). Life detection analytical techniques in bottom row (left to right) are laser spectroscopy (modified with permission from Leshin et al., 2013); Raman spectra from 3.49 Ga Dresser Formation chert (D.M.B.); high-resolution mass spectrometry (Parker et al., 2016); scanning electron microscopy (Chivian et al., 2008); Raman spectra map (D.M.B.), photograph of sulfur deposits on the Borup Fiord Pass glacier (Lau et al., 2017) computational network analysis (http://dtdi.carnegiescience.edu) (Morrison et al., 2017).
<b>FIG. 3.</b>
FIG. 3.
Most biosignatures in the geologic record are ambiguous, with discovery highly dependent on taphonomic and diagenetic processes. When these processes are not well understood, the resulting signatures are ambiguous, appearing to be the result of chance events (dashed lines). When processes are well understood, they function as high-fidelity representations of the original substances, biotic or not (solid lines). Multiple independent observations can distinguish the biosignature and abiosignature fields, reducing the size of the ambiguous signature field. Δt = time since formation of the substance. T+P = temperature and pressure changes the substance experiences over time. “f(Env)” = environmental conditions under which diagenetic and taphonomic processes occur, specifically, chemical reactions and the presence and movement of fluids or absence of fluids over time.
<b>FIG. 4.</b>
FIG. 4.
Earth's mineral inventory follows an LNRE distribution. Observed (gray) and modeled (blue) frequency distribution for rare minerals on Earth (Hazen et al., ; Hystad et al., 2015). Most of Earth's >5300 known mineral species are rare, occurring at ≤5 localities, and changes in Earth's environment caused by biology may contribute to this phenomenon. Statistical expected relationships GIGP means generalized inverse Gauss–Poisson distribution. LNRE, Large Number of Rare Events. Image: R.M.H.
<b>FIG. 5.</b>
FIG. 5.
A bipartite network diagram for all carbon-bearing mineral species reveals relationships among mineral localities (represented by black circles), connected to mineral species (represented by colored nodes) that occur at those localities. Sizes of locality nodes indicate how many mineral species occur at that locality. Sizes and colors of mineral species nodes reflect mineral abundances. The topological distribution of mineral nodes represents an LNRE frequency spectrum (Fig. 4). Image: R.M.H.
<b>FIG. 6.</b>
FIG. 6.
Complex linkages of the C and Si cycles (Kasting and Catling, 2003). Atmospheric CO2 dissolves in surface waters. The dissolved and atmospheric CO2 is in equilibrium. Dissolved CO2 reacts with water to form H2CO3 (carbonic acid, a weak acid). H2CO3 dissociates into H+ and HCO3. Ultimately, H+ and water react with most common minerals, silicates, and carbonates, altering those minerals. The predominant weathering products are clay minerals (silicates) and soluble ions (Ca2+, Fe2+, Na+, K+). HCO3- also remains in solution. Image: M.S.-R.
<b>FIG. 7.</b>
FIG. 7.
Linked biotic and abiotic processes illustrate formation and degradation of reactive oxygen species in aquatic systems, including photochemical processes. Three systems are used to illustrate the processes: carbon, which is the dominant mechanism in most aquatic systems, manganese, and iron (cf. Wilson et al., ; Duesterberg et al., ; Doane, 2017). Black arrows are abiotic reactions. Red arrows are biotic reactions. Green arrows are inferred reactions. The stippled area shows reactions that occur in the absence of oxygen. Dots by chemical compounds indicate an unpaired electron, that is, free radicals. Image N.W.H.
<b>FIG. 8.</b>
FIG. 8.
Iron oxide mineral precipitates have various biomediated to ambiguous origins. (A) Bauxitic paleosols of the Yilgarn Craton, Western Australia, show deep weathered zones, heavily influenced by plants to microbes and bacteria. Upper right inset shows loose paleosol pisolite (pisoliths) with various microbial forms (Anand and Verrall, 2011). (B) Concretions of goethite (brown), malachite (green), and azurite (blue) mineralogies from Utah are more ambiguous in their origins, and lack any fossil nuclei. (C) Iron oxide concretions around human-made objects (e.g., metal watch band from the Chesapeake Bay) suggest rapid, biomediated cementation on the orders of years. Images (A, B) M.A.C.; image (C) S. Godfrey, supplied by R.M.H.
<b>FIG. 9.</b>
FIG. 9.
Mineral patterns can be biomediated (A–C) or a result of abiotic chemical reactions (D). (A) A modern lithification front of biovermiculation, Cueva de Villa Luz, Mexico. View ∼8 cm across. Image: K. Ingham. (B) The underside of a hypolithic rock shows highly miniaturized biovermiculation patterns of cyanobacteria (genus Chroococcidiopsis) that live along the soil interface, Strzelecki Desert, Australia. Image: P.J.B. (C) Centimeter-size columnar-branching and multifurcate dolomitic stromatolites show millimeter-thick lamination patterns from the Paleoproterozoic McLeary Formation of the Belcher Supergroup, Canada. Image: D.P. (D) In an established abiotic B-Z reaction, chemical oscillation rings create life-like patterns. In this example, the red color arises from the redox indicator ferroin (commercial 25 mM phenanthroline ferrous sulfate) used in the experiment, and blue-gray lines represent redox fronts extending radially outward from oxidation spots in the geometric centers. Glass dish diameter 100 mm. B-Z, Belousov–Zhabotinsky. Image: D.P.
<b>FIG. 10.</b>
FIG. 10.
Histogram comparison used to determine a ruleset for a biopattern. Neighbors are the number of cells with biology within a preselected range, called the radius. Frequency is the number of cells (either abiological or biological) in the entire image that have the number of neighbors specified by the horizontal axis. The image is not guaranteed to have all possible configurations of neighbors, so there are sometimes no data available. These patterns specify the underlying rules. A, abiological; B, biological; ND, no data; OA, only abiological; OB, only biological. Image: K.E.S.
<b>FIG. 11.</b>
FIG. 11.
Histogram comparison of the number of neighbors for biological and abiological “cells” at each iteration of a modeled cellular automaton versus a ruleset determined from an actual biological system. The vertical axis is iterations (essentially time). Each row is a histogram of the cellular automaton state, where color indicates the relative amount of biological versus abiological “cells.” Gray indicates no data, green indicates more biological “cells” at that number of neighbors, while pink indicates more abiological. Dark green indicates only biological cells having that number of neighbors and dark pink indicates only abiological cells having that number of neighbors. Image: K.E.S.

References

    1. Ader M., Thomazo C., Sansjofre P., Busigny V., Papineau D., Laffont R., Cartigny P., and Halverson G.P. (2016) Interpretation of the nitrogen isotopic composition of Precambrian sedimentary rocks: assumptions and perspectives. Chem Geol 429:93–110
    1. Allison P.A. and Bottjer D.J. (2011) Taphonomy: process and bias through time, 1. In Topics in Geobiology 32, edited by P.A. Allison and D.J. Bottjer, Springer, New York, 600 pp
    1. Allwood A.C. (2016) Geology: evidence of life in Earth's oldest rocks. Nature 537:500–501 - PubMed
    1. Allwood A.C., Walter M.R., Kamber B.S., Marshall C.P., and Burch I.W. (2006) Stromatolite reef from the early Archaean era of Australia. Nature 441:714–718 - PubMed
    1. Allwood A.C., Rosing M.T., Flannery D.T., Hurowitz J.A., and Heirwegh C.M. (2018) Reassessing evidence of life in 3,700-million-year-old rocks of Greenland. Nature 563:241–244 - PubMed

Publication types

LinkOut - more resources