. 2019 Jul 23;5(16):e129954.
doi: 10.1172/jci.insight.129954.

Glucagon lowers glycemia when β-cells are active

Affiliations

Glucagon lowers glycemia when β-cells are active

Megan E Capozzi et al. JCI Insight. .

Abstract

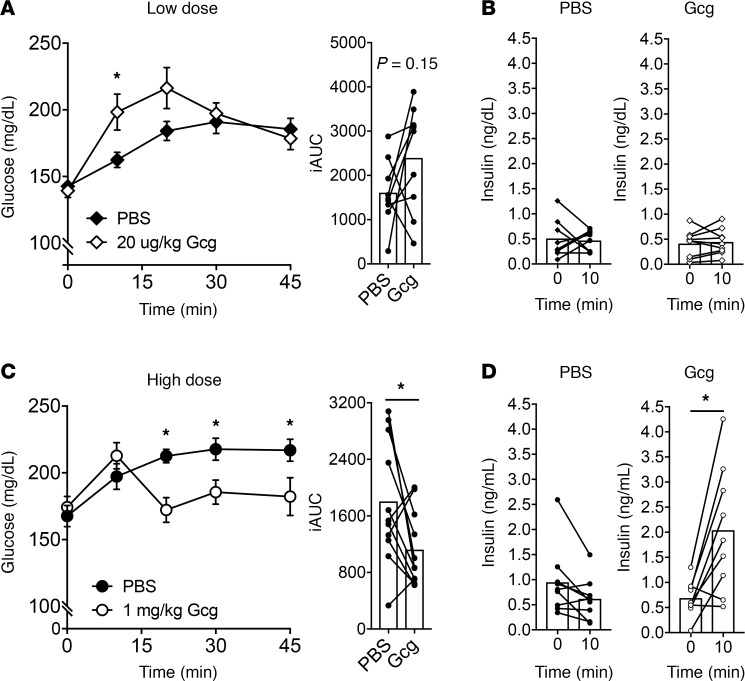
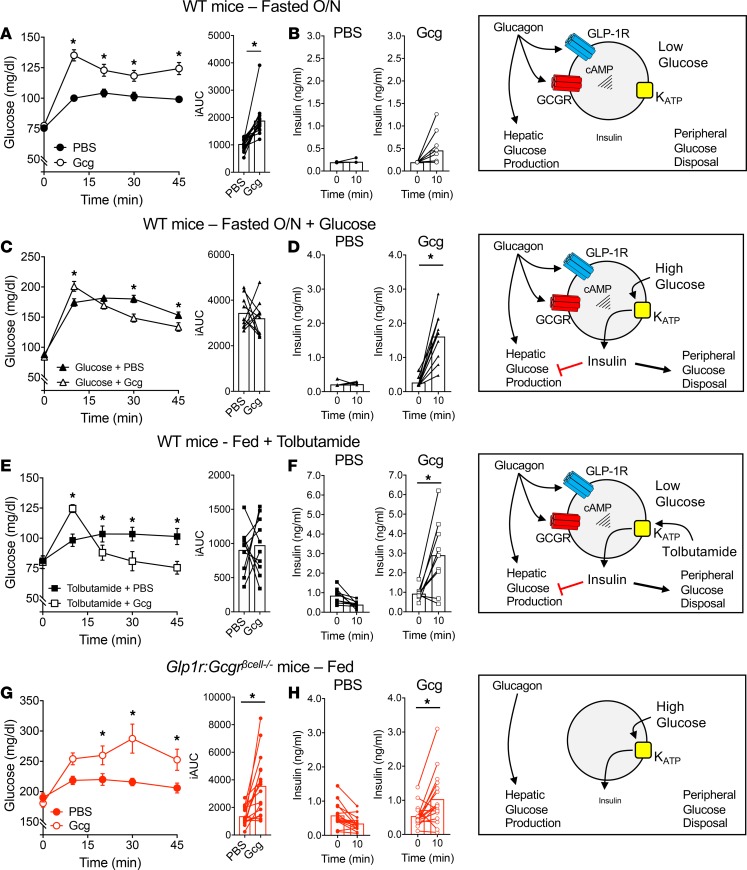
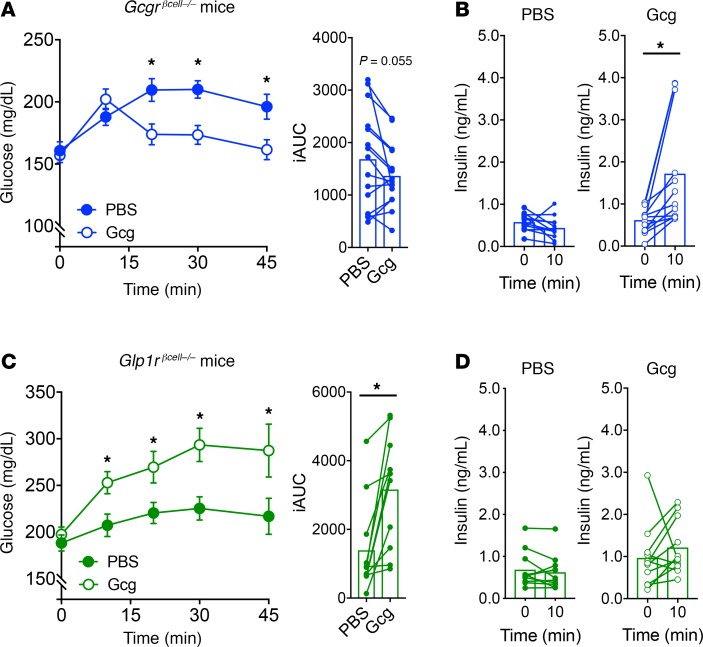
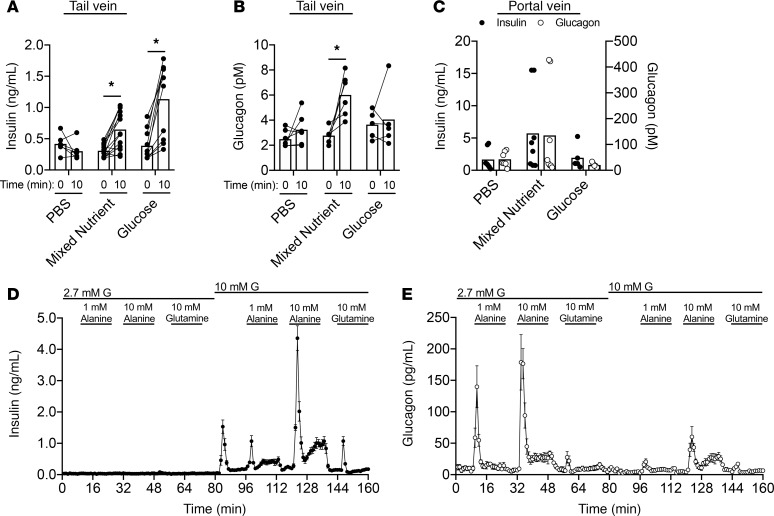
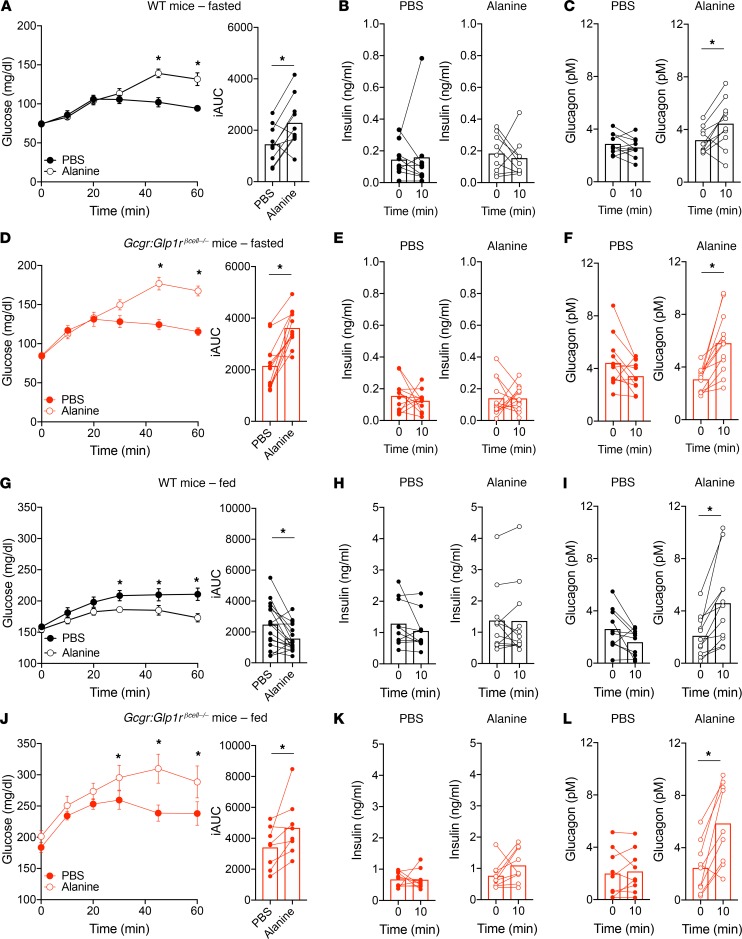
Glucagon and insulin are commonly believed to have counteracting effects on blood glucose levels. However, recent studies have demonstrated that glucagon has a physiologic role to activate β-cells and enhance insulin secretion. To date, the actions of glucagon have been studied mostly in fasting or hypoglycemic states, yet it is clear that mixed-nutrient meals elicit secretion of both glucagon and insulin, suggesting that glucagon also contributes to glucose regulation in the postprandial state. We hypothesized that the elevated glycemia seen in the fed state would allow glucagon to stimulate insulin secretion and reduce blood glucose. In fact, exogenous glucagon given under fed conditions did robustly stimulate insulin secretion and lower glycemia. Exogenous glucagon given to fed Gcgr:Glp1rβcell-/- mice failed to stimulate insulin secretion or reduce glycemia, demonstrating the importance of an insulinotropic glucagon effect. The action of endogenous glucagon to reduce glycemia in the fed state was tested with administration of alanine, a potent glucagon secretagogue. Alanine raised blood glucose in fasted WT mice or fed Gcgr:Glp1rβcell-/- mice, conditions where glucagon is unable to stimulate β-cell activity. However, alanine given to fed WT mice produced a decrease in glycemia, along with elevated insulin and glucagon levels. Overall, our data support a model in which glucagon serves as an insulinotropic hormone in the fed state and complements rather than opposes insulin action to maintain euglycemia.

Keywords: Diabetes; Endocrinology; Glucose metabolism; Islet cells; Metabolism.


Conflict of interest statement

Conflict of interest: BF is an employee of Novo Nordisk.

Figures

Figure 1
Figure 1. Exogenous glucagon stimulates insulin secretion and lowers glycemia.
Low-dose (20 μg/kg) glucagon (A) increases glycemia and (B) does not stimulate insulin secretion in ambient-fed mice. High-dose (1 mg/kg) glucagon (C) lowers glycemia compared with PBS control and (D) stimulates insulin secretion in ambient-fed mice. *P < 0.05 vs. PBS control (A and C) or 0-minute value (D); values are mean ± SEM. Statistical tests: Student’s paired t test (B and D) and 2-way ANOVA (A and C). iAUC, incremental AUC.
Figure 2
Figure 2. The glycemic effects of glucagon depend on β cell activity.
(A and B) High-dose (1 mg/kg) glucagon given to mice fasted overnight (A) increases plasma glucose and (B) does not stimulate insulin secretion. (C and D) Coadministration of 1 mg/kg glucagon with 0.5 g/kg glucose to mice fasted overnight (C) produces lower glycemia compared with glucose alone and (D) stimulates an increase of ~6-fold in insulin secretion. (E and F) Ambient-fed mice treated with tolbutamide (100 mg/kg) to lower glucose to fasting levels respond to glucagon (1 mg/kg) with (E) lower glycemia and (F) increased insulin secretion of ~3-fold. (G and H) Glucagon (1 mg/kg) given to Glp1r Gcgrβcell–/– mice (G) increases glycemia and (H) produces a ~2-fold increase in insulin secretion. *P < 0.05 vs. PBS control (A, C, E, and G) or 0-minute value (D, F, and H); values are mean ± SEM. Statistical tests: Student’s paired t test (B, D, F, and H) and 2-way ANOVA (A, C, E, and G).
Figure 3
Figure 3. Glucagon requires the GLP-1R to lower glycemia and stimulate insulin secretion.
(A and B) High-dose (1 mg/kg) glucagon given to fed Gcgrβcell–/– mice. (A) Glucagon lowered glycemia and (B) stimulated insulin secretion in Gcgrβcell–/– mice. (C and D) High-dose (1 mg/kg) glucagon given to fed Glp1rβcell–/– mice. (C) Glucagon raised glycemia and (D) did not stimulate insulin secretion in Glp1rβcell–/– mice. *P < 0.05 vs. PBS control (A and C) or 0-minute value (B); values are mean ± SEM. Statistical tests: Student’s paired t test (B and D) and 2-way ANOVA (A and C).
Figure 4
Figure 4. The β cell GCGR is required for the full insulinotropic effects of glucagon.
(A) The glycemic response to a GCGR-specific agonist (GCGR-SA; 44-0410) in fed mice. Mice without the GCGR in β cells demonstrated a much more robust glycemic response compared with WT or Glp1rβcell–/– mice. The insulin response (left) and insulin/glucose ratio (right) in response to (B) PBS in WT mice or the GCGR-SA in (C) WT mice, (D) Gcgrβcell–/– mice, (E) Glp1rβcell–/– mice, and (F) Gcgr:Glp1rβcell–/– mice. *P < 0.05 vs. WT, PBS control (A) or 0-minute value (BF); **P < 0.05 vs. WT, GCGR-SA; values are mean ± SEM. Statistical tests: Student’s paired t test (BF) and 1-way ANOVA (A).
Figure 5
Figure 5. A mixed-nutrient meal stimulates glucagon and insulin secretion in mice.
(AC) WT mice were given an oral gavage of PBS, liquid Ensure (mixed nutrient, 10 mL/kg), or glucose (1.5 g/kg). (A) Plasma insulin concentrations sampled from the tail vein at 0 and 10 minutes. (B) Plasma glucagon concentrations sampled from the tail vein at 0 and 10 minutes. (C) Insulin (closed circles) or glucagon (open circles) concentrations sampled from the portal vein at 10 minutes. (D) Insulin secretion in WT islets. (E) Glucagon secretion in WT islets. *P < 0.05 vs. control (A and B); values are mean ± SEM. Statistical tests: 2-way ANOVA (AC).
Figure 6
Figure 6. Endogenous glucagon secretion by alanine requires β cell activity to lower glycemia.
(A) Glucose, (B) insulin, and (C) glucagon concentrations in WT mice fasted overnight and injected i.p. with alanine (0.325 g/kg). (D) Glucose, (E) insulin, and (F) glucagon concentrations in Gcgr:Glp1rβcell–/– mice fasted overnight and injected i.p. with alanine. (G) Glucose, (H) insulin, and (I) glucagon concentrations in fed WT mice injected i.p. with alanine. (J) Glucose, (K) insulin, and (L) glucagon concentrations in fed Gcgr:Glp1rβcell–/– mice injected i.p. with alanine. *P < 0.05 vs. PBS control; values are mean ± SEM. Statistical tests: Student’s paired t test (B, C, E, F, H, I, K, and L and iAUC in A, D, G, and J) and 2-way ANOVA (A, D, G, and J).

References

    1. Müller WA, Faloona GR, Aguilar-Parada E, Unger RH. Abnormal alpha-cell function in diabetes. Response to carbohydrate and protein ingestion. N Engl J Med. 1970;283(3):109–115. doi: 10.1056/NEJM197007162830301. - DOI - PubMed
    1. Bock G, et al. The effect of DPP-4 inhibition with sitagliptin on incretin secretion and on fasting and postprandial glucose turnover in subjects with impaired fasting glucose. Clin Endocrinol (Oxf) 2010;73(2):189–196. - PMC - PubMed
    1. Carr RD, et al. Secretion and dipeptidyl peptidase-4-mediated metabolism of incretin hormones after a mixed meal or glucose ingestion in obese compared to lean, nondiabetic men. J Clin Endocrinol Metab. 2010;95(2):872–878. doi: 10.1210/jc.2009-2054. - DOI - PubMed
    1. Rauch T, et al. Linagliptin increases incretin levels, lowers glucagon, and improves glycemic control in type 2 diabetes mellitus. Diabetes Ther. 2012;3(1):10. doi: 10.1007/s13300-012-0010-y. - DOI - PMC - PubMed
    1. Capozzi ME, et al. β Cell tone is defined by proglucagon peptides through cAMP signaling. JCI Insight. 2019;4(5):126742. - PMC - PubMed

Publication types