. 2019 Jul 23;5(16):e126915.
doi: 10.1172/jci.insight.126915.

Mitochondrial fusion exploits a therapeutic vulnerability of pancreatic cancer

Affiliations

Mitochondrial fusion exploits a therapeutic vulnerability of pancreatic cancer

Meifang Yu et al. JCI Insight. .

Abstract

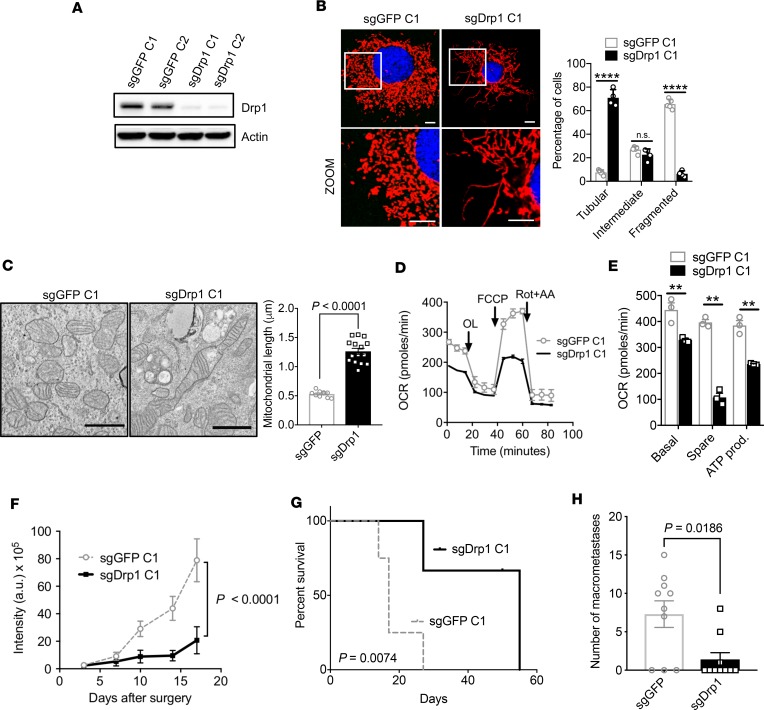
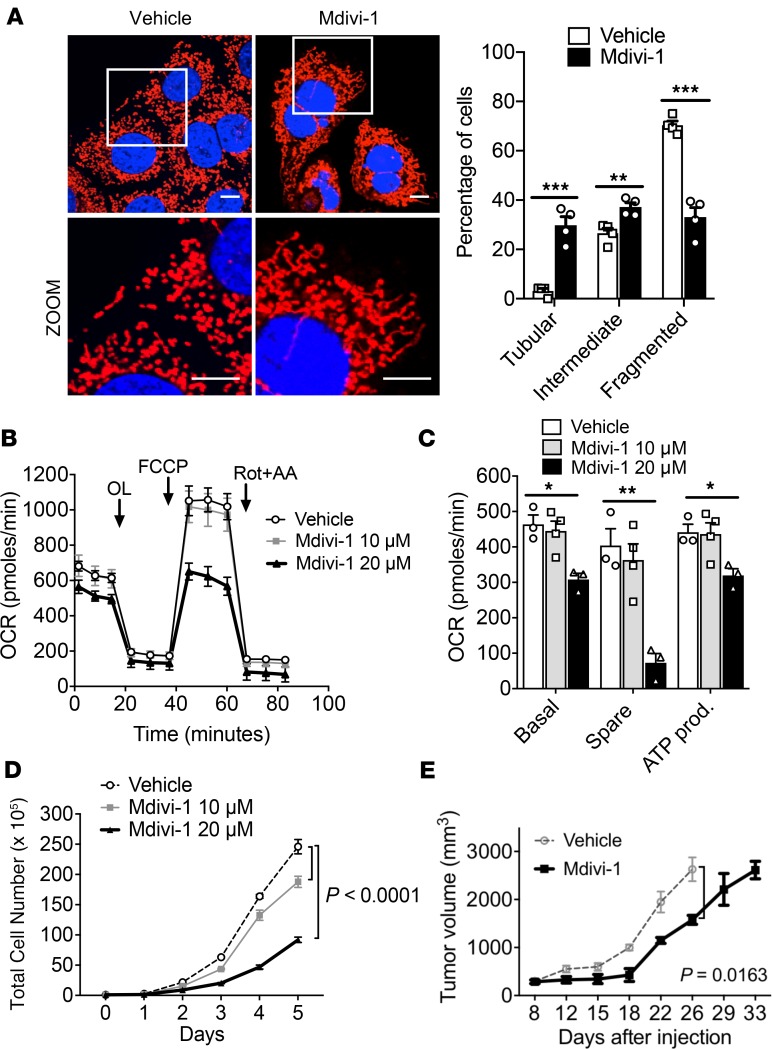
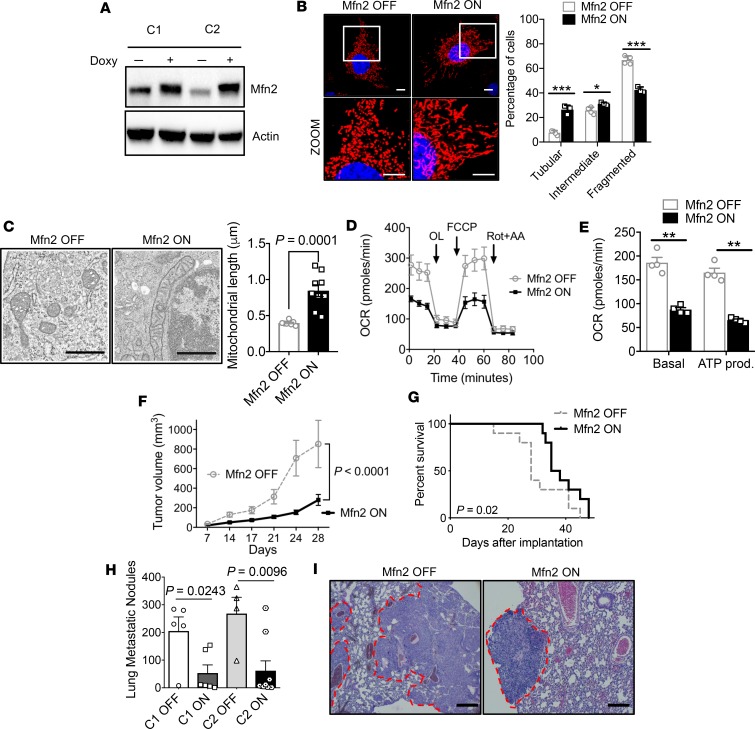
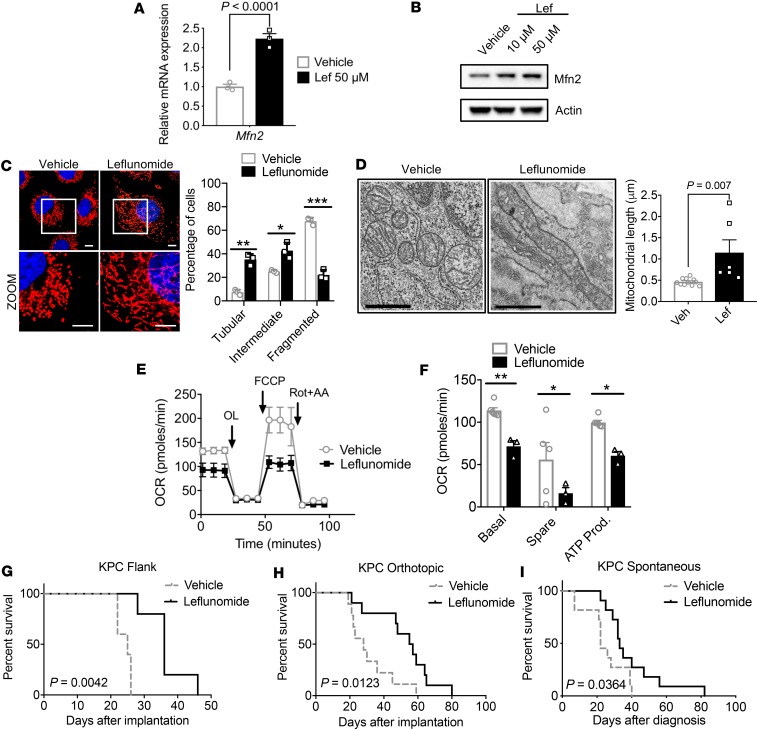
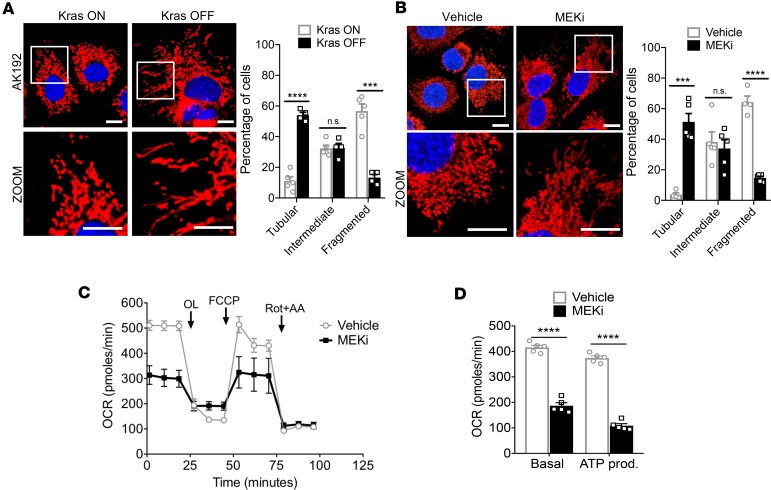
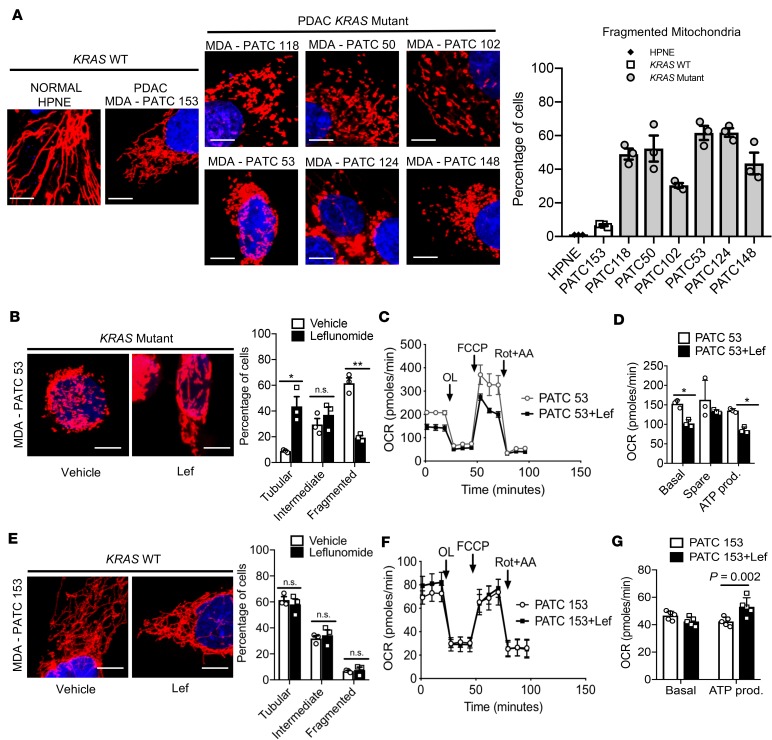
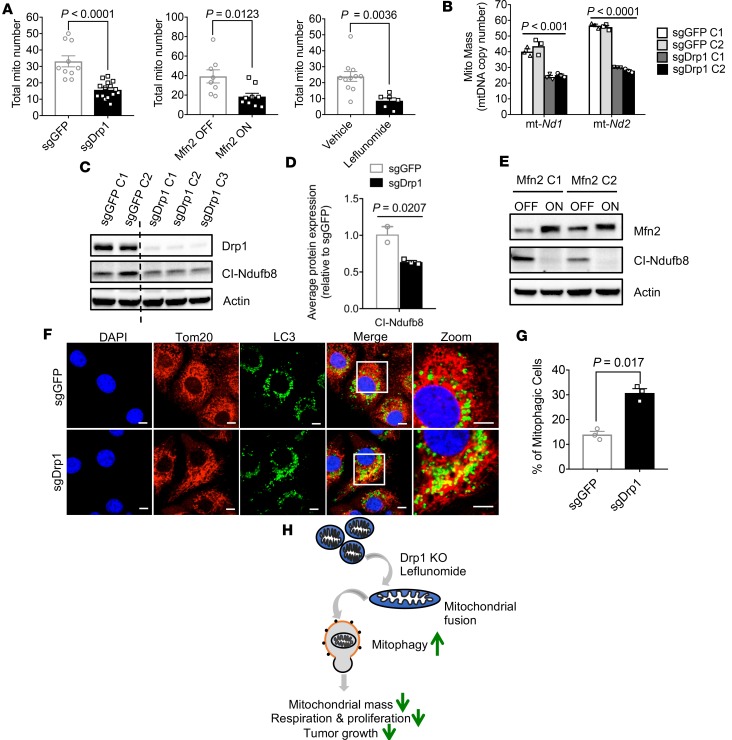
Pancreatic ductal adenocarcinoma (PDAC) requires mitochondrial oxidative phosphorylation (OXPHOS) to fuel its growth, however, broadly inhibiting this pathway might also disrupt essential mitochondrial functions in normal tissues. PDAC cells exhibit abnormally fragmented mitochondria that are essential to its oncogenicity, but it was unclear if this mitochondrial feature was a valid therapeutic target. Here, we present evidence that normalizing the fragmented mitochondria of pancreatic cancer via the process of mitochondrial fusion reduces OXPHOS, which correlates with suppressed tumor growth and improved survival in preclinical models. Mitochondrial fusion was achieved by genetic or pharmacologic inhibition of dynamin related protein-1 (Drp1) or through overexpression of mitofusin-2 (Mfn2). Notably, we found that oral leflunomide, an FDA-approved arthritis drug, promoted a two-fold increase in Mfn2 expression in tumors and was repurposed as a chemotherapeutic agent, improving the median survival of mice with spontaneous tumors by 50% compared to vehicle. We found that the chief tumor suppressive mechanism of mitochondrial fusion was enhanced mitophagy, which proportionally reduced mitochondrial mass and ATP production. These data suggest that mitochondrial fusion is a specific and druggable regulator of pancreatic cancer growth that could be rapidly translated to the clinic.

Keywords: Cancer; Gastroenterology; Mitochondria; Mouse models; Oncology.


Conflict of interest statement

Conflict of interest: JMH receives research support from Oncosil, Galera, Adura, Augmenix, and RaySearch and is a consult for BTG, AbbVie, Celgene, AstraZeneca, Bristol-Myers Squibb, Varian, and Sirtex.

Figures

Figure 1
Figure 1. Genetic inhibition of mitochondrial fission suppresses mitochondrial OXPHOS and improves survival.
(A) CRISPR/Cas9 knockout of Drp1 (sgDrp1) or GFP control (sgGFP) in KPC cells. (B) Representative (original magnification, ×60) confocal image with MitoTracker Red CMXRos staining, with morphology quantified, n = 100–200 cells. Scale bar: 10 μm. Red fluorescence, mitochondria; blue fluorescence, DAPI-labeled nucleus. ****P < 0.0001 by unpaired t test. (C) Mitochondrial morphology by TEM imaging, average mitochondrial length in μm quantified, and significance by unpaired t test. Scale bar: 1 μm. (D) Mito Stress assay showing (E) decreased basal respiration, spare respiration, and ATP production in sgDrp1 cells compared with controls. **P < 0.01 by unpaired t test. (F) Orthotopic tumor growth in C57BL/6J mice (n = 5 per cohort). Statistical analysis by unpaired t test. (G) Kaplan-Meier survival curves of sgDrp1 or sgGFP implanted orthotopically (n = 5 per cohort, analysis by log rank). (H) Quantification of macrometastases after knockout of Drp1 (n = 10). Statistical analysis by Wilcoxon rank-sum test. Data are presented as mean  ±  SEM.
Figure 2
Figure 2. Suppression of mitochondrial OXPHOS by pharmacologic inhibition of mitochondrial fission improves survival.
(A) Confocal microscopy image (original magnification, ×60) of mitochondrial morphology of KPC cells treated with Mdivi-1 quantified; n = 100–200 cells. Scale bar: 10 μm. Red fluorescence, mitochondria; blue fluorescence; DAPI-labeled nucleus. ***P = 0.0006 for tubular, **P = 0.007 for intermediate, ***P = 0.0003 for fragmented by unpaired t test. (B) Mdivi-1 decreases OCR, quantified in C, and reduces cell proliferation in a dose-dependent manner (D). *P < 0.05; **P < 0.01 by unpaired t test (C); statistical analysis by 1-way ANOVA (D). (E) In vivo tumor suppression of pancreatic tumors treated with vehicle or 10 mg/kg Mdivi-1 significantly slowed tumor growth; n = 10 per cohort. Statistical analysis by 2-way ANOVA. Data are presented as mean  ±  SEM.
Figure 3
Figure 3. Direct induction of mitochondrial fusion by Mfn2 overexpression suppresses pancreatic cancer growth.
(A) Immunoblot of 2 independent clones of Tet-On-Mfn2 KPC cells showing doxycycline-inducible expression of Mfn2. (B) Mfn2 overexpression induces fusion (original magnification, ×60; scale bar: 10 μm); mitochondrial morphology was quantified; n = 100–200 cells. Red fluorescence, mitochondria; blue fluorescence, DAPI-labeled nucleus. ***P = 0.0004 for tubular, *P = 0.025 for intermediate, ***P = 0.0003 for fragmented by unpaired t test. (C) TEM image of tumors grown in vivo with Mfn2 overexpression. Note that Mfn2 overexpression shows elongated mitochondria; average mitochondrial length in μm was quantified, compared by unpaired t test. Scale bar: 800 nm. (D) Reduced OCR with Mfn2 overexpression and quantified parameters in E. **P < 0.01 by unpaired t test. (F) Orthotopic tumor volume in C57BL/6J mice, with n = 10 per cohort. Statistical analysis by unpaired t test. (G) Kaplan-Meier survival curves of C57BL/6J mice bearing orthotopic pancreatic cancer tumor; n = 10 per cohort. (H) Lung metastatic nodules are significantly reduced with Mfn2 overexpression in 2 different clones; n = 5–10 per cohort. P value by unpaired t test. (I) Representative H&E staining (original magnification, × 20) of the lungs with metastatic nodules. Scale bar: 100 μm. Data are presented as mean  ±  SEM.
Figure 4
Figure 4. Pharmacological induction of Mfn2 expression suppresses pancreatic growth and improves survival.
Leflunomide (Lef) increases (A) mRNA and (B) protein levels of Mfn2. Statistical analysis by unpaired t test. (C) Leflunomide elongated mitochondria, with morphology quantified; n = 100–200 counted cells. Red fluorescence, mitochondria; blue fluorescence, DAPI-labeled nucleus. Original magnification, ×60. **P = 0.0015 for tubular, *P = 0.011 for intermediate, ***P = 0.0003 for fragmented by unpaired t test. (D) TEM image of KPC tumors treated with leflunomide displaying elongated mitochondria. Scale bars: 800 nm. Average mitochondrial length quantified in μm, compared by unpaired t test. Leflunomide decreases (E and F) mitochondrial basal respiration, spare respiration, and ATP production. *P < 0.05, **P < 0.01 by unpaired t test. Leflunomide (20 mg/kg) treatment improves survival in a (G) flank tumor model (n = 5 per cohort), (H) orthotopic model (n = 10 per cohort), and (I) spontaneous KPC model (n = 11 per cohort). P values by log-rank test. Data are presented as mean  ±  SEM.
Figure 5
Figure 5. Mitochondrial dynamics are regulated by the RAS/MAPK pathway.
(A) Inducible-Kras cell line AK192 activated with doxycycline exhibits punctate mitochondria, with quantification; n = 100–200 cells. ****P < 0.0001 for tubular, ***P = 0.0002 for fragmented by unpaired t test. Original magnification, ×60. Scale bar: 10 μm. (B) Treatment with MEK inhibitor, PD0325901, induces mitochondrial fusion in KPC cells, with quantification; n = 100–200 cells. ***P = 0.0002 for tubular, ****P < 0.0001 for fragmented by unpaired t test. Original magnification, ×60. Scale bar: 10 μm. (C) Mito Stress assay of KPC cells treated with MEK inhibitor and quantified (D). ****P < 0.0001 by unpaired t test. Data are presented as mean  ±  SEM.
Figure 6
Figure 6. Patient-derived pancreatic cancer cells respond to leflunomide in a Kras-dependent fashion.
(A) Kras WT patient samples of PDAC exhibited elongated mitochondria similar to HPNE cells, while Kras mutant patient samples appeared punctate and fragmented. The mitochondria morphology from each genotype was quantified; n = 100–200. Quantification for intermediate and tubular mitochondrial morphology can be found in Supplemental Figure 6, B and C. (B) Leflunomide treatment on Kras mutant MDA-PATC53 cell line induces mitochondrial fusion, with quantification; n = 100–200 cells. *P = 0.02 for tubular, **P = 0.002 for fragmented by unpaired t test. (C) Mito Stress assay of MDA-PATC53 cells treated with 50 μM leflunomide, with quantification in D. *P = 0.04 by unpaired t test for basal and ATP production. Original magnification, ×60; scale bars: 10 μm. Data are presented as mean  ±  SEM. (E) Leflunomide treatment does not affect morphology in Kras WT MDA-PATC153 cell line, with quantification; n = 100–200 cells. (F) Mito Stress assay of MDA-PATC153 cells treated with 50 μM leflunomide, with quantification in G. Statistical analysis by unpaired t test. Data are presented as mean  ±  SEM.
Figure 7
Figure 7. Loss of Drp1 reduces mitochondrial mass by increased mitophagy.
(A) Total mitochondria per cell decreased after induction of mitochondrial fusion, as measured by TEM. P values by unpaired t test are shown in the figure. (B) Decreased mitochondrial mass after Drp1 knockout. Statistical analysis by unpaired t test. (C) Immunoblot for mitochondrial complex I proteins in sgDrp1 KPC cells, with quantification in D and P values by unpaired t test. (E) Decreased complex I expression with Mfn2 expression. (F) Increased colocalization of Tom20 and LC3 in sgDrp1 cells, indicating enhanced mitophagy. Scale bar: 10 μm. Original magnification, ×60. (G) Quantified mitophagic cells from F, compared by unpaired t test. (H) Mitochondrial fusion heralds mitophagy, decreasing OXPHOS and impairing oncogenic proliferation and growth. Data are presented as mean  ±  SEM.

References

    1. Viale A, et al. Oncogene ablation-resistant pancreatic cancer cells depend on mitochondrial function. Nature. 2014;514(7524):628–632. doi: 10.1038/nature13611. - DOI - PMC - PubMed
    1. Chen H, Chan DC. Mitochondrial Dynamics in Regulating the Unique Phenotypes of Cancer and Stem Cells. Cell Metab. 2017;26(1):39–48. doi: 10.1016/j.cmet.2017.05.016. - DOI - PMC - PubMed
    1. Youle RJ, van der Bliek AM. Mitochondrial fission, fusion, and stress. Science. 2012;337(6098):1062–1065. doi: 10.1126/science.1219855. - DOI - PMC - PubMed
    1. Boland ML, Chourasia AH, Macleod KF. Mitochondrial dysfunction in cancer. Front Oncol. 2013;3:292. - PMC - PubMed
    1. Chen H, McCaffery JM, Chan DC. Mitochondrial fusion protects against neurodegeneration in the cerebellum. Cell. 2007;130(3):548–562. doi: 10.1016/j.cell.2007.06.026. - DOI - PubMed

Publication types

MeSH terms