. 2019 Jul 23;5(16):e129212.
doi: 10.1172/jci.insight.129212.

Cellular heterogeneity during mouse pancreatic ductal adenocarcinoma progression at single-cell resolution

Affiliations

Cellular heterogeneity during mouse pancreatic ductal adenocarcinoma progression at single-cell resolution

Abdel Nasser Hosein et al. JCI Insight. .

Abstract

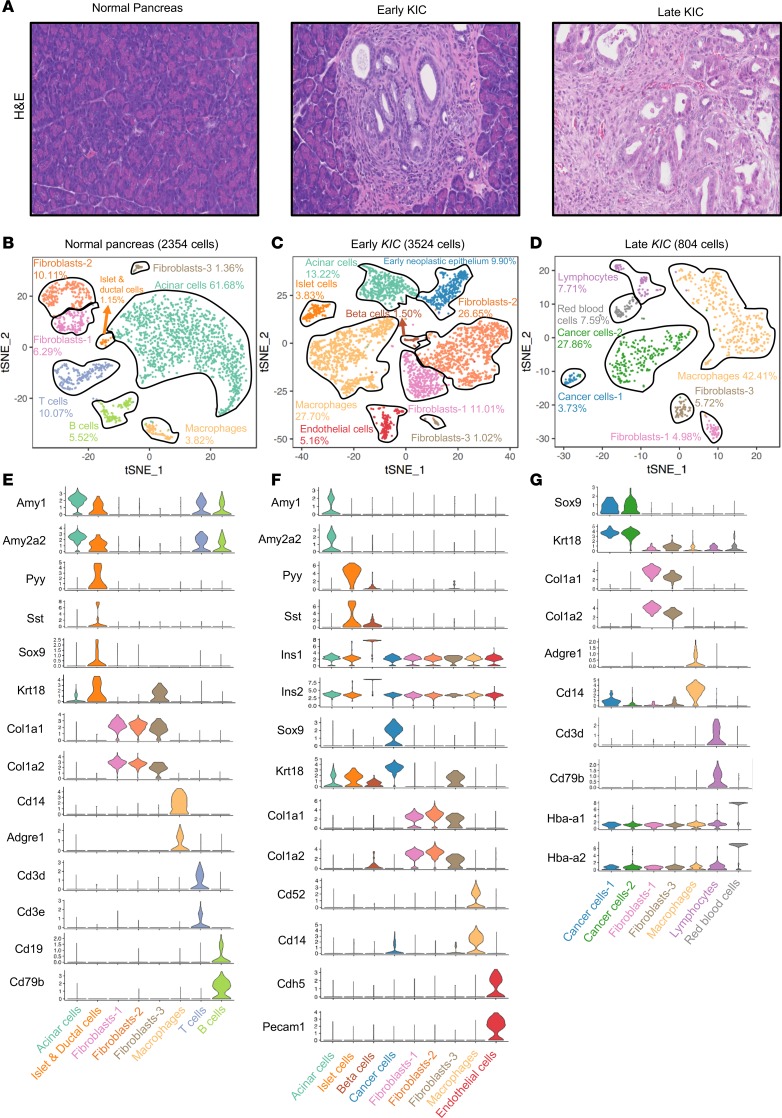
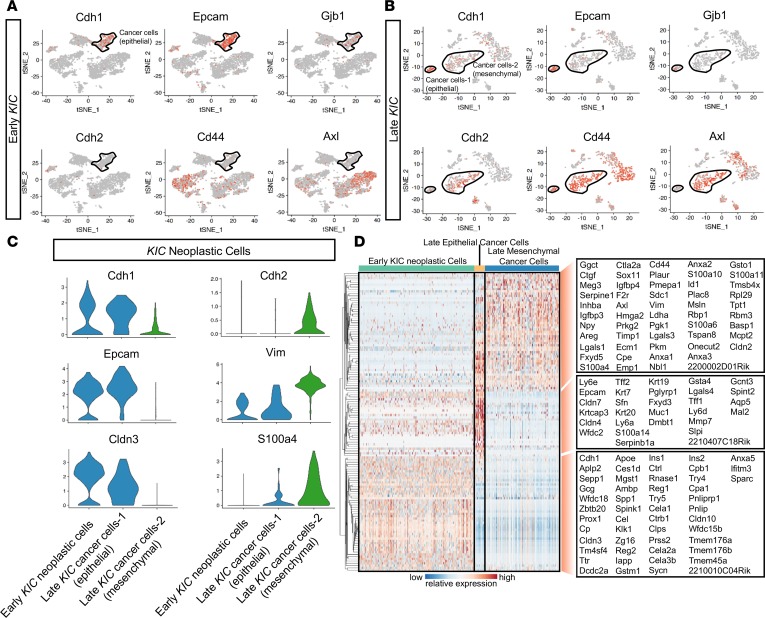
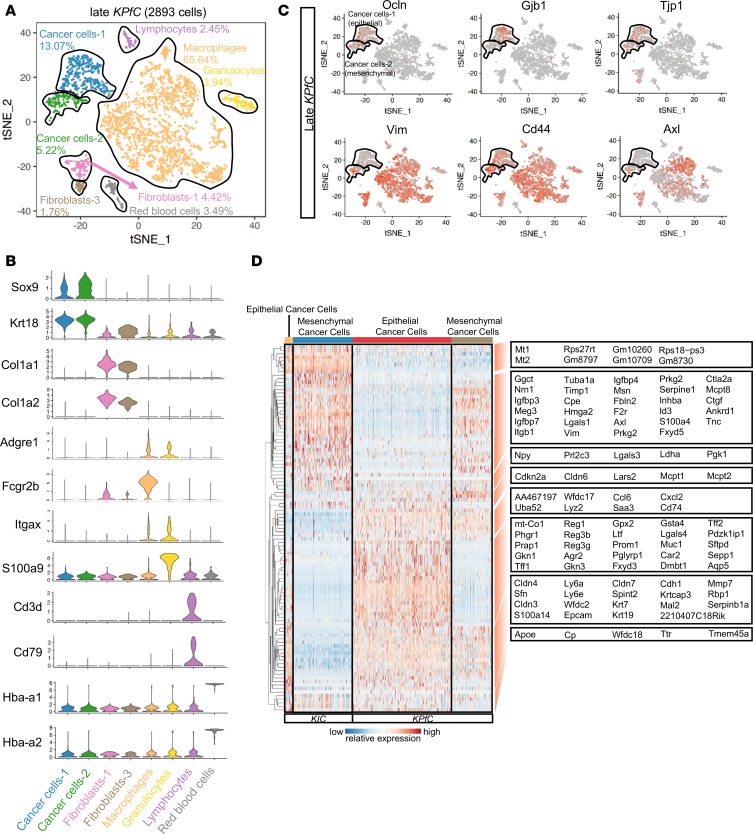
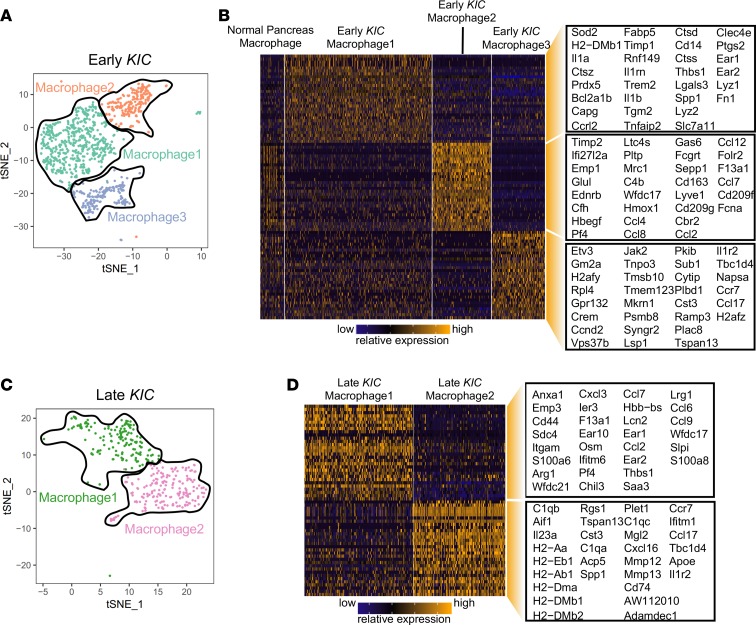
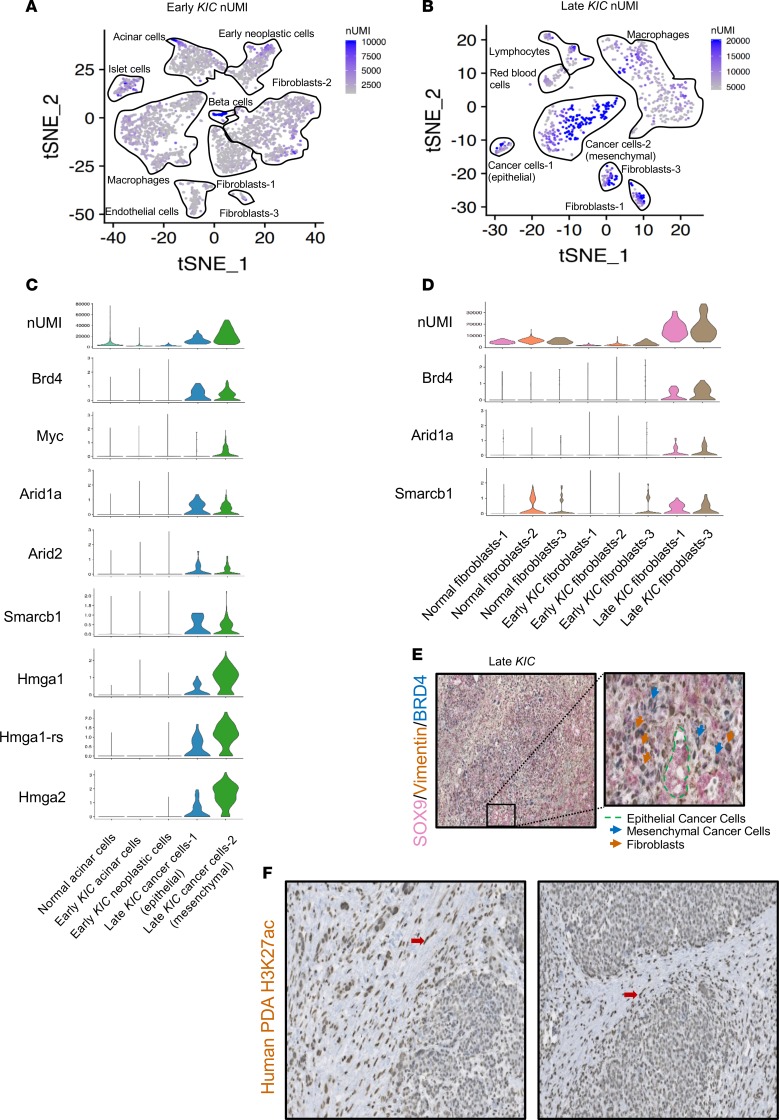
Pancreatic ductal adenocarcinoma (PDA) is a major cause of cancer-related death with limited therapeutic options available. This highlights the need for improved understanding of the biology of PDA progression, a highly complex and dynamic process featuring changes in cancer cells and stromal cells. A comprehensive characterization of PDA cancer cell and stromal cell heterogeneity during disease progression is lacking. In this study, we aimed to profile cell populations and understand their phenotypic changes during PDA progression. To that end, we employed single-cell RNA sequencing technology to agnostically profile cell heterogeneity during different stages of PDA progression in genetically engineered mouse models. Our data indicate that an epithelial-to-mesenchymal transition of cancer cells accompanies tumor progression in addition to distinct populations of macrophages with increasing inflammatory features. We also noted the existence of three distinct molecular subtypes of fibroblasts in the normal mouse pancreas, which ultimately gave rise to two distinct populations of fibroblasts in advanced PDA, supporting recent reports on intratumoral fibroblast heterogeneity. Our data also suggest that cancer cells and fibroblasts may be dynamically regulated by epigenetic mechanisms. This study systematically describes the landscape of cellular heterogeneity during the progression of PDA and has the potential to act as a resource in the development of therapeutic strategies against specific cell populations of the disease.

Keywords: Cancer; Gastroenterology; Oncology.


Conflict of interest statement

Conflict of interest: AM has received royalties from Cosmos Wisdom Biotechnology for a biomarker assay related to early detection of pancreatic cancer.

Figures

Figure 1
Figure 1. Cellular heterogeneity during PDA progression.
(A) Representative H&E sections of the normal pancreas, early KIC lesion (which shows pancreatic intraepithelial neoplasia), and late KIC lesion (original magnification, ×20). (B) t-distributed stochastic neighbor embedding (tSNE) plot of the normal pancreas displaying 2354 cells comprising 8 distinct cell populations (pancreas pooled from 2 mice). (C) tSNE plot of the early KIC lesion displaying 3524 cells containing 9 cell types with the emergence of the cancer cell population (lesions pooled from 2 mice). (D) tSNE plot of the late KIC tumor showing 804 cells and 7 distinct populations (tumors pooled from 3 mice). Stacked violin plots of representative marker gene expression for each of the cell populations seen in the (E) normal pancreas, (F) early KIC lesions, and (G) late KIC lesion.
Figure 2
Figure 2. Analysis of early and late KIC neoplastic cell populations demonstrate the emergence of the mesenchymal cancer cell population as a late event.
(A) tSNE plots of the early KIC lesion demonstrated the expression of known epithelial markers in the early neoplastic cell population (black outline). Mesenchymal markers were absent in this population. (B) tSNE plots demonstrating the emergence of 2 cancer cell populations in the late KIC tumor. One cancer cell population expressed the epithelial markers (smaller population outlined in black), and a second expressed the mesenchymal markers (larger population outlined in black). (C) Violin plots showing the high expression of epithelial markers (Cdh1, Epcam, and Cldn3) in the early neoplastic KIC cell population and late KIC epithelial cancer cell population but not in the mesenchymal population. Mesenchymal markers (Cdh2, Vim, and S100a4) were overexpressed in the mesenchymal cancer cell population but not in the early KIC neoplastic or late KIC epithelial cancer cell population. (D) Single-cell profiling heatmap of all early and late KIC neoplastic cells displaying differentially expressed genes among the 3 cell populations. Gene names are listed in the boxes on the far right of the heatmap. Each column represents an individual cell, and each row is the gene expression value for a single gene.
Figure 3
Figure 3. Comparison between cancer cells of KIC and KPfC tumors.
(A) tSNE plot of the late KPfC lesion displaying 2893 cells and 8 distinct cell populations (tumor analyzed from 1 mouse). (B) Stacked violin plots showing representative marker gene expression for each of the cell populations seen in the late KPfC lesion. (C) Single-gene tSNE plots of the KPfC tumor displaying the presence of epithelial markers (Ocln, Gjb1, and Tjp1) in the epithelial cancer cell population (top black-outlined population) and mesenchymal markers (Vim, Cd44, and Axl) in the mesenchymal cancer cell population (bottom black-outlined population). (D) Single-cell profiling heatmap comparing all cancer cells in late KIC versus all cancer cells in late KPfC. Each column represents an individual cell, and each row is the gene expression value for a single gene.
Figure 4
Figure 4. scRNA-Seq analysis of KIC tumor progression reveals multiple subpopulations of macrophages.
(A) tSNE plot of 3 macrophage subpopulations in the early KIC lesion. (B) Heatmap depicting the 30 top significantly overexpressed genes in each of the 3 early KIC macrophage subpopulations. Macrophages from the normal pancreas are displayed (far left group). Each column represents an individual cell, and each row is the gene expression value for a single gene. (C) tSNE plot representation of 2 macrophage subpopulations in late KIC. (D) Heatmap depicting the top 30 significantly overexpressed genes in each of the 2 late KIC macrophage subpopulations. Each column represents an individual cell, and each row is the gene expression value for a single gene.
Figure 5
Figure 5. Analysis of fibroblasts during PDA progression reveals multiple molecular subtypes.
(A) All fibroblasts from the normal pancreas and early and late KIC lesions were projected onto a single tSNE plot with the FB1, FB2, and FB3 populations distinguished by pink, orange, and brown, respectively (top left). Normal pancreas fibroblasts were highlighted in red (top right), early KIC fibroblasts in green (bottom left) and late KIC fibroblasts in blue (bottom right). Normal pancreas and early KIC contained fibroblasts in all 3 groups whereas the late KIC only contained FB1 and FB3. (B) Heatmap displaying the top significant genes (cutoff: P < 10–40) for each of the 3 fibroblast populations. Thirty random cells from each fibroblast population are displayed. All 3 late-cancer GEMMs (late KIC, KPfC, and KPC) display only FB1 and FB3 populations. (C) Violin plots demonstrating representative marker genes for each fibroblast subtype: FB1 overexpressed cytokines and Pdgfra. FB3 overexpressed mesothelial markers, myofibroblast markers, MHC-II molecules, and Cdh11.
Figure 6
Figure 6. Analysis of transcriptional activity in different stages of PDA reveals differential epigenetic and transcriptional activity in distinct tissue compartments.
tSNE plot of number of unique molecular identifiers (nUMIs) in the (A) early and (B) late KIC. (C) Violin plots of epigenetic regulatory genes in the epithelial cell populations of the normal pancreas, early KIC, and late KIC. (D) Violin plots of epigenetic regulator genes in the normal, early fibroblast, and late fibroblast populations showing their upregulation in CAFs. (E) Sequential triple immunohistochemical staining on the same late KIC tumor section for cancer cells (SOX9, shown in pink), mesenchymal cells (vimentin, shown in brown), and increased enhancer activity (BRD4, shown in blue). Well-differentiated ductal epithelium stained solely for SOX9 (green outline). Mesenchymal cancer cells (blue arrows) and CAFs (brown arrows). Original magnification ×10. Inset magnification ×30. (F) Immunohistochemical analysis of human PDA whole tissue sections using the H3K27ac antibody. These representative figures from 2 human PDAs demonstrate the 3+/3+ staining in the stromal fibroblasts (red arrows) with 1+–2+ staining in the cancer epithelium (original magnification, ×20).

References

    1. Kleeff J, et al. Pancreatic cancer. Nat Rev Dis Primers. 2016;2:16022. - PubMed
    1. Mei L, Du W, Ma WW. Targeting stromal microenvironment in pancreatic ductal adenocarcinoma: controversies and promises. J Gastrointest Oncol. 2016;7(3):487–494. doi: 10.21037/jgo.2016.03.03. - DOI - PMC - PubMed
    1. Valkenburg KC, de Groot AE, Pienta KJ. Targeting the tumour stroma to improve cancer therapy. Nat Rev Clin Oncol. 2018;15(6):366–381. doi: 10.1038/s41571-018-0007-1. - DOI - PMC - PubMed
    1. Potter SS. Single-cell RNA sequencing for the study of development, physiology and disease. Nat Rev Nephrol. 2018;14(8):479–492. doi: 10.1038/s41581-018-0021-7. - DOI - PMC - PubMed
    1. Aguirre AJ, et al. Activated Kras and Ink4a/Arf deficiency cooperate to produce metastatic pancreatic ductal adenocarcinoma. Genes Dev. 2003;17(24):3112–3126. doi: 10.1101/gad.1158703. - DOI - PMC - PubMed

Publication types

MeSH terms