. 2019 Sep 6:17:477-490.
doi: 10.1016/j.omtn.2019.06.017. Epub 2019 Jun 29.

CS-PEI/Beclin-siRNA Downregulate Multidrug Resistance Proteins and Increase Paclitaxel Therapeutic Efficacy against NSCLC

Affiliations

CS-PEI/Beclin-siRNA Downregulate Multidrug Resistance Proteins and Increase Paclitaxel Therapeutic Efficacy against NSCLC

Wangta Liu et al. Mol Ther Nucleic Acids. .

Abstract

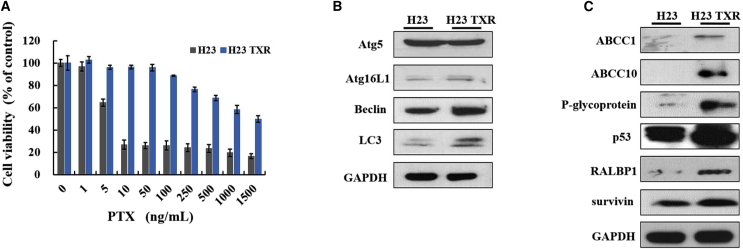
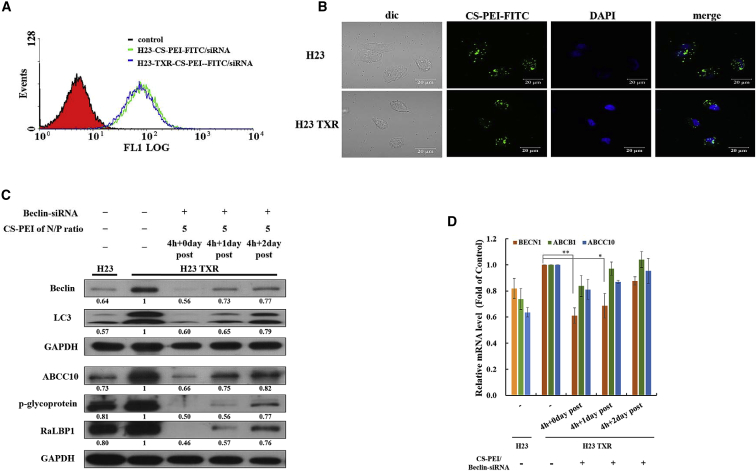
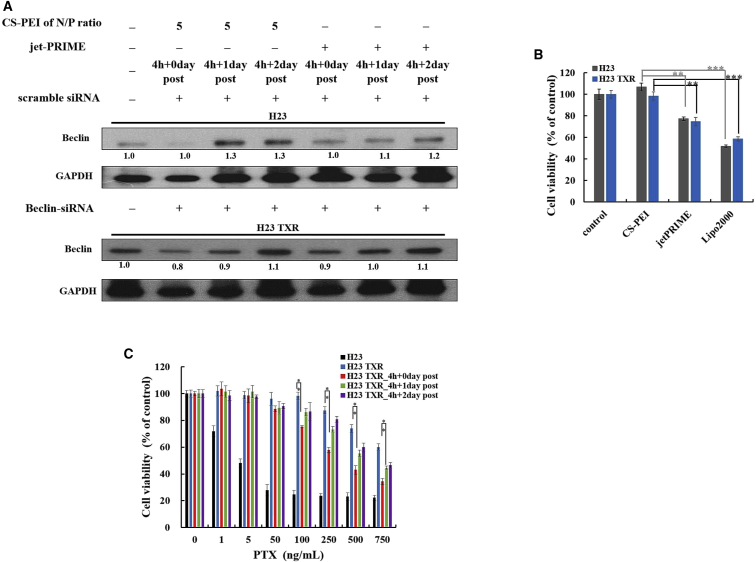
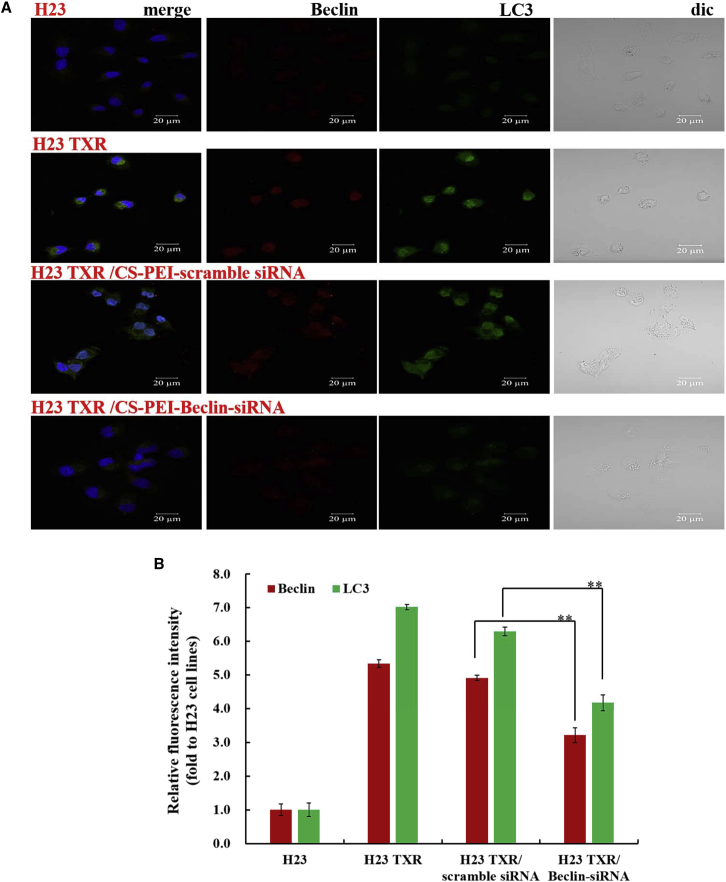
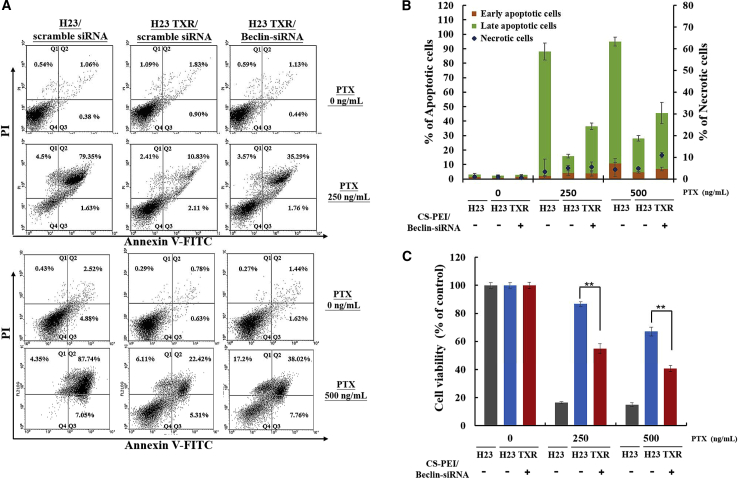
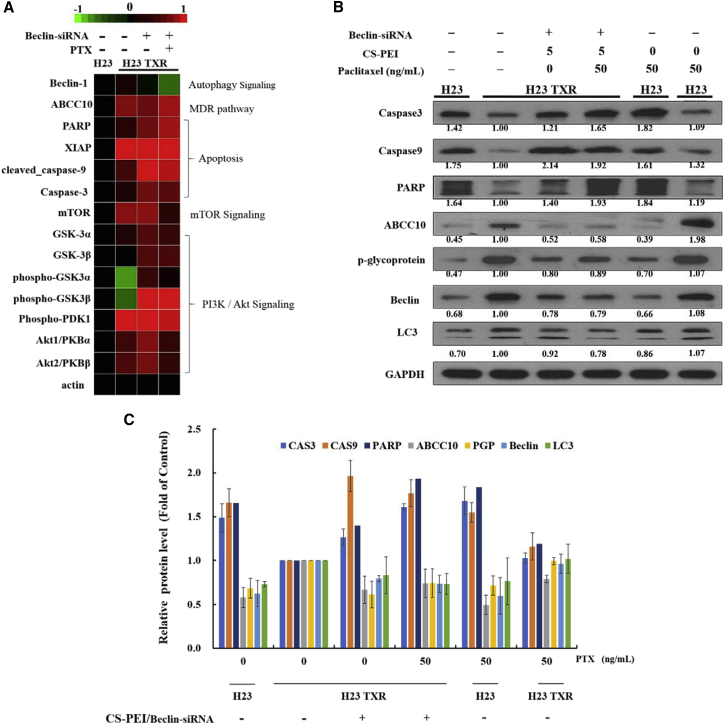
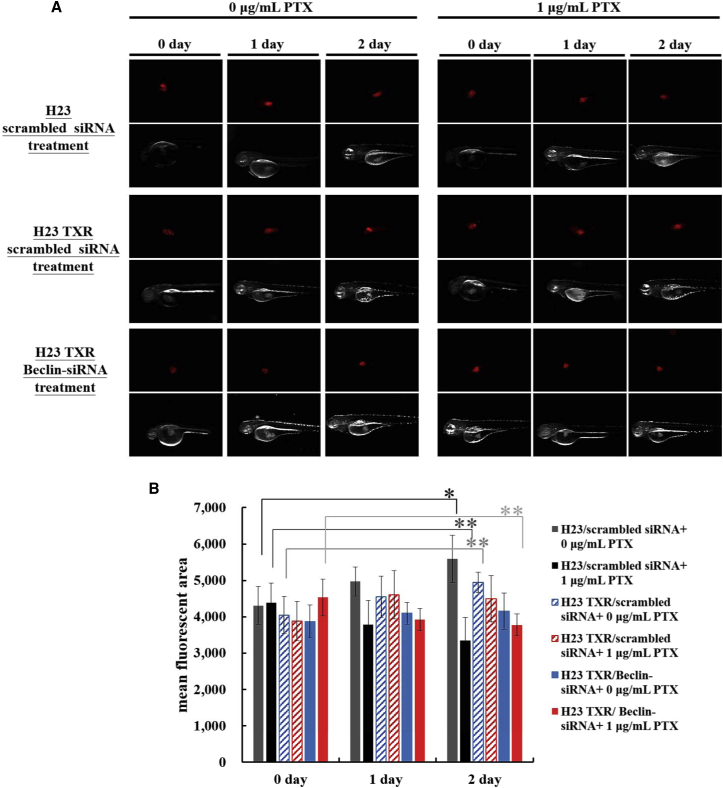
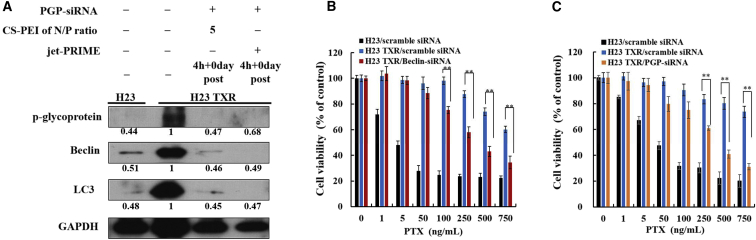
Paclitaxel (PTX) is a widely used chemotherapy drug; however, frequent use causes multidrug resistance (MDR), which limits the utility of PTX against advanced non-small-cell lung cancer (NSCLC). PTX-resistant subline (NCI-H23-TXR) was established in vitro by exposing NCI-H23 cells to gradually increased concentrations of PTX in culture medium. Distinct Beclin expression of autophagy level was observed between resistant NCI-H23-TXR and parental NCI-H23 cells. Beclin-small interfering RNA (siRNA) was selected to restore sensitivity of PTX against NCI-H23-TXR. Chondroitin sulfate-polyethylenimine (CS-PEI) was constructed for delivery and protection of Beclin-siRNA. To delineate the underlying molecular mechanism of Beclin knockdown, we analyzed different MDR expression proteins of two cells using western blot, and the corresponding genes were confirmed by real-time PCR. Compared with NCI-H23, NCI-H23-TXR had higher expression levels in P-glycoprotein (P-gp) and multidrug resistance protein 7 (ABCC10). Knockdown of Beclin simultaneously inhibited P-gp and ABCC10, and renewed the sensitivity of PTX against NCI-H23-TXR. Research on zebrafish embryos revealed that tumor sizes decreased in NCI-H23 tumor xenografts but remained intact in NCI-H23-TXR tumor xenografts as zebrafish were treated with 1 μg/mL PTX. In contrast, the tumor sizes decreased in NCI-H23-TXR tumor xenografts with zebrafish pre-transfected with CS-PEI/Beclin-siRNA followed by the same treatment of PTX. The role of autophagy was associated with MDR development. This study paves the way for a new avenue of PTX in MDR-related lung cancer therapy using CS-PEI as a gene delivery carrier.

Keywords: Beclin-siRNA; MDR; PTX; autophagy; multidrug resistance; non-viral gene delivery vector; paclitaxel.


Figures

Figure 1
Figure 1
Characterizing Differences between Paclitaxel-Resistant NCI-H23-TXR Cells and Parental NCI-H23 Cells (A) Relative cell viabilities of cells exposed to various PTX concentrations (1–1,500 ng/mL) for 3-day incubation at 37°C using MTT assay (n = 8). (B) Expression levels of autophagy-related proteins in cells. (C) Expression levels of MDR-related proteins, P53, and survivin in cells. Cell lysates were extracted, and protein expression was detected by western blot. GAPDH was used as an internal control for equal loading.
Figure 2
Figure 2
Knockdown Efficiency of siRNA Using CS-PEI as a Vector (A) Internalization of a polyplex into NCI-H23 and NCI-H23-TXR cells. The polyplex was prepared from FITC-conjugated CS-PEI and scrambled siRNA at N/P = 5. Green fluorescence intensities of CS-PEI-FITC/siRNA polyplex in cells were detected at 4-h incubation using flow cytometry. (B) CLSM images of NCI-H23 and NCI-H23-TXR cells exposed to CS-PEI-FITC/siRNA polyplex at N/P = 5 for 4 h. Green: FITC-conjugated CS-PEI; blue: DAPI-stained cell nuclei. (C) Western blot analysis of autophagy- and MDR-related protein expression levels of cells with different treatments. NCI-H23-TXR cells were transfected with CS-PEI/Beclin-siRNA at N/P = 5 for 4 h followed by 0, 1, and 2 days post-incubation. Cell lysates were extracted and detected by western blot. Protein ratios were calculated from western blot images using ImageJ software and compared with NCI-H23 TXR cells. GAPDH was used as an internal control for equal loading. (D) Relative mRNA levels of gene expression of Beclin, P-glycoprotein, and ABCC10 in siRNA-treated cells using quantitative real-time PCR. Levels of mRNA were normalized to endogenous GAPDH gene and presented with a mean value ± SD. The mean values were obtained from three different independent experiments, and statistical analysis was performed using the two-tailed Student’s t test (n = 3; *p < 0.05, **p < 0.01).
Figure 3
Figure 3
Levels of Beclin Expression and Cytotoxicity of Cells Treated with siRNA in a Post Time-Dependent Manner (A) Western blot analysis of Beclin protein expression level of cells. NCI-H23 cells were transfected with CS-PEI/scramble siRNA at N/P = 5 or jet-PRIME/scramble siRNA; NCI-H23-TXR cells were transfected with CS-PEI/Beclin-siRNA at N/P = 5 or jet-PRIME/Beclin-siRNA for 4 h followed by 0, 1, and 2 days post-incubation. Cell lysates were extracted, and protein expression was detected by western blot. Protein expression levels were calculated from western blot images using ImageJ software, and the ratios were obtained relative to the control group (untreated cells). GAPDH was used as an internal control for equal loading. (B) In vitro cytotoxicity analysis of siRNA carried by different transfection agents using MTT assay. Cells were treated with Beclin-siRNA carried by different transfection agents for 4-h incubation. CS-PEI/siRNA was prepared at N/P = 5. Lipofectamine 2000/siRNA and jet-PRIME/siRNA were prepared according to the manufacturer’s protocols. (C) Relative cell viabilities of cells treated with or without siRNA and exposed to various PTX concentrations for 3 days post-incubation using MTT assay. NCI-H23-TXR cells were transfected with CS-PEI/Beclin-siRNA at N/P = 5 for 4 h and subsequently treated with various concentrations of paclitaxel (1–750 ng/mL) at post-incubation days 0, 1, and 2. Statistical analysis was performed using the two-tailed Student’s t test (n = 8; *p < 0.05, **p < 0.01, ***p < 0.001).
Figure 4
Figure 4
Localization and Quantification of Autophagy-Related Proteins (A) CLSM images of Beclin and LC3 expression in CS-PEI/siRNA-transfected NCI-H23-TXR cells at N/P = 5 for 4 h. After incubation, cells were stained with anti-Beclin and anti-LC3 antibody using an immunofluorescence staining method. Red: Beclin expression; green: LC3 expression; blue: DAPI-stained cell nuclei. Scale bar, 20 μm. (B) Relative fluorescence intensities of Beclin and LC3 calculated from the immunofluorescence staining images using ZEISS ZEN Microscope software and compared with those of NCI-H23 cells. Statistical analysis was performed using the two-tailed Student’s t test (n = 3; *p < 0.05, **p < 0.01).
Figure 5
Figure 5
Induction of Apoptosis in NCI-H23 and NCI-H23-TXR Cells Exposed to Various Concentrations of Paclitaxel (PTX) (A) Annexin V-PI (propidium iodide) dual-staining assay by flow cytometry analysis. Cells were transfected with CS-PEI/siRNA at N/P = 5 for 4 h followed by treatments with various concentrations of PTX (0, 250, and 500 ng/mL). After 3 days of incubation in PTX, the treated cells were collected and co-stained with Annexin and PI dye. The results were acquired from each sample consisting of 10,000 cells using flow cytometry. The values in the upper left quadrant (Q1), upper right quadrant (Q2), lower right quadrant (Q3), and lower left quadrant (Q4) represent the relative amount of necrotic, late apoptotic, early apoptotic, and live cells, respectively. (B) Percentages of apoptotic cells based on the results from (A) (n = 3). (C) Relative cell viabilities of cells treated with CS-PEI/Beclin-siRNA followed by exposure to various PTX concentrations for 3 days post-incubation. Statistical analysis was performed using the two-tailed Student’s t test (n = 8; *p < 0.05, **p < 0.01).
Figure 6
Figure 6
Regulation of Cell Proliferation Genes of NCI-H23 and NCI-H23-TXR Cells (A) Micro-western array analysis of gene expression. Target proteins in different signaling pathways such as apoptosis, mTOR, and PI3K/Akt were investigated on NCI-H23-TXR cells in response to CS-PEI/Beclin-siRNA transfection and paclitaxel (PTX) treatment. NCI-H23-TXR cells were transfected with CS-PEI/Beclin-siRNA at N/P = 5 for 4 h and subsequently treated with PTX at 50 ng/mL for 1 day. Expression intensity levels were displayed on the top from green color (the lowest expression) to red color (the highest expression); black color indicates no change. Protein abundance was normalized to the average of actin. (B) Western blot analysis of autophagy-, MDR-, and apoptosis-related protein expression levels of cells with different treatments. Cell lysates were extracted from siRNA-transfected and PTX-treated cells, and protein expression was detected by western blot. GAPDH was used as an internal control for equal loading. Protein expression levels were calculated from western blot images using ImageJ software, and the ratios were obtained relative to NCI-H23 TXR cells. (C) Relative protein expression levels obtained from three different independent experiments in bar graphs (n = 3).
Figure 7
Figure 7
Paclitaxel (PTX) Inhibition on Tumor Growth in Zebrafish Tumor-Xenograft Model (A) Fluorescent images of zebrafish tumors treated with or without PTX. The siRNA-transfected cells were pre-stained with PKH26 red fluorescent dye for clear observation. Labeled cells were injected into zebrafish using a single injection with ∼850 cells per embryo. After zebrafish were treated with or without PTX dissolved in aerated water containing 1× phenylthiourea for various days (0–2 days), the fluorescent images of tumor sites were observed using fluorescent microscopy. (B) Tumor growth inhibition is presented in the bar graphs. Mean fluorescent areas of tumor sites in zebrafish were analyzed using ImageJ software, and statistical analysis was performed using the two-tailed Student’s t test (n = 30; *p < 0.05, **p < 0.01).
Figure 8
Figure 8
Downregulation of Protein Expression in Cells Treated with CS-PEI/P-Glycoprotein siRNA (A) P-glycoprotein (PGP) expression levels of NCI-H23 cells and NCI-H23-TXR cells analyzed by western blot. NCI-H23-TXR cells were transfected with CS-PEI/PGP siRNA at N/P = 5 and jet-PRIME/PGP siRNA for 4 h. Cell lysates were extracted from siRNA-transfected cells, and protein expression was detected using western blot. Protein ratios were calculated from western blot images using ImageJ software relative to NCI-H23 TXR cells. GAPDH was used as an internal control for equal loading. (B and C) Relative cell viabilities of cells exposed to different CS-PEI/siRNA polyplexes at N/P = 5 for 4 h and subsequently treated with various concentrations of paclitaxel (1–750 ng/mL) for 3 days post-incubation. The cells were treated with (B) CS-PEI/Beclin-siRNA and (C) CS-PEI/PGP-siRNA. Statistical analysis was performed using the two-tailed Student’s t test (n = 8; *p < 0.05, **p < 0.01).

Similar articles

Cited by

References

    1. Yeh J.J., Hsu W.H., Wang J.J., Ho S.T., Kao A. Predicting chemotherapy response to paclitaxel-based therapy in advanced non-small-cell lung cancer with P-glycoprotein expression. Respiration. 2003;70:32–35. - PubMed
    1. Kim Y.D., Park T.E., Singh B., Maharjan S., Choi Y.J., Choung P.H., Arote R.B., Cho C.S. Nanoparticle-mediated delivery of siRNA for effective lung cancer therapy. Nanomedicine (Lond.) 2015;10:1165–1188. - PubMed
    1. Georgiadis M.S., Russell E.K., Gazdar A.F., Johnson B.E. Paclitaxel cytotoxicity against human lung cancer cell lines increases with prolonged exposure durations. Clin. Cancer Res. 1997;3:449–454. - PubMed
    1. Wang L., Li H., Ren Y., Zou S., Fang W., Jiang X., Jia L., Li M., Liu X., Yuan X. Targeting HDAC with a novel inhibitor effectively reverses paclitaxel resistance in non-small cell lung cancer via multiple mechanisms. Cell Death Dis. 2016;7:e2063. - PMC - PubMed
    1. Shimomura M., Yaoi T., Itoh K., Kato D., Terauchi K., Shimada J., Fushiki S. Drug resistance to paclitaxel is not only associated with ABCB1 mRNA expression but also with drug accumulation in intracellular compartments in human lung cancer cell lines. Int. J. Oncol. 2012;40:995–1004. - PMC - PubMed

LinkOut - more resources