. 2019 Jul 22;8(7):1077.
doi: 10.3390/jcm8071077.

Compensatory Neural Recruitment for Error-Related Cerebral Activity in Patients with Moderate-To-Severe Obstructive Sleep Apnea

Affiliations

Compensatory Neural Recruitment for Error-Related Cerebral Activity in Patients with Moderate-To-Severe Obstructive Sleep Apnea

Ping-Song Chou et al. J Clin Med. .

Abstract

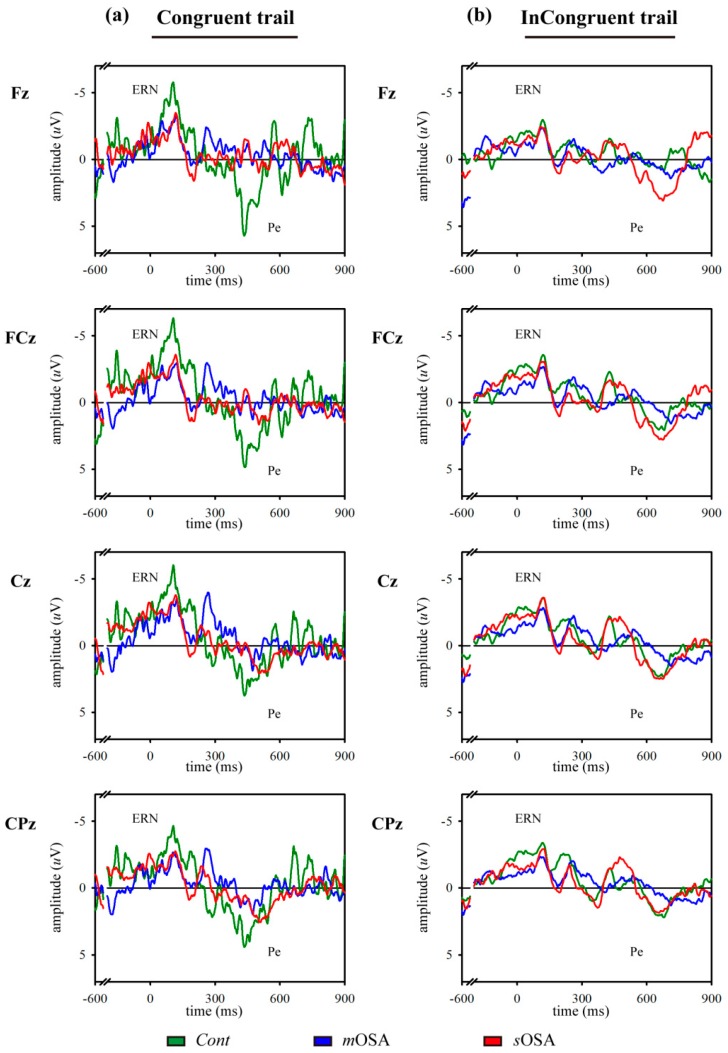
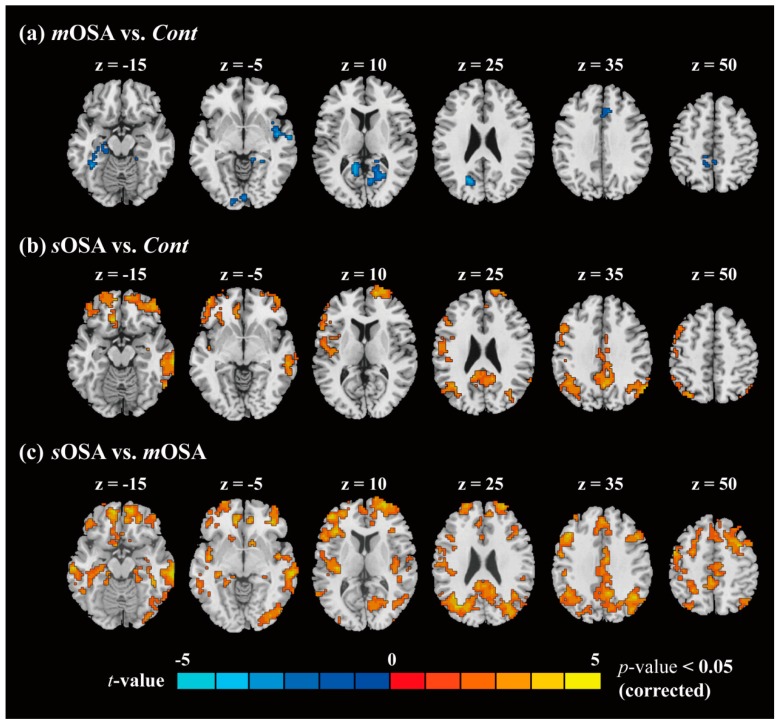
(1) Background: Although it is known that obstructive sleep apnea (OSA) impairs action-monitoring function, there is only limited information regarding the associated cerebral substrate underlying this phenomenon. (2) Methods: The modified Flanker task, error-related event-related potentials (ERPs), namely, error-related negativity (ERN) and error positivity (Pe), and functional magnetic resonance imaging (fMRI) were used to evaluate neural activities and the functional connectivity underlying action-monitoring dysfunction in patients with different severities of OSA. (3) Results: A total of 14 control (Cont) subjects, 17 patients with moderate OSA (mOSA), and 10 patients with severe OSA (sOSA) were enrolled. A significant decline in posterror correction rate was observed in the modified Flanker task when patients with mOSA were compared with Cont subjects. Comparison between patients with mOSA and sOSA did not reveal any significant difference. In the analysis of ERPs, ERN and Pe exhibited declined amplitudes in patients with mOSA compared with Cont subjects, which were found to increase in patients with sOSA. Results of fMRI revealed a decreased correlation in multiple anterior cingulate cortex functional-connected areas in patients with mOSA compared with Cont subjects. However, these areas appeared to be reconnected in patients with sOSA. (4) Conclusions: The behavioral, neurophysiological, and functional image findings obtained in this study suggest that mOSA leads to action-monitoring dysfunction; however, compensatory neural recruitment might have contributed to the maintenance of the action-monitoring function in patients with sOSA.

Keywords: action monitoring; error positivity; error-related negativity; functional magnetic resonance imaging; modified Flanker task; obstructive sleep apnea.


Conflict of interest statement

The authors declare no conflict of interest.

Figures

Figure 1
Figure 1
Signals of event-related potentials to error response in congruent (a) and incongruent (b) trials. Two tasking trials and four channels are demonstrated in the three groups. Results of the Cont, mOSA, and sOSA groups are presented in green, blue, and red, respectively. The amplitudes of ERN and Pe decreased in mOSA compared with Cont. In sOSA, the amplitudes of ERN and Pe increased compared with mOSA. A compensatory neural recruitment for action-monitoring dysfunction during the transition from mOSA to sOSA is observed. Abbreviations: Cont, Control group; mOSA, moderate OSA group; sOSA, severe OSA group; OSA, obstructive sleep apnea; ERN, error-related negativity; PE, error positivity.
Figure 2
Figure 2
Differences in functional connection between pairs of two groups. Two-sample t-tests were performed on the functional connectivity data to assess the cognitive influence between all pairs of two groups as follows: (a) mOSA vs. Cont; (b) sOSA vs. Cont; (c) sOSA vs. mOSA. The contrast activations are below the level of statistical significance (p < 0.05). Abbreviations: Cont, Control group; mOSA, moderate OSA group; sOSA, severe OSA group; OSA, obstructive sleep apnea.
Figure 3
Figure 3
Functional comparison across groups for regions of the ACC (a), the precuneus (b), and the SMA (c). The activated regions shown in the figure were selected based on functional differences between the mOSA and sOSA groups. One-way ANOVA was performed, and the p values in each full model were 0.003, 0.004, and 0.014 for the ACC, the precuneus, and the SMA, respectively. Abbreviations: Cont, Control group; mOSA, moderate OSA group; sOSA, severe OSA group; OSA, obstructive sleep apnea; ACC, anterior cingulate cortex; SMA, supplementary motor area.
Figure 4
Figure 4
Interactive relationship among the ACC, the precuneus, and the SMA for each group. The thickness of the line denotes the influence between two regions, and the direction of the arrow shows the affective direction from a region to the end of the arrowed region with the impact value. In the Cont group (a), the three regions are connected by balanced weights. In patients with mOSA (b), the connectivity to the other two regions for the ACC was reduced, and the network balance is tilted toward the connections between the SMA and the precuneus. In patients with sOSA (c), the ACC showed increased interactive connectivity to the precuneus, and thus the connection weight is tilted toward the connection of the ACC and the precuneus. This indicates that the pattern of functional connectivity alternates with the severity of OSA, and reflect the vital role of the ACC in the action-monitoring function. Abbreviation: Cont, Control group; mOSA, moderate OSA group; sOSA, severe OSA group; ACC, anterior cingulate cortex; SMA, supplementary motor area; preCue, precuneus; OSA, obstructive sleep apnea.
Figure 5
Figure 5
Scattering plot of PSG parameters and functional connectivity. Three regions of interest—the ACC (a,d,g), the precuneus (b,e,h), and the SMA (c,f,i), are demonstrated in each column, and three PSG parameters, including the AHI (ac), the arousal index (df), and SpO2 (<90%) (gi), are presented in each row. Curve fitting was performed with quadratic regression across patients. The fitness value of all the curves was expressed with the correlation intensity. Functional connectivity and PSG parameters exhibited good fitness with a quadratic regression across patients, particularly for the parameter AHI. The tendency of the distribution implied that functional connectivity would become stronger from mOSA to sOSA, and that it would decline when the OSA symptom worsened. Abbreviation: AHI, apnea-hypopnea index; FC, functional connectivity; Cont, Control group; mOSA, moderate OSA group; sOSA, severe OSA group; ACC, anterior cingulate cortex; SMA, supplementary motor area; OSA, obstructive sleep apnea; PSG, polysomnography.

Similar articles

Cited by

References

    1. Mannarino M.R., Di Filippo F., Pirro M. Obstructive sleep apnea syndrome. Eur. J. Int. Med. 2012;23:586–593. doi: 10.1016/j.ejim.2012.05.013. - DOI - PubMed
    1. Beebe D.W., Gozal D. Obstructive sleep apnea and the prefrontal cortex: Towards a comprehensive model linking nocturnal upper airway obstruction to daytime cognitive and behavioral deficits. J. Sleep Res. 2002;11:1–16. doi: 10.1046/j.1365-2869.2002.00289.x. - DOI - PubMed
    1. Lal C., Strange C., Bachman D. Neurocognitive impairment in obstructive sleep apnea. Chest. 2012;141:1601–1610. doi: 10.1378/chest.11-2214. - DOI - PubMed
    1. Lim D.C., Pack A.I. Obstructive sleep apnea and cognitive impairment: Addressing the blood-brain barrier. Sleep Med. Rev. 2014;18:35–48. doi: 10.1016/j.smrv.2012.12.003. - DOI - PMC - PubMed
    1. Bucks R.S., Olaithe M., Eastwood P. Neurocognitive function in obstructive sleep apnoea: A meta-review. Respirology. 2013;18:61–70. doi: 10.1111/j.1440-1843.2012.02255.x. - DOI - PubMed

LinkOut - more resources