. 2019 Jul 22;11(7):1029.
doi: 10.3390/cancers11071029.

CD56 Homodimerization and Participation in Anti-Tumor Immune Effector Cell Functioning: A Role for Interleukin-15

Affiliations

CD56 Homodimerization and Participation in Anti-Tumor Immune Effector Cell Functioning: A Role for Interleukin-15

Heleen H Van Acker et al. Cancers (Basel). .

Abstract

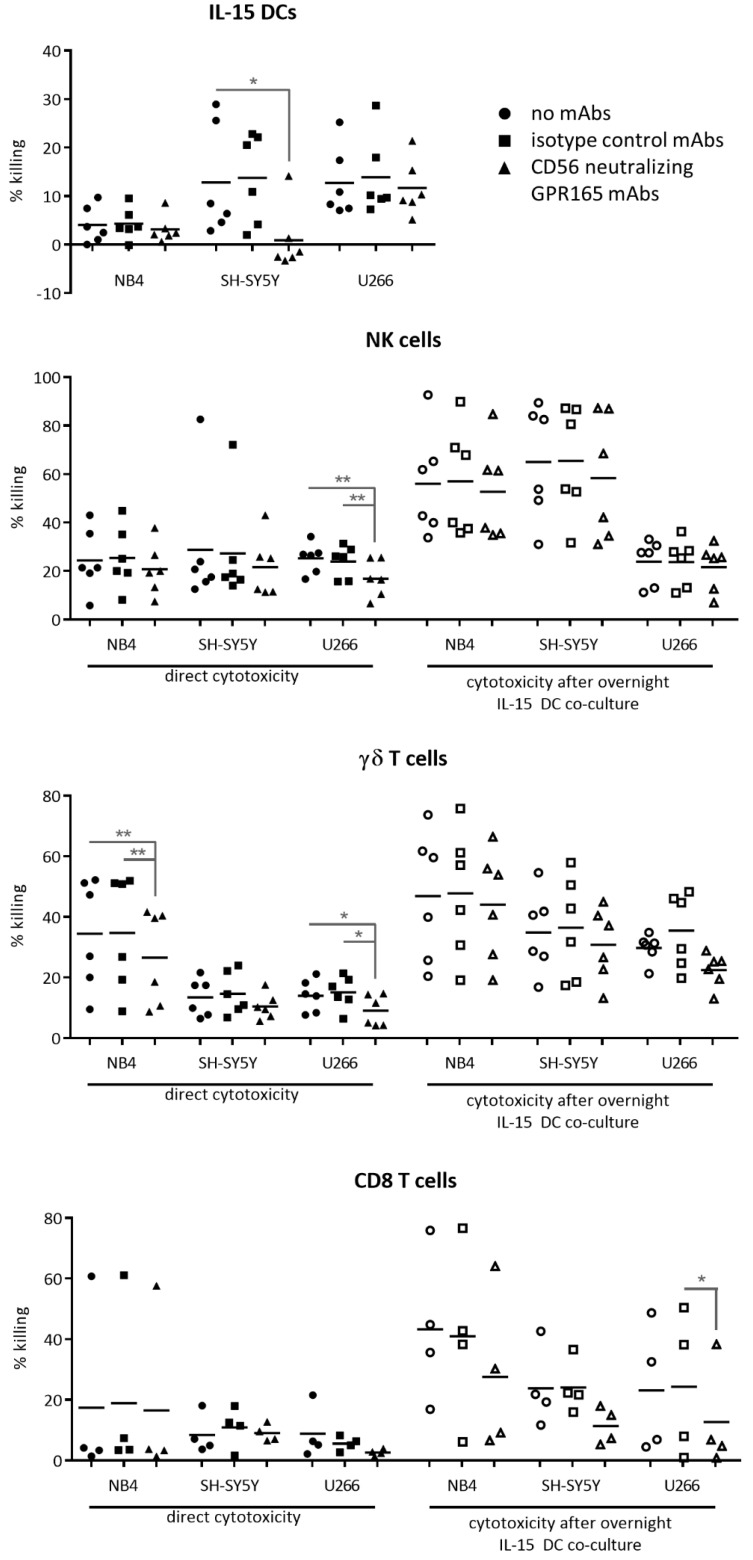
A particularly interesting marker to identify anti-tumor immune cells is the neural cell adhesion molecule (NCAM), also known as cluster of differentiation (CD)56. Namely, hematopoietic expression of CD56 seems to be confined to powerful effector immune cells. Here, we sought to elucidate its role on various killer immune cells. First, we identified the high motility NCAM-120 molecule to be the main isoform expressed by immune cells. Next, through neutralization of surface CD56, we were able to (1) demonstrate the direct involvement of CD56 in tumor cell lysis exerted by CD56-expressing killer cells, such as natural killer cells, gamma delta (γδ) T cells, and interleukin (IL)-15-cultured dendritic cells (DCs), and (2) reveal a putative crosstalk mechanism between IL-15 DCs and CD8 T cells, suggesting CD56 as a co-stimulatory molecule in their cell-to-cell contact. Moreover, by means of a proximity ligation assay, we visualized the CD56 homophilic interaction among cancer cells and between immune cells and cancer cells. Finally, by blocking the mitogen-activated protein kinase (MAPK) pathway and the phosphoinositide 3-kinase (PI3K)-Akt pathway, we showed that IL-15 stimulation directly led to CD56 upregulation. In conclusion, these results underscore the previously neglected importance of CD56 expression on immune cells, benefiting current and future immune therapeutic options.

Keywords: CD56 homodimers; NCAM-120; common gamma-chain family; interleukin-15 signaling; tumor cell eradication.


Conflict of interest statement

The authors declare no conflict of interest.

Figures

Figure 1
Figure 1
Cluster of differentiation (CD)56 (isotype) expression by different immune cell subsets. Juxtaposition of the percentage CD56 expression on different immune cell subsets as determined by flow cytometry (left y-axis) and CD56 isoform (120–140–180 kD) mRNA expression (scaled to average) determined by qPCR (right y-axis). Data from five donors are represented as scatter plots. One-way ANOVA with Bonferroni’s multiple comparison test or Friedman test with Dunn’s multiple comparison test was used. *** p < 0.001; ** p < 0.01; * p < 0.5.
Figure 2
Figure 2
Cluster of differentiation (CD)56 expression by human tumor cell lines. (A) Flow cytometric analysis of tumor cells labelled with CD56-PE (black line) or corresponding isotype control (filled grey), represented as histogram overlays. (B) Real-time qPCR data of the expression levels of the different CD56 isoforms by NB4, U266 (left y-axis) and SH-SY5Y (right y-axis). Fold-changes are scaled to average. Each bar is the mean ± standard error of the mean (SEM) of technical replicates (n = 2).
Figure 3
Figure 3
Involvement of Cluster of differentiation (CD)56 in immune effector cell activation and tumor cell killing. Immune cell cytotoxicity was defined against the cell lines NB4, SH-SY5Y, and U266, unstimulated and after overnight culture with interleukin (IL)-15 dendritic cells (DCs). Immune cells were cultured in medium without neutralizing monoclonal antibodies (mAbs) (circles) or in medium containing either CD56 neutralizing GPR165 mAbs (triangles) or its corresponding isotype control (squares) (n = 4–6, two independent experiments). One-way ANOVA with Bonferroni’s multiple comparison test or Friedman test with Dunn’s multiple comparison test. ** p < 0.01; * p < 0.5.
Figure 4
Figure 4
Image of a Duolink® in situ proximity ligation assay (PLA) showing Cluster of differentiation (CD)56 homodimer formation among tumor cells. Representative example of a SH-SY5Y-eGFP (green) culture (with natural killer cells (CD45; yellow)), mounted with 4′,6-diamidino-2-phenylindole (DAPI) (blue), whereby the CD56–CD56 interaction is visualized as red dots (n = 9). Scale bar: 20 µm.
Figure 5
Figure 5
Association of Cluster of differentiation (CD)56–CD56 interactions and the “kiss of death”—cytotoxic immunological synapse between immune cells and cancer cells. SH-SY5Y-eGFP cells (green) were co-cultured with immune effector cells (CD45; yellow), namely, interleukin (IL)-15 dendritic cells (DCs) (upper row, n = 3), natural killer cells (middle row, n = 3) or γδ T cells (bottom row, n = 3), and mounted with 4′,6-diamidino-2-phenylindole (DAPI) (blue). White arrows on the left overview images indicate a probable interface between immune cells and cancer cells (enlarged in the right column). The connection between both cell types is associated with an accumulation of red signal, being CD56 homodimerization. Scale bar: left column = 20 µm, right column = 5 µm.
Figure 6
Figure 6
Cluster of differentiation (CD)56 expression and kinetics following interleukin (IL)-15 stimulation. (A) CD56 surface expression on different immune cell subsets in fresh peripheral blood mononuclear cells (PBMCs) as determined by flow cytometry. Donors are represented by unique symbols (n = 8). (BD) PBMCs (1 × 10e6 cells/mL) were stimulated with 10 ng/mL recombinant IL-15. At different time points, the expression of CD56 was assessed flow cytometrically. (B) CD56 expression levels in mean fluorescence intensity (MFI), of CD56bright and CD56dim NK cells, were transformed to relative levels by the subtraction of the MFI of the fresh subset (n = 8). (CD) Monitoring of CD56 expression on the cell membranes of γδ T cells (circle), CD8 T cells (square), CD1c dendritic cells (DCs) (triangle), monocytes (diamond), and CD4 T cells (cross), both in % (C) and ΔMFI (MFI condition—MFI isotype control) (D). The evolution in CD56 expression is shown as a mean of 5 independent donors.
Figure 7
Figure 7
The effect of the selective inhibition of the interleukin (IL)-15 signaling pathways on Cluster of differentiation (CD)56 expression. Peripheral blood mononuclear cells (PBMCs) were cultured in IL-15 (10 ng/mL) containing medium (−) in the presence of CAS 285986-31-4 (1 µM; CAS), trametinib (1 µM; Tram) or afuresertib (2 µM; AF) for 48 hours (Natural killer (NK) cells, monocytes) or 1 week (γδ T cells, CD8 T cells). The percentage CD56-postive cells are shown, as determined by flow cytometry, as well as the ΔMFI) of CD56 calculated by subtracting the “background” MFI of the isotype control from the MFI of the sample. Concerning NK cells, the MFI of the IL-15 medium (−) control was subtracted from the MFI of the sample (rMFI). Data are represented as boxes and whiskers (10–90%) of 9 independent donors. One-way ANOVA with Bonferroni’s multiple comparison test or Friedman test with Dunn’s multiple comparison test were used. **** p < 0.0001; *** p < 0.001; ** p < 0.01; * p < 0.5.
Figure 8
Figure 8
Kinetics of Cluster of differentiation (CD)56 expression following interleukin (IL)-2, IL-15, and IL-21 stimulation. Peripheral blood mononuclear cells (PBMCs) were stimulated with IL-2 (200 IU/mL), IL-15 (10 ng/mL) or IL-21 (20 ng/mL) for different periods of time, after which CD56 expression was assessed by flow cytometry (analogous to the experimental design presented in Figure 5). The evolution in CD56 expression is shown as a mean of 3 independent donors. Statistical significance is shown as compared to IL-15-stimulated immune cells. One-way ANOVA with Bonferroni’s multiple comparison test or Friedman test with Dunn’s multiple comparison test were used. **** p < 0.0001; *** p < 0.001; ** p < 0.01; * p < 0.5.

Similar articles

Cited by

References

    1. Cunningham B.A., Hemperly J.J., Murray B.A., Prediger E.A., Brackenbury R., Edelman G.M. Neural cell adhesion molecule: Structure, immunoglobulin-like domains, cell surface modulation, and alternative RNA splicing. Science. 1987;236:799–806. doi: 10.1126/science.3576199. - DOI - PubMed
    1. Ditlevsen D.K., Povlsen G.K., Berezin V., Bock E. NCAM-induced intracellular signaling revisited. J. Neurosci. Res. 2008;86:727–743. doi: 10.1002/jnr.21551. - DOI - PubMed
    1. Van Acker H.H., Capsomidis A., Smits E.L., Van Tendeloo V.F. CD56 in the immune system: More than a marker for cytotoxicity? Front. Immunol. 2017;8:892. doi: 10.3389/fimmu.2017.00892. - DOI - PMC - PubMed
    1. Chou C., Li M.O. Tissue-resident lymphocytes across innate and adaptive lineages. Front. Immunol. 2018;9:2104. doi: 10.3389/fimmu.2018.02104. - DOI - PMC - PubMed
    1. Sangiolo D., Martinuzzi E., Todorovic M., Vitaggio K., Vallario A., Jordaney N., Carnevale-Schianca F., Capaldi A., Geuna M., Casorzo L., et al. Alloreactivity and anti-tumor activity segregate within two distinct subsets of cytokine-induced killer (CIK) cells: Implications for their infusion across major HLA barriers. Int. Immunol. 2008;20:841–848. doi: 10.1093/intimm/dxn042. - DOI - PubMed