. 2019 Jul 22;8(7):239.
doi: 10.3390/plants8070239.

Identification of Factors Linked to Higher Water-Deficit Stress Tolerance in Amaranthus hypochondriacus Compared to Other Grain Amaranths and A. hybridus, Their Shared Ancestor

Affiliations

Identification of Factors Linked to Higher Water-Deficit Stress Tolerance in Amaranthus hypochondriacus Compared to Other Grain Amaranths and A. hybridus, Their Shared Ancestor

Tzitziki González-Rodríguez et al. Plants (Basel). .

Abstract

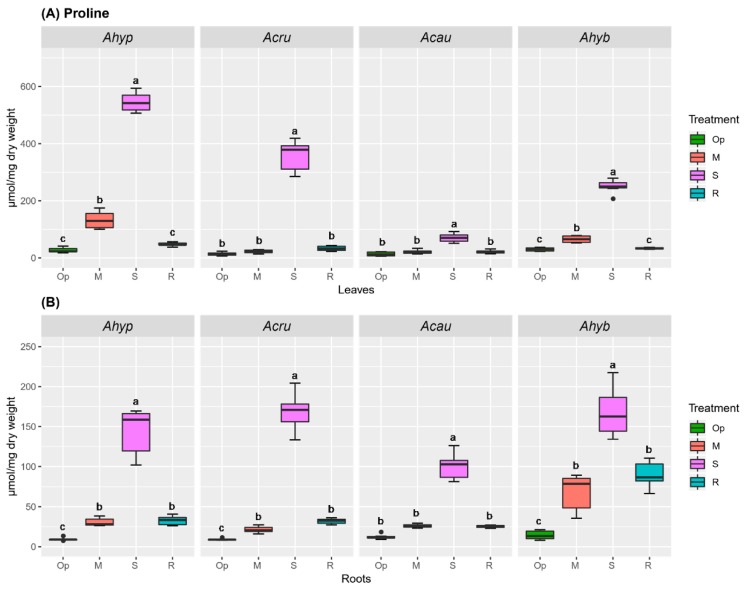
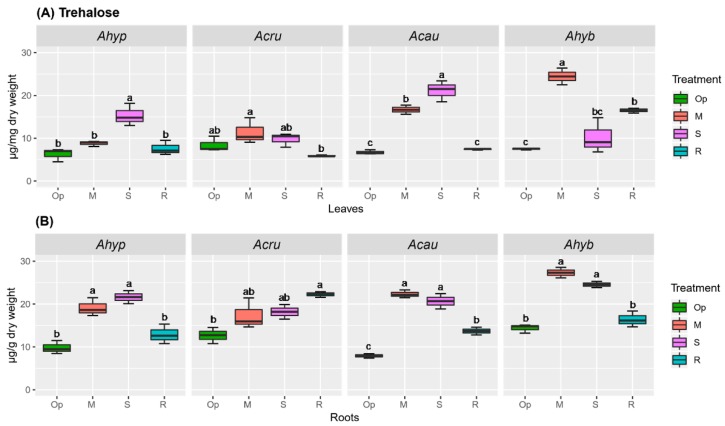
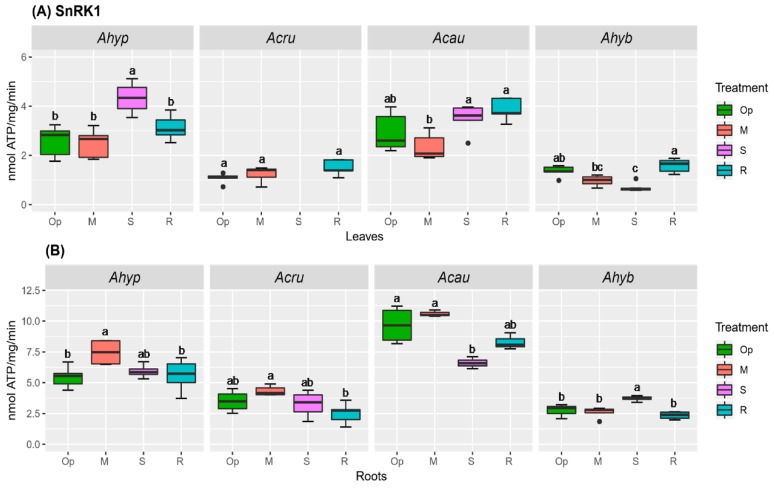
Water deficit stress (WDS)-tolerance in grain amaranths (Amaranthus hypochondriacus, A. cruentus and A. caudatus), and A. hybridus, their presumed shared ancestor, was examined. A. hypochondriacus was the most WDS-tolerant species, a trait that correlated with an enhanced osmotic adjustment (OA), a stronger expression of abscisic acid (ABA) marker genes and a more robust sugar starvation response (SSR). Superior OA was supported by higher basal hexose (Hex) levels and high Hex/sucrose (Suc) ratios in A. hypochondriacus roots, which were further increased during WDS. This coincided with increased invertase, amylase and sucrose synthase activities and a strong depletion of the starch reserves in leaves and roots. The OA was complemented by the higher accumulation of proline, raffinose, and other probable raffinose-family oligosaccharides of unknown structure in leaves and/or roots. The latter coincided with a stronger expression of Galactinol synthase 1 and Raffinose synthase in leaves. Increased SnRK1 activity and expression levels of the class II AhTPS9 and AhTPS11 trehalose phosphate synthase genes, recognized as part of the SSR network in Arabidopsis, were induced in roots of stressed A. hypochondriacus. It is concluded that these physiological modifications improved WDS in A. hypochondriacus by raising its water use efficiency.

Keywords: Abscisic acid; grain amaranth; osmotic adjustment; sucrolytic enzymes; sugar starvation response; water-deficit stress tolerance.


Conflict of interest statement

The authors declare no conflict of interest.

Figures

Figure 1
Figure 1
Non-structural carbohydrates in leaves of amaranth plants subjected to water-deficit stress. (A) Glucose, (B) fructose, (C) sucrose and (D) starch content in leaves of Amaranthus hypochondriacus (Ahypo), A. cruentus (Acru), A. caudatus (Acau) and A. hybridus (Ahyb) plants growing in optimal conditions (Op), subjected to moderate (M) or severe (S) water-deficit stress, or allowed to recover from S, 1 day after normal watering was restored (R). Different letters over the box-and-whisker plots represent statistically significant differences at p ≤ 0.05 (Tukey Kramer test; n = 9). Box-and-whisker plots show high, low, and median values. The results shown are those obtained from a representative experiment that was repeated in the spring-summer and summer-autumn seasons of 2015, respectively, with similar results.
Figure 2
Figure 2
Non-structural carbohydrates in roots of amaranth plants subjected to water-deficit stress. (A) Glucose, (B) fructose, (C) sucrose and (D) starch content in roots of Amaranthus hypochondriacus (Ahypo), A. cruentus (Acru), A. caudatus (Acau) and A. hybridus (Ahyb) plants growing in optimal conditions (Op), subjected to moderate (M) or severe (S) water-deficit stress, or allowed to recover from S, 1 day after normal watering was restored (R). Different letters over the box-and-whisker plots represent statistically significant differences at p ≤ 0.05 (Tukey Kramer test; n = 9). Box-and-whisker plots show high, low, and median values. The results shown are those obtained from a representative experiment that was repeated in the spring-summer and summer-autumn seasons of 2015, respectively, with similar results.
Figure 3
Figure 3
Invertase activity in leaves of amaranth plants subjected to water-deficit stress. (A) Cell wall invertase [CWI], (B) vacuolar invertase [VI], and (C) alkaline/neutral cytoplasmic invertase [CI] activities in leaves of Amaranthus hypochondriacus (Ahypo), A. cruentus (Acru), A. caudatus (Acau), and A. hybridus (Ahyb) plants growing in optimal conditions (Op), subjected to moderate (M) or severe (S) water-deficit stress, or allowed to recover from S, 1 day after normal watering was restored (R). Different letters over the box-and-whisker plots represent statistically significant differences at p ≤ 0.05 (Tukey Kramer test; n = 9). Box-and-whisker plots show high, low, and median values. The results shown are those obtained from a representative experiment that was repeated in the spring-summer and summer-autumn seasons of 2015, respectively, with similar results.
Figure 4
Figure 4
Invertase activity in roots of amaranth plants subjected to water-deficit stress. (A) Cell wall invertase [CWI], (B) vacuolar invertase [VI], and (C) alkaline/neutral cytoplasmic invertase [CI] activities in roots of Amaranthus hypochondriacus (Ahypo), A. cruentus (Acru), A. caudatus (Acau), and A. hybridus (Ahyb) plants growing in optimal conditions (Op), subjected to moderate (M) or severe (S) water-deficit stress, or allowed to recover from S, one day after normal watering was restored (R). Different letters over the box-and-whisker plots represent statistically significant differences at p ≤ 0.05 (Tukey Kramer test; n = 9). Box-and-whisker plots show high, low, and median values. The results shown are those obtained from a representative experiment that was repeated in the spring-summer and summer-autumn seasons of 2015, respectively, with similar results.
Figure 5
Figure 5
Sucrose synthase (SuSy) activity in roots of amaranth plants subjected to water-deficit stress. SuSy activity in roots of Amaranthus hypochondriacus (Ahypo), A. cruentus (Acru), A. caudatus (Acau), and A. hybridus (Ahyb) plants growing in optimal conditions (Op), subjected to moderate (M) or severe (S) water-deficit stress, or allowed to recover from S, 1 day after normal watering was restored (R). Different letters over the box-and-whisker plots represent statistically significant differences at p ≤ 0.05 (Tukey Kramer test; n = 9). Box-and-whisker plots show high, low, and median values. The results shown are those obtained from a representative experiment that was repeated in the spring-summer and summer-autumn seasons of 2015, respectively, with similar results.
Figure 6
Figure 6
Amylase activity in amaranth plants subjected to water-deficit stress. Amylase activity in (A) leaves and (B) roots of Amaranthus hypochondriacus (Ahypo), A. cruentus (Acru), A. caudatus (Acau) and A. hybridus (Ahyb) plants growing in optimal conditions (Op), subjected to moderate (M) or severe (S) water-deficit stress, or allowed to recover from S, 1 day after normal watering was restored (R). Different letters over the box-and-whisker plots represent statistically significant differences at p ≤ 0.05 (Tukey Kramer test; n = 9). Box-and-whisker plots show high, low, and median values. The results shown are those obtained from a representative experiment that was repeated in the spring-summer and summer-autumn seasons of 2015, respectively, with similar results.
Figure 7
Figure 7
Raffinose family oligosaccharides (RFOs) in leaves of amaranth plants subjected to water-deficit stress. RFOs in leaves of Amaranthus hypochondriacus (Ahypo), A. cruentus (Acru), A. caudatus (Acau), and A. hybridus (Ahyb) plants growing in optimal conditions (Op), subjected to moderate (M) or severe (S) water deficit stress, or allowed to recover from S, 1 day after normal watering was restored (R). RFOs and RFO precursors analyzed were: (A) Myo-inositol; (B) galactinol; (C) raffinose; (D) staquiose; and (E) verbascose. Different letters over the box-and-whisker plots represent statistically significant differences at p ≤ 0.05 (Tukey Kramer test; n = 9). Box-and-whisker plots show high, low, and median values. The results shown are those obtained from a representative experiment that was repeated in the spring-summer and summer-autumn seasons of 2015, respectively, with similar results.
Figure 8
Figure 8
Raffinose family oligosaccharides (RFOs) in roots of amaranth plants subjected to water-deficit stress. RFOs in roots of Amaranthus hypochondriacus (Ahypo), A. cruentus (Acru), A. caudatus (Acau), and A. hybridus (Ahyb) plants growing in optimal conditions (Op), subjected to moderate (M) or severe (S) water deficit stress, or allowed to recover from S, 1 day after normal watering was restored (R). RFOs and RFO precursors analyzed were: (A) Myo-inositol; (B) galactinol; (C) raffinose; (D) staquiose; and (E) verbascose. Different letters over the box-and-whisker plots represent statistically significant differences at p ≤ 0.05 (Tukey Kramer test; n = 9). Box-and-whisker plots show high, low, and median values. The results shown are those obtained from a representative experiment that was repeated in the spring-summer and summer-autumn seasons of 2015, respectively, with similar results.
Figure 9
Figure 9
Relative expression of genes involved in the biosynthesis of raffinose family oligosaccharides in (A) leaves and (B) roots of Amaranthus hypochondriacus (Ahypo), A. cruentus (Acru), A. caudatus (Acau), and A. hybridus (Ahyb) plants subjected to moderate (M) or severe (S) water deficit stress, or allowed to recover from S, 1 day after normal watering was restored (R). Induced (normalized expression values ≥ 1.5; in red) and repressed (normalized expression values ≤ 0.5; in blue) gene expression values, represented in a log10 basis, are highlighted with an asterisk at the upper left side of the cells. They were calculated according to the comparative cycle threshold method [28] using the AhACT7, AhEF1a and AhβTub5 amaranth genes for data normalization.
Figure 10
Figure 10
Proline (Pro) accumulation in amaranth plants subjected to water-deficit stress. Pro content in (A) leaves and (B) roots of Amaranthus hypochondriacus (Ahypo), A. cruentus (Acru), A. caudatus (Acau) and A. hybridus (Ahyb] plants growing in optimal conditions (Op), subjected to moderate (M) or severe (S) water deficit stress, or allowed to recover from S, 1 day after normal watering was restored (R). Different letters over the box-and-whisker plots represent statistically significant differences at p ≤ 0.05 (Tukey Kramer test; n = 9). Box-and-whisker plots show high, low, and median values. The results shown are those obtained from a representative experiment that was repeated in the spring-summer and summer-autumn seasons of 2015, respectively, with similar results.
Figure 11
Figure 11
Trehalose (Tre) accumulation in amaranth plants subjected to water-deficit stress. Tre content in (A) leaves and (B) roots of Amaranthus hypochondriacus (Ahypo), A. cruentus (Acru), A. caudatus (Acau) and A. hybridus (Ahyb) plants growing in optimal conditions (Op), or subjected to moderate (M) or severe (S) water deficit stress, or allowed to recover from S, 1 day after normal watering was restored (R). Different letters over the box-and-whisker plots represent statistically significant differences at p ≤ 0.05 (Tukey Kramer test; n = 9). Box-and-whisker plots show high, low, and median values. The results shown are those obtained from a representative experiment that was repeated in the spring-summer and summer-autumn seasons of 2015, respectively, with similar results.
Figure 12
Figure 12
Relative expression of genes involved in trehalose synthesis and degradation in (A) leaves and (B) roots of Amaranthus hypochondriacus (Ahypo), A. cruentus (Acru), A. caudatus (Acau), and A. hybridus (Ahyb) plants subjected to moderate (M) or severe (S) water deficit stress, or allowed to recover from S, 1 day after normal watering was restored (R). Induced (normalized expression values ≥ 1.5; in red) and repressed (normalized expression values ≤ 0.5; in blue) gene expression values, represented in a log10 basis, are highlighted with an asterisk at the upper left side of the cells. They were calculated according to the comparative cycle threshold method [28] using the AhACT7, AhEF1a and AhβTub5 amaranth genes for data normalization.
Figure 13
Figure 13
SnRK1 activity in amaranth plants subjected to water-deficit stress. SnRK1 activity in (A) leaves and (B) roots of Amaranthus hypochondriacus (Ahypo), A. cruentus (Acru), A. caudatus (Acau), and A. hybridus (Ahyb) of plants growing in optimal conditions (Op), subjected to moderate (M) or severe (S) water deficit stress, or allowed to recover from S, 1 day after normal watering was restored (R). Different letters over the box-and-whisker plots represent statistically significant differences at p ≤ 0.05 (Tukey Kramer test; n = 9). Box-and-whisker plots show high, low, and median values. The results shown are those obtained from a representative experiment that was repeated in the spring-summer and summer-autumn seasons of 2015, respectively, with similar results.
Figure 14
Figure 14
TOR activity in amaranth plants subjected to water-deficit stress. TOR activity in (A) leaves and (B) roots of Amaranthus hypochondriacus (Ahypo), A. cruentus (Acru), A. caudatus (Acau), and A. hybridus (Ahyb) in plants growing in optimal conditions (Op), subjected to moderate (M) or severe (S) water deficit stress, or allowed to recover from S, 1 day after normal watering was restored (R). Different letters over the box-and-whisker plots represent statistically significant differences at p ≤ 0.05 (Tukey Kramer test; n = 9). Box-and-whisker plots show high, low, and median values. The results shown are those obtained from a representative experiment that was repeated in the spring-summer and summer-autumn seasons of 2015, respectively, with similar results.
Figure 15
Figure 15
Relative expression of abscisic acid (ABA) marker genes in in (A) leaves and (B) roots of Amaranthus hypochondriacus (Ahypo), A. cruentus (Acru), A. caudatus (Acau), and A. hybridus (Ahyb) plants subjected to moderate (M) or severe (S) water deficit stress, or allowed to recover from S, 1 day after normal watering was restored (R). Induced (normalized expression values ≥ 1.5; in red) and repressed (normalized expression values ≤ 0.5; in blue) gene expression values, represented in a log10 basis, are highlighted with an asterisk at the upper left side of the cells. They were calculated according to the comparative cycle threshold method [28] using the AhACT7, AhEF1a and AhβTub5 amaranth genes for data normalization.

References

    1. Janiak A., Kwaśniewski M., Szarejko I. Gene expression regulation in roots under drought. J. Exp. Bot. 2016;67:1003–1014. doi: 10.1093/jxb/erv512. - DOI - PubMed
    1. Joshi R., Wani S.H., Singh B., Bohra A., Dar Z.A., Lone A.A., Pareek A., Singla-Pareek S.L. Transcription factors and plants response to drought stress: Current understanding and future directions. Front. Plant Sci. 2016;7:1029. doi: 10.3389/fpls.2016.01029. - DOI - PMC - PubMed
    1. Tardieu F. Too many partners in root-shoot signals. Does hydraulics qualify as the only signal that feeds back over time for reliable stomatal control? New Phytol. 2016;212:802–804. doi: 10.1111/nph.14292. - DOI - PubMed
    1. Yoshida T., Mogami J., Yamaguchi-Shinozaki K. ABA-dependent and ABA-independent signaling in response to osmotic stress in plants. Curr. Opin. Plant Biol. 2014;21:133–139. doi: 10.1016/j.pbi.2014.07.009. - DOI - PubMed
    1. Bhargava S., Sawant K. Drought stress adaptation: Metabolic adjustment and regulation of gene expression. Plant Breed. 2013;132:21–32. doi: 10.1111/pbr.12004. - DOI

LinkOut - more resources