. 2019 Jul 11;11(7):972.
doi: 10.3390/cancers11070972.

Proteomic Analysis of Breast Cancer Resistance to the Anticancer Drug RH1 Reveals the Importance of Cancer Stem Cells

Affiliations

Proteomic Analysis of Breast Cancer Resistance to the Anticancer Drug RH1 Reveals the Importance of Cancer Stem Cells

Dalius Kuciauskas et al. Cancers (Basel). .

Abstract

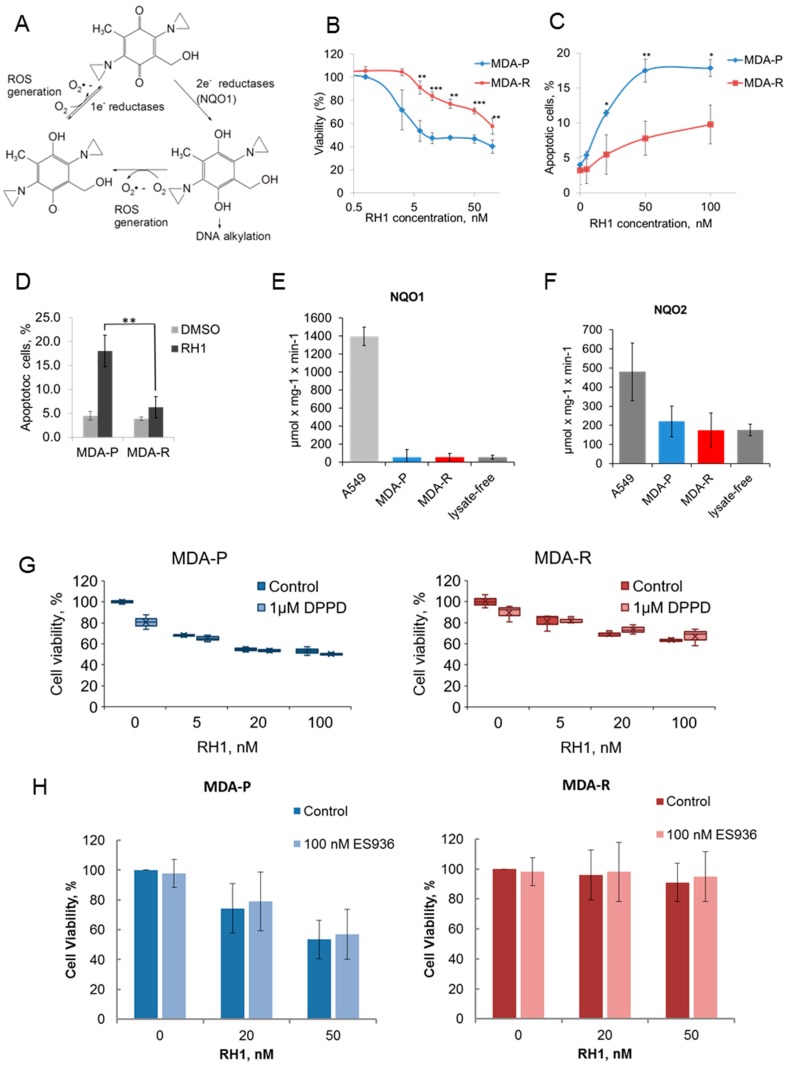
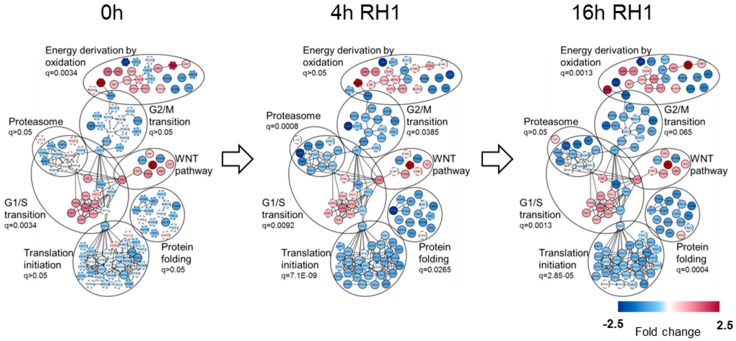
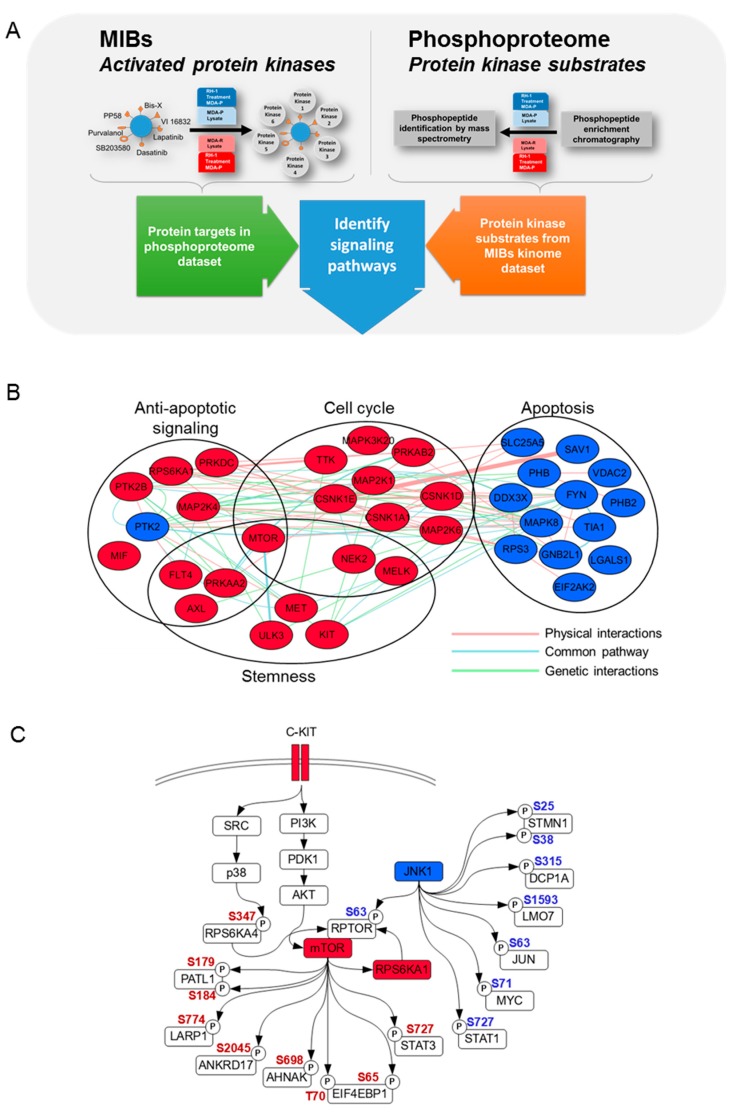
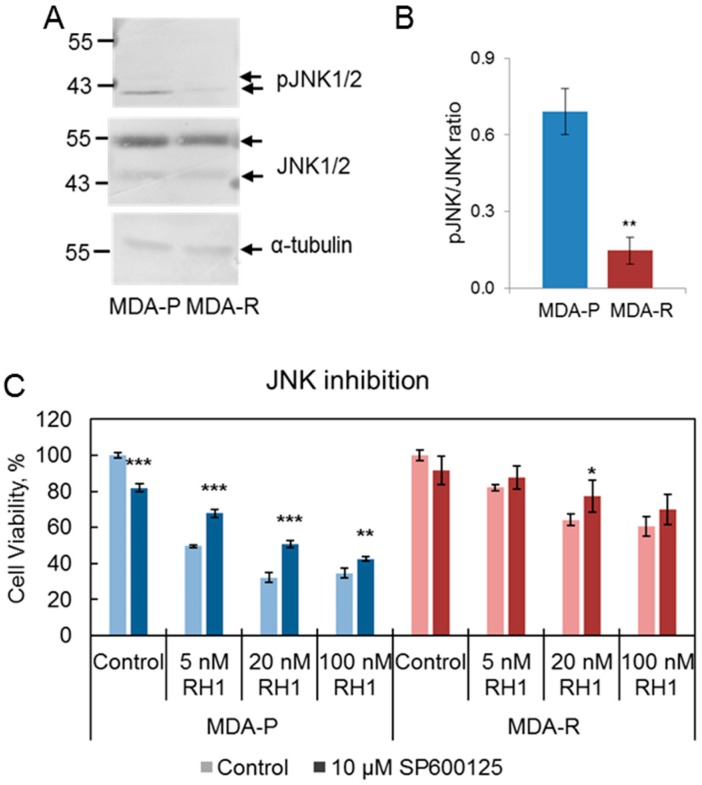
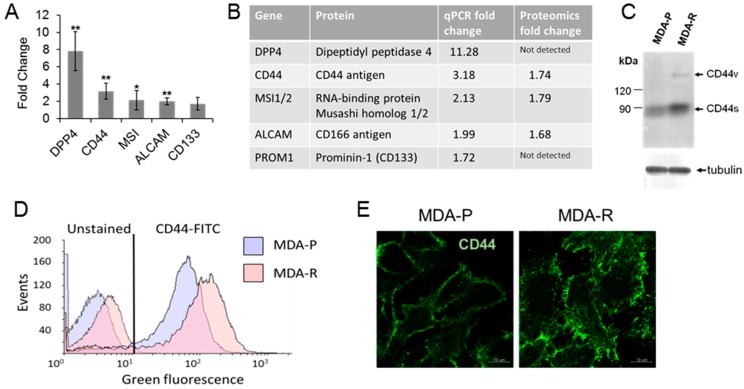
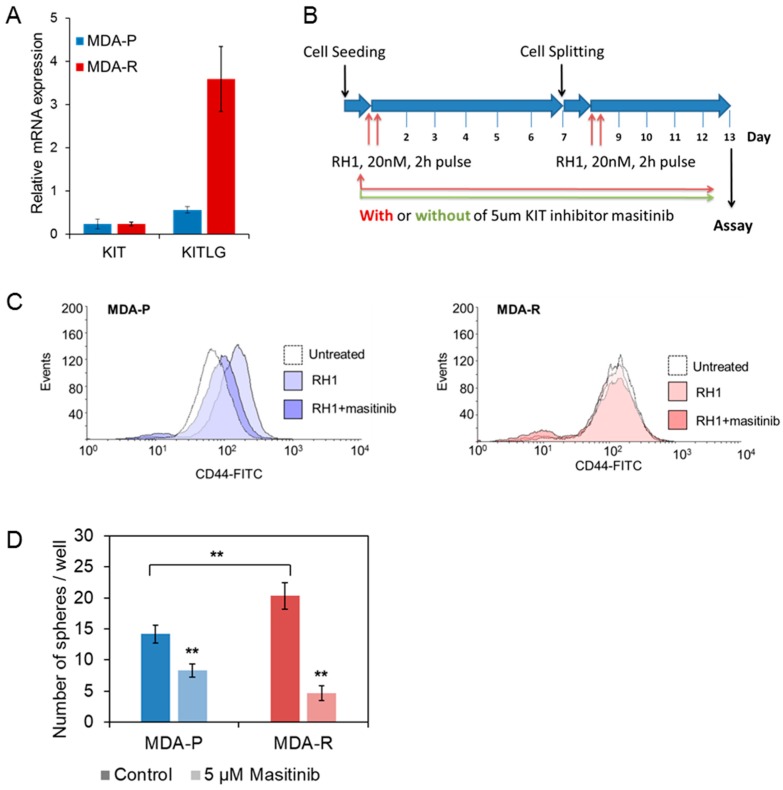
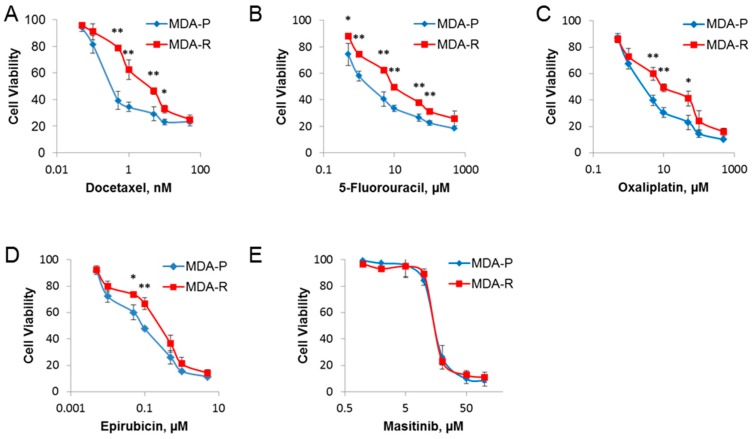
Antitumor drug resistance remains a major challenge in cancer chemotherapy. Here we investigated the mechanism of acquired resistance to a novel anticancer agent RH1 designed to be activated in cancer cells by the NQO1 enzyme. Data show that in some cancer cells RH1 may act in an NQO1-independent way. Differential proteomic analysis of breast cancer cells with acquired resistance to RH1 revealed changes in cell energy, amino acid metabolism and G2/M cell cycle transition regulation. Analysis of phosphoproteomics and protein kinase activity by multiplexed kinase inhibitor beads showed an increase in the activity of protein kinases involved in the cell cycle and stemness regulation and downregulation of proapoptotic kinases such as JNK in RH1-resistant cells. Suppression of JNK leads to the increase of cancer cell resistance to RH1. Moreover, resistant cells have enhanced expression of stem cell factor (SCF) and stem cell markers. Inhibition of SCF receptor c-KIT resulted in the attenuation of cancer stem cell enrichment and decreased amounts of tumor-initiating cells. RH1-resistant cells also acquire resistance to conventional therapeutics while remaining susceptible to c-KIT-targeted therapy. Data show that RH1 can be useful to treat cancers in the NQO1-independent way, and targeting of the cancer stem cells might be an effective approach for combating resistance to RH1 therapy.

Keywords: JNK; MIBs; RH1; c-KIT; cancer drug resistance; cancer stem cells; chemotherapy; label-free proteomics; phosphoproteome; protein kinases.


Conflict of interest statement

The authors declare no conflict of interest.

Figures

Figure 1
Figure 1
Characterization of RH1 resistant cells. (A). Molecular mechanism of the prodrug RH1 bioreduction. (B). Viability test. MDA-P and MDA-R cells were treated with increasing concentrations of RH1 for 2 h. Cell survival after 96 h was estimated by MTT assay. Bars are ± SD, significant differences are marked by asterisks: ** p < 0.05, *** p < 0.01, t-test, n = 3. (C). Apoptosis assay. MDA-P and MDA-R cells were exposed to increasing concentrations of RH1 for 2 h and then cultured in drug-free medium for another 48 h. Apoptosis was assayed using acridine orange/ethidium bromide staining. Bars are ± SD, significant differences are marked by asterisks: * p < 0.1, ** p < 0.05, t-test, n = 3. (D). Quantification of flow cytometric nexin-based apoptosis assay. Cells were untreated or treated with 50 nM RH1 for 2 h and stained with Guava Nexin reagent after 48 h. Bars are ± SD, significant difference is marked by asterisks: ** p < 0.05, t-test, n = 3. (E). NQO1 activity assay. The initial rate of RH1 reduction using NADPH cofactor represents NQO1 activity in the cell lysates where cell lysate of A549 cells is acting as a positive control. Bars are ± SD, differences between A549 as a positive control and other samples are significant (p < 0.01), n = 3. (F). NQO2 activity assay. The initial rate of RH1 reduction using NMEH cofactor represents NQO2 activity in the cell lysates. Bars are ± SD, difference between A549 as a positive control and other samples are significant (p < 0.01), n = 3. (G). MDA-P and MDA-R were treated with RH1 in the presence or absence of antioxidant DPPD. Cell survival after 96 h was estimated by MTT assay. Bars are ± SD. (H). MDA-P and MDA-R were treated with RH1 in the presence or absence of NQO1 inhibitor ES936. Cell survival after 96 h was estimated by MTT assay. Bars are ± SD.
Figure 2
Figure 2
Functional analysis of global proteome dynamic changes between MDA-P and MDA-R cells. MDA-P and MDA-R cells, untreated or treated with 20 nM RH1 for 2 h followed by 2 or 14 h recovery period (4 and 16 h from the beginning of treatment respectively), were subjected to in-depth quantitative proteomic analysis. Protein differential expression, interaction and functional annotation network was built by means of Cytoscape software with GeneMANIA application. The main functional clusters with enrichment q-value are represented. The color of the nodes demonstrates protein level change in RH1-resistant MDA-R cells.
Figure 3
Figure 3
Protein phosphorylation highlights signaling pathways in RH1-resistant cells. (A). Experimental workflow for kinome and phosphoproteome analysis. (B). MIB analysis of increased and decreased kinase activity between MDA-P and MDA-R cells. MDA-P and MDA-R cells were subjected to MIB analysis, followed by quantitative proteomic analysis. Kinase differential activity, interaction and functional annotation network was built by means of Cytoscape software with GeneMANIA application. The main functional clusters are represented and the color of the nodes demonstrates kinase activity change (red—increased, blue—decreased). (C). JNK1 and c-KIT-AKT-mTOR signaling pathways. Most biologically important pathways were analyzed combining MIB and phosphoproteome datasets. Red node color indicates increased activity of MIB dataset kinases, blue—decreased. Red phosphosite color indicates increased phosphorylation in the phosphoproteome dataset, blue—decreased. AKT and JNK phosphosites were identified by Western blot. Nodes without color indicate proteins that belong to the pathway but have neither been identified nor their phosphorylation changes were observed in either of datasets.
Figure 4
Figure 4
The decrease in JNK activation is related to RH1 resistance. (A). Western blot analysis showing the level of pJNK (Thr183/Tyr185) in MDA-P and MDA-R cells. α-tubulin is shown as loading control. (B). Densitometric analysis of pJNK and JNK western blot. Bars are ± SD, significant difference is marked by asterisks: ** p < 0.05, t-test, n = 4. (C). Viability test after JNK inhibition. MDA-P and MDA-R cells were pre-treated with JNK inhibitor SP600125 for 1 h and then treated with increasing concentrations of RH1 for 2 h. Cell survival after 96 h was estimated by MTT assay. Bars are ± SD, significant differences are marked by asterisks: * p < 0.1, ** p < 0.05, *** p < 0.01, ANOVA, n = 3.
Figure 5
Figure 5
RH1 resistant cells show an increased level of CSC markers. (A). Relative expression of selected CSC markers measured by RT-qPCR in MDA-R compared to MDA-P. The results are the mean of 3 independent experiments; bars are ± SD (ANOVA; * p < 0.05; ** p < 0.01). (B). Comparison of CSC markers detected by RT-qPCR with quantitative proteomic analysis results. (C). Western blot analysis of various isoforms of CD44 expression in MDA-P and MDA-R cell lines. (D). Flow cytometry aggregated data graph showing autofluorescence and CD44 expression in MDA-P and MDA-R cells. Data combined from unstained and CD44-FITC antibody-stained samples. E. Representative comparative confocal images of CD44 expression in MDA-P and MDA-R cells. Scale bar: 10 µm.
Figure 6
Figure 6
KIT inhibition attenuates MDA-P selection toward CSC induced by the double treatment with RH1. (A). Relative expression levels of KIT receptor and its ligand KITLG in MDA-P and MDA-R cells measured by RT-qPCR. The results are the mean of 3 independent experiments; bars are ± SD (ANOVA; * p < 0.05; ** p < 0.01). (B). Experimental time chart of cells short-time selection without and with KIT inhibition. (C). MDA-P (blue) or MDA-R (red) cells were pulse exposed or not exposed twice to 20 nM RH1 with or without of continuous treatment with KIT receptor inhibitor masitinib (5 µm). After 13 days cells were stained with CD44-FITC antibody and analyzed by flow cytometry. (D). MDA-P and MDA-R cells were subjected to sphere forming assay with or without 5µM masitinib treatment. Spheres were stained with MTT dye and counted using ImageJ software. The results are the mean of 3 independent experiments, two replicates each; bars are ± SD (ANOVA; * p <0.05; ** p < 0.01).
Figure 7
Figure 7
RH1 resistant cells acquire insusceptibility to conventional chemotherapy drugs, but not to c-KIT-targeted therapy. MDA-P and MDA-R cells were treated with increasing concentrations of drugs for 48 h: (A) docetaxel; (B) 5-fluorouracil; (C) oxaliplatin; (D) epirubicin; or for 72 h for (E) masitinib. Cell viability was measured after 96 h using the MTT assay. The results are the mean of 3 independent experiments; bars are ± SD (ANOVA; * p < 0.05; ** p < 0.01).

Similar articles

Cited by

References

    1. Holohan C., Van Schaeybroeck S., Longley D.B., Johnston P.G. Cancer drug resistance: an evolving paradigm. Nat. Rev. Cancer. 2013;13:714–726. doi: 10.1038/nrc3599. - DOI - PubMed
    1. Kreso A., Dick J.E. Evolution of the Cancer Stem Cell Model. Cell Stem Cell. 2014;14:275–291. doi: 10.1016/j.stem.2014.02.006. - DOI - PubMed
    1. Visvader J.E., Lindeman G.J. Cancer stem cells in solid tumours: accumulating evidence and unresolved questions. Nat. Rev. Cancer. 2008;8:755–768. doi: 10.1038/nrc2499. - DOI - PubMed
    1. Abubaker K., Latifi A., Luwor R., Nazaretian S., Zhu H., Quinn M.A., Thompson E.W., Findlay J.K., Ahmed N. Short-term single treatment of chemotherapy results in the enrichment of ovarian cancer stem cell-like cells leading to an increased tumor burden. Mol. Cancer. 2013;12:24. doi: 10.1186/1476-4598-12-24. - DOI - PMC - PubMed
    1. Gottesman M.M., Lavi O., Hall M.D., Gillet J.-P. Toward a Better Understanding of the Complexity of Cancer Drug Resistance. Annu. Rev. Pharmacol. Toxicol. 2016;56:85–102. doi: 10.1146/annurev-pharmtox-010715-103111. - DOI - PubMed

LinkOut - more resources