. 2019 Jul 11;16(14):2477.
doi: 10.3390/ijerph16142477.

The Effects of Imitation Dynamics on Vaccination Behaviours in SIR-Network Model

Affiliations

The Effects of Imitation Dynamics on Vaccination Behaviours in SIR-Network Model

Sheryl Le Chang et al. Int J Environ Res Public Health. .

Abstract

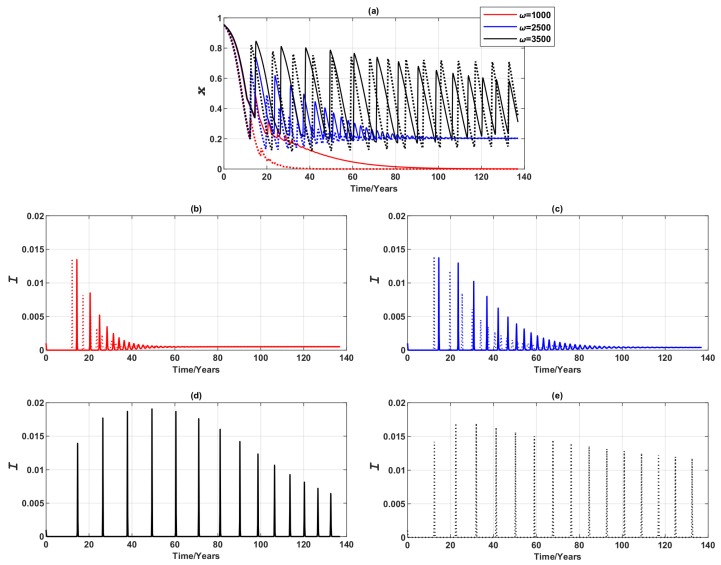
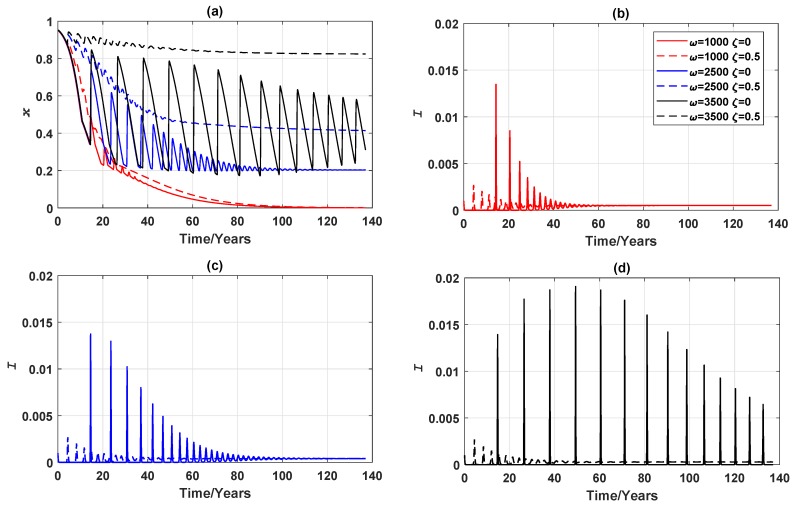
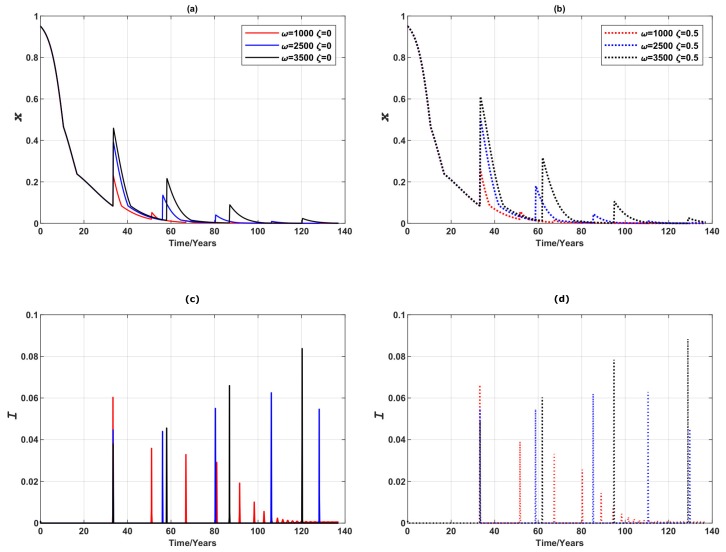
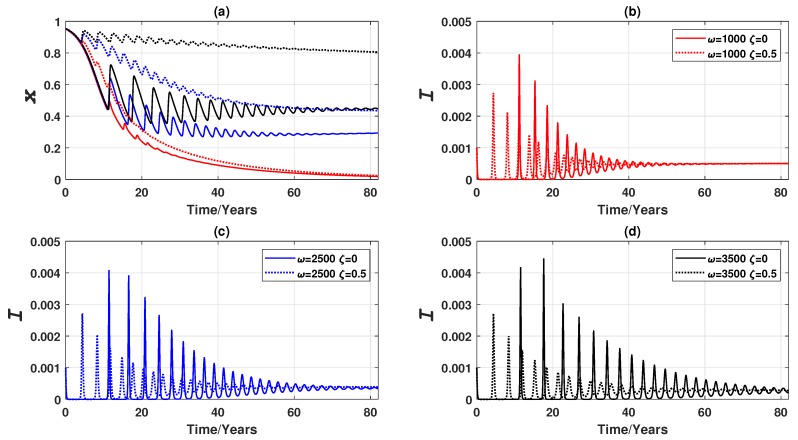
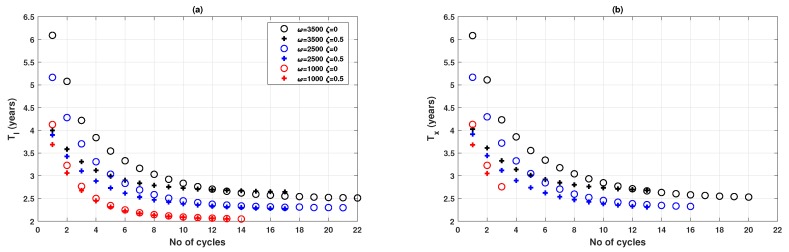
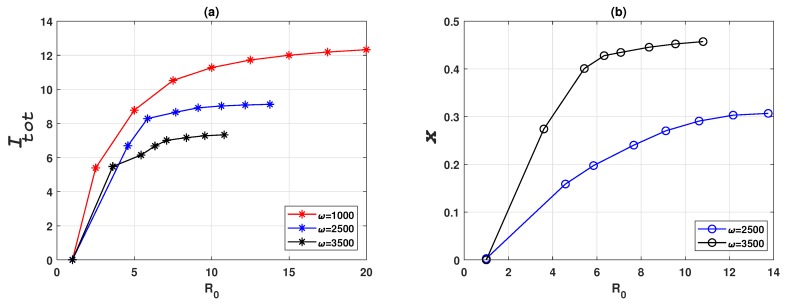
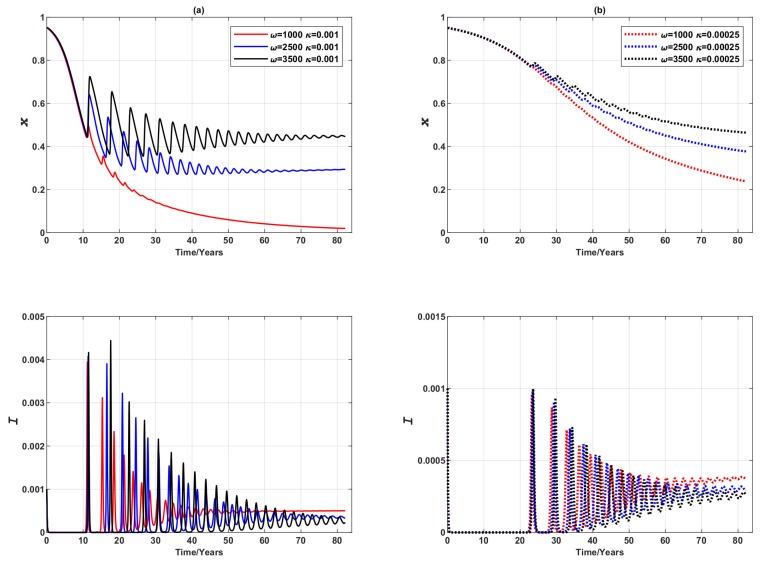
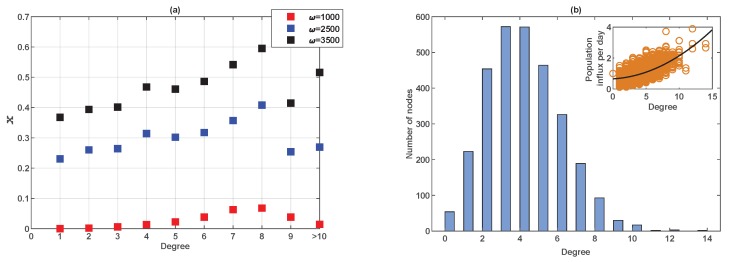
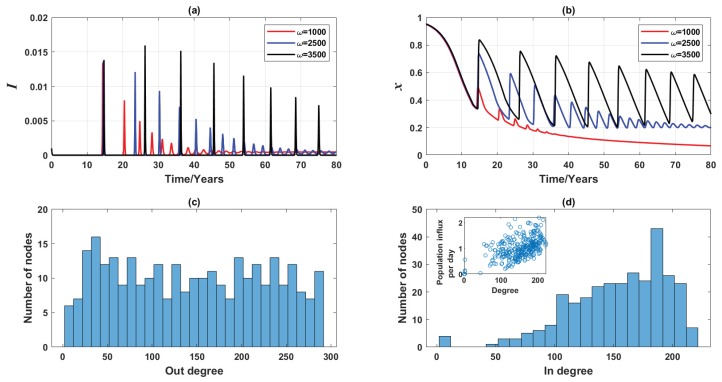
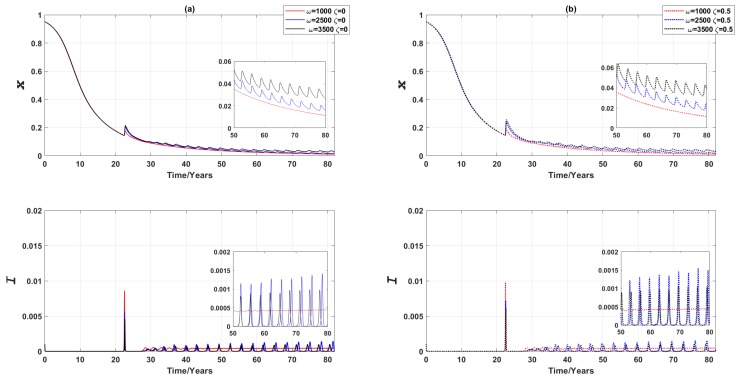
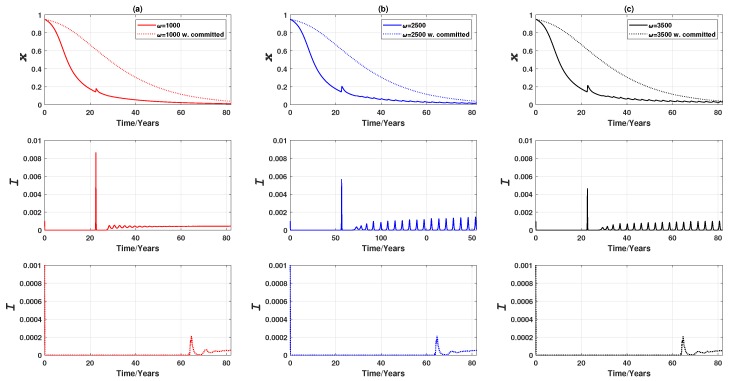
We present a series of SIR-network models, extended with a game-theoretic treatment of imitation dynamics which result from regular population mobility across residential and work areas and the ensuing interactions. Each considered SIR-network model captures a class of vaccination behaviours influenced by epidemic characteristics, interaction topology, and imitation dynamics. Our focus is the resultant vaccination coverage, produced under voluntary vaccination schemes, in response to these varying factors. Using the next generation matrix method, we analytically derive and compare expressions for the basic reproduction number R 0 for the proposed SIR-network models. Furthermore, we simulate the epidemic dynamics over time for the considered models, and show that if individuals are sufficiently responsive towards the changes in the disease prevalence, then the more expansive travelling patterns encourage convergence to the endemic, mixed equilibria. On the contrary, if individuals are insensitive to changes in the disease prevalence, we find that they tend to remain unvaccinated. Our results concur with earlier studies in showing that residents from highly connected residential areas are more likely to get vaccinated. We also show that the existence of the individuals committed to receiving vaccination reduces R 0 and delays the disease prevalence, and thus is essential to containing epidemics.

Keywords: Erdös-Rényi random networks; SIR model; epidemic modelling; greater Sydney commuting network; herd immunity; strategy imitation; vaccination.


Conflict of interest statement

The authors declare no conflict of interest.

Figures

Figure A1
Figure A1
The function f(x)=aebx+cedx is fitted for the period of epidemic and vaccination dynamics for three values of ω. (a) Period of the disease prevalence, TI. (b) Period of the relative proportion of vaccinated individuals, Tx. Circle: original data point. Solid line: fitted curve. Results of goodness-of-fit test are summarised in Table A1. Coefficients of fitting functions are summarised in Table A2.
Figure A2
Figure A2
Oscillation properties of epidemic and vaccination dynamics for three values of ω when vaccinating newborns at low β (β=0.75, or R0=7.5). Note that for the results reported in the main body of the paper, the transmission rate β was 1.5. (a) Disease prevalence (i.e., proportion of infected individuals), I, (b) Relative proportion of vaccinated individuals, x, (c) comparison of the period of the disease prevalence, TI, at different β, and (d) comparison of period of the relative proportion of vaccinated individuals, Tx, at different β. Circle: β=0.75. Cross: β=1.5. A peak, for the purpose of measuring period, is defined by a peak threshold θ: θI=0.0001 for I, and θx=0.01 for x.
Figure 1
Figure 1
Schematic of daily population travel dynamics across different suburbs (nodes): a 4-node example. Solid line: network connectivity. Dashed line: volume of population flux (influx and outflux). Non-connected nodes have zero population flux (e.g., ϕ34=ϕ43=0). For each node, the daily outflux proportions (including travel to the considered node itself) sum up to unity, however, the daily influx proportions do not.
Figure 2
Figure 2
Schematic of the 3-node case: population mobility across nodes. (a) No population mobility. i=j={1,2,3},ϕij=0 where ij. Otherwise ϕij=1. (b) Equal population mobility. i=j={1,2,3},ϕij=13.
Figure 3
Figure 3
Epidemic dynamics of a 3-node case for three values of ω when vaccinating newborns. Time series of (a) the relative proportion of vaccinated individuals, x, and (be) Infection prevalence, I. Solid line: Symmetric uniform population mobility. Dotted line: No population mobility. Commuting suppresses prevalence peaks over time at high ω, but may produce higher prevalence peaks over time at mid and low ω.
Figure 4
Figure 4
Comparison of vaccination failure rates: epidemic dynamics of a 3-node case for three values of ω (which measures the responsiveness of individuals to prevalence) when vaccinating newborns. (a) Relative proportion of vaccinated individuals, x, and (bd) Disease prevalence (i.e., Proportion of infected individuals), I. Solid line: ζ=0. Dashed line: ζ=0.5.
Figure 5
Figure 5
Comparison of vaccination failure rates: epidemic dynamics of a 3-node case for three values of ω (which measures the responsiveness of individuals to prevalence) when vaccinating newborns and adults. (a,b) Relative proportion of vaccinated individuals, x, and (c,d) Disease prevalence (i.e., proportion of infected individuals), I. Solid line: ζ=0. Dashed line: ζ=0.5.
Figure 6
Figure 6
Comparison of vaccination failure rates: epidemic dynamics of a Erdös-Rényi random network of 3000 nodes for three values of ω (which measures the responsiveness of individuals to prevalence) when vaccinating newborns. (a) Relative proportion of vaccinated individuals, x, and (bd) Disease prevalence (i.e., proportion of infected individuals), I. Solid line: ζ=0. Dashed line: ζ=0.5.
Figure 7
Figure 7
Oscillation properties of epidemic and vaccination dynamics for three values of ω when vaccinating newborns. (a) Period of the disease prevalence, TI, and (b) Period of the relative proportion of vaccinated individuals, Tx. Circle: ζ=0; plus sign: ζ=0.5. A peak, for the purpose of measuring period, is defined by a peak threshold θ: θI=0.0001 for I, and θx=0.01 for x.
Figure 8
Figure 8
Epidemic and vaccination dynamics of a Erdös-Rényi random network of 3000 nodes for various values of basic reproduction number R0, for three values of ω. (a) Cumulative prevalence, Itot. (b) Relative proportion of vaccinated individuals, x. R0 is varied by varying the infection rate β. Cumulative prevalence Itot is obtained by integrating the prevalence over the simulated time frame. Note that different ω settings correspond to different ranges for R0 due to the different vaccination coverage, x, at their respective endemic equilibria. Note that in (b) the case for ω=1000 is not shown because it is trivially zero for all values of R0.
Figure 9
Figure 9
Epidemic dynamics of a Erdös-Rényi random network of 3000 nodes, varying the value of κ for three values of ω (vaccinating newborns). Time series of relative proportion of vaccinated individuals, x, and disease prevalence (i.e., proportion of infected individuals), I. (a) Solid line: κ=0.001. (b) Dotted line: κ=0.00025.
Figure 10
Figure 10
The relationship between node degree and proportion of people who vaccinate voluntarily (vaccinating newborns only) for an Erdös-Rényi random network of 3000 nodes. (a) The fraction of vaccinated individuals as a function of node degree (which is the number of neighbouring suburbs for each suburb considered) has for three values of ω. (b) The degree distribution of the Erdös-Rényi random network. The inset figure shows the population influx per node (sum of flux fractions from each source node) as a function of the node degree.
Figure 11
Figure 11
Simulated dynamics (vaccinating newborns only) of the commuting network in Greater Sydney generated from the 2016 Australian census data, for three values of ω. Time series of (a) disease prevalence, I, (b) relative proportion of vaccinated individuals, x, (c) out-degree distribution of the network (representing population outflux), and (d) in-degree distribution of the network (representing population influx). The inset figure shows the population influx per node as a function of the node degree. Other network properties: M=311,k150.
Figure 12
Figure 12
Epidemic dynamics of a Erdös-Rényi random network of 3000 nodes for three values of ω (vaccinating susceptible class regardless of age). Relative proportion of vaccinated individuals, x, and disease prevalence (i.e., the proportion of infected individuals), I, are shown against time. (a) ζ=0 (b) ζ=0.5. The inset figure in each figure is a magnified section to show small oscillations.
Figure 13
Figure 13
Epidemic dynamics of a Erdös-Rényi random network of 3000 nodes with committed vaccine recipients for three values of ω (vaccinating the entire susceptible class). Relative proportion of vaccinated individuals, x, against time, and disease prevalence (i.e., the proportion of infected individuals), I, against time. (a) ω=1000 (b) ω=2500 (c) ω=3500. Solid line: without committed vaccine recipients. Dotted line: with committed vaccine recipients. The proportion of committed vaccine recipients, xc=0.0002. The existence of committed vaccine recipients delays the predominant peaks and reduces the magnitude of oscillation in the proportion of vaccine recipients in later stages.

Similar articles

Cited by

References

    1. World Heath Organization . Basic Epidemiology. World Heath Organization; Geneva, Switzerland: 2006. pp. 125–127.
    1. Jansen V.A.A., Stollenwerk N., Jensen H., Ramsay M., Edmunds W., Rhodes C. Measles outbreaks in a population with declining vaccine uptake. Science. 2003;301:804. doi: 10.1126/science.1086726. - DOI - PubMed
    1. Bauch C.T. Imitation dynamics predict vaccinating behaviour. Proc. R. Soc. B. 2005;272:1669–1675. doi: 10.1098/rspb.2005.3153. - DOI - PMC - PubMed
    1. Wang Z., Bauch C., Bhattacharyya S., d’Onofrio A., Manfredi P., Perc M.P.N., Salathè M., Zhao D. Statistical physics of vaccination. Phys. Rep. 2016;664:1–113. doi: 10.1016/j.physrep.2016.10.006. - DOI
    1. Bauch C.T., Bhattacharyya S. Evolutionary game theory and social learning can determine how vaccine scares unfold. PLoS Comput. Biol. 2012;8:e1002452. doi: 10.1371/journal.pcbi.1002452. - DOI - PMC - PubMed

Publication types