. 2019 Jul 12;8(7):709.
doi: 10.3390/cells8070709.

Galectin-3 Regulates Indoleamine-2,3-dioxygenase-Dependent Cross-Talk between Colon-Infiltrating Dendritic Cells and T Regulatory Cells and May Represent a Valuable Biomarker for Monitoring the Progression of Ulcerative Colitis

Affiliations

Galectin-3 Regulates Indoleamine-2,3-dioxygenase-Dependent Cross-Talk between Colon-Infiltrating Dendritic Cells and T Regulatory Cells and May Represent a Valuable Biomarker for Monitoring the Progression of Ulcerative Colitis

Vladislav Volarevic et al. Cells. .

Abstract

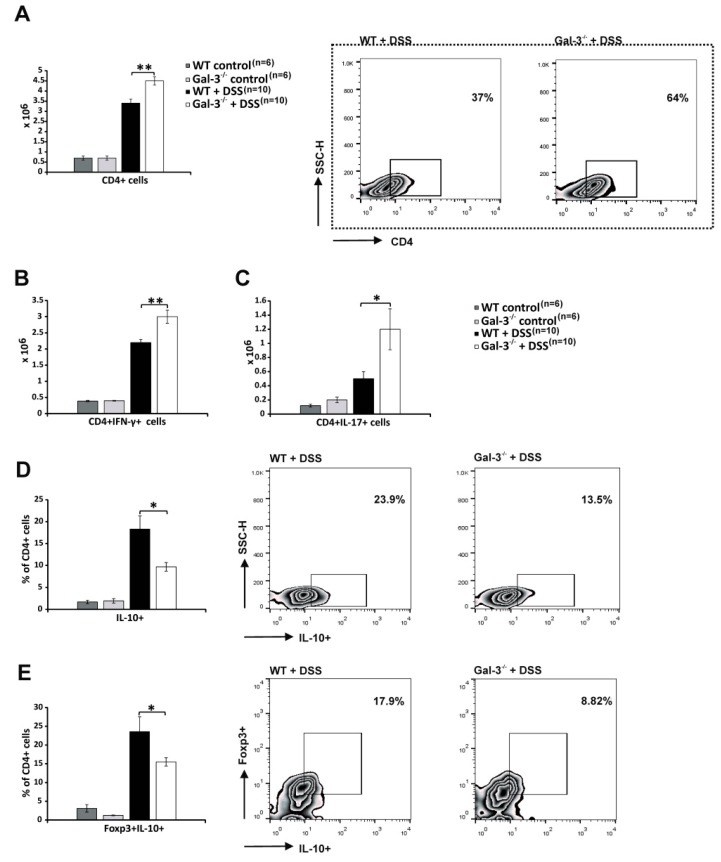
Galectin-3 regulates numerous biological processes in the gut. We investigated molecular mechanisms responsible for the Galectin-3-dependent regulation of colon inflammation and evaluated whether Galectin-3 may be used as biomarker for monitoring the progression of ulcerative colitis (UC). The differences in disease progression between dextran sodium sulphate-treated wild type and Galectin-3-deficient mice were investigated and confirmed in clinical settings, in 65 patients suffering from mild, moderate, and severe colitis. During the induction phase of colitis, Galectin-3 promoted interleukin-1β-induced polarization of colonic macrophages towards inflammatory phenotype. In the recovery phase of colitis, Galectin-3 was required for the immunosuppressive function of regulatory dendritic cells (DCs). Regulatory DCs in Galectin-3:Toll-like receptor-4:Kynurenine-dependent manner promoted the expansion of colon-infiltrated T regulatory cells (Tregs) and suppressed Th1 and Th17 cell-driven colon inflammation. Concentration of Galectin-3 in serum and stool samples of UC patients negatively correlated with clinical, endoscopic, and histological parameters of colitis. The cutoff serum values of Galectin-3 that allowed the discrimination of mild from moderate and moderate from severe colitis were 954 pg/mL and 580 pg/mL, respectively. Fecal levels of Galectin-3 higher than 553.44 pg/mL indicated attenuation of UC. In summing up, Galectin-3 regulates the cross-talk between colon-infiltrating DCs and Tregs and represents a new biomarker for monitoring the progression of UC.

Keywords: Galectin-3; Kynurenine; T regulatory cells; Toll-like receptor-4; biomarker; dendritic cells; immunomodulation; ulcerative colitis.


Conflict of interest statement

The authors declare no conflict of interest.

Figures

Figure 1
Figure 1
Gal-3 has pro-inflammatory role in induction phase of DSS-induced colitis. 2.2% DSS was given to mice for 5 days while regular drinking water was given to control animals. DSS-induced loss of weight (A); Disease Activity Index DAI (B); and survival rate (C) 5 days after colitis induction. Length of colon (D) and histological score (E) of DSS-treated mice. Haematoxylin and eosin (H&E) stained colon tissue samples of DSS-treated mice (magnification 100×) (F). Concentrations of IL-1β, TNF-α, IL-6 (G), IL-10 (H), IFN-γ (I), IL-17 (J), and KYN (K) in serum samples of DSS-treated mice at day 5. The total number M1 and M2 macrophages in colons of DSS-treated animals (L). Data are presented as mean ± standard error of the mean (SEM); n = 10 mice per experimental and 6 mice per control groups. * p < 0.05, ** p < 0.001.
Figure 2
Figure 2
Gal-3 deficiency significantly aggravated colon injury and inflammation in chronic phase of DSS-induced colitis. DAI (A), survival rate (B), length of colon (C), histological score (D), representative H&E stained colon tissue samples (E), serum concentration of IL-6, IL-12, IL-17, IFN-γ (F), IL-10 (G), KYN (H), and total number of colon-infiltrated M1 and M2 macrophages (I) in DSS-treated WT and Gal-3−/− mice, 28 days after initial DSS administration. Values are mean ± standard error of the mean (SEM) (n = 10 mice per experimental and 6 mice per control groups) * p < 0.05, ** p < 0.001.
Figure 3
Figure 3
Genetic deletion of Gal-3 markedly enhanced presence of Th1 and Th17 cells in colons of DSS-treated mice. The total number of T cells in colons of DSS-treated WT and Gal-3−/− mice 28 days after initial DSS administration (A). The total number of CD4+IFN-γ+ Th1 T cells (B), CD4+IL-17+ Th17 cells (C), percentage of regulatory T cells (CD4+IL-10+ and CD4+Foxp3+IL-10+) (D,E) with representative flow cytometry dot plots are presented. Values are mean ± standard error of the mean (SEM) (n = 10 mice per experimental and 6 mice per control groups). * p < 0.05, ** p < 0.001.
Figure 4
Figure 4
Gal-3 deletion favored development of inflammatory phenotype in colon-infiltrated DCs. The total number of CD11c+ DCs in colons of DSS-treated WT and Gal-3−/− mice 28 days after initial DSS administration (A). The total number of CD40, CD80 and CD86-expressing CD11c+DCs (BD) and IL-12, IL-23, IL-6, and IL-10 producing CD11c+DCs in colons of DSS-treated WT and Gal-3−/− mice (EH). Data are presented as mean ± standard error of the mean (SEM); n = 10 mice per experimental and 6 mice per control groups. * p < 0.05, ** p < 0.001.
Figure 5
Figure 5
Gal-3 is required for optimal TLR-4-dependent production of KYN in DCs. Correlation between expression of Gal-3 and TLR-4 on colon-infiltrated CD11c+DCs 28 days after initial DSS administration (A). KYN production in LPS-primed DCs (B). Expression of IL-10, IFN-γ and IL-17 in Tregs which were co-cultured with LPS-primed WTDCs, Gal-3−/−DCs or WTDCDavanat (CE). Expression of IL-10, IFN-γ and IL-17 in activated T cells which were co-cultured with Tregs primed by LPS-stimulated WTDCs, Gal-3−/−DCs, or WTDCDavanat (FH). Data presented as mean ± standard error of the mean (SEM); n = 10 mice per experimental groups. ** p < 0.001.
Figure 6
Figure 6
Genetic deletion of Gal-3 diminished capacity of TLR-4-primed DCs for attenuation of chronic colitis. DAI (A), length of colon (B), histological score (C), representative H&E (D), serum levels of KYN (E) and IL-10 (G), total number of colon-infiltrated immunosuppressive CD4+Foxp3+IL-10+ Tregs (F), serum level of IL-10 (G), total number of colon-infiltrated inflammatory CD4+T-bet+IFN-γ+Th1 cells (H), CD4+CXCR3+Th1 cells (I), CD4+IL-17+Th17 cells (J) and CD4+CCR6+Th17 cells (K), serum concentration of IFN-γ and IL-17 (L), and 28 days after adoptive transfer of LPS-primed WTDCs or Gal-3−/−DCs in DSS-treated mice. Values are mean ± standard error of the mean (SEM) (n = 10 mice per experimental groups and 6 mice per control group). * p < 0.05, ** p < 0.01; *** p < 0.001.
Figure 7
Figure 7
Serum Gal-3 may serve as a valuable marker for monitoring the progression of UC. The serum levels of Gal-3 (A), clinical score (B), histological score (D), endoscopic score (E) in UC patients with mild, moderate or severe forms of UC. Correlation between clinical score and serum levels of Gal-3 (C). Representative histological sections (D, magnification of 200×) and endoscopic images (E) of UC patients with mild, moderate, or severe forms of UC. (D). Correlation between serum levels of Gal-3 and histological or endoscopic score (F). ROC curve illustrate the specificity and sensitivity of Gal-3 serum concentration, comparing mild chronic colitis with moderate chronic colitis (left panel) and specificity and sensitivity of sera Gal-3, comparing moderate chronic colitis with severe chronic colitis (right panel) (G). Mean ± standard error of the mean; ** p < 0.01; *** p < 0.001.
Figure 8
Figure 8
Increased serum levels of Gal-3 indicates overproduction of immunosuppressive cytokines in UC patients. Correlation between serum concentrations of Gal-3 and KYN (A), KYN and percentage of colon-infiltrated Tregs (B), serum levels of Gal-3 and percentage of colon-infiltrated Tregs (C), serum concentration of Gal-3 and IL-10 (D). Correlation between serum level of Gal-3 and concentration of IL-10 (E) and TGF-β (F) in supernatants of Con A-stimulated pbMNCs. Correlation between serum levels of Gal-3 and CXCL11 (G) and between serum concentration of Gal-3 and IL-17 (H). Correlation between serum level of Gal-3 and concentration of IFN-γ (I) and IL-17 (J) in supernatants of Con A-stimulated pbMNCs.
Figure 9
Figure 9
Fecal Gal-3 as biomarker for monitoring the progression of UC. Fecal concentration of Gal-3 (A). Correlation between fecal levels of Gal-3 and clinical score (B) and fecal calprotectin (C). ROC curve illustrating the specificity and sensitivity of Gal-3 fecal concentration, comparing mild chronic colitis with moderate chronic colitis (left panel) and specificity and sensitivity of fecal Gal-3, comparing moderate chronic colitis with severe chronic colitis (right panel) (D). Correlation between fecal concentration of Gal-3 and KYN (E), percentage of colon-infiltrated Tregs (F), fecal levels of IL-10 (G). Correlation between fecal level of Gal-3 and concentration of IL-10 (H) and TGF-β (I) in supernatants of Con A-stimulated pbMNCs. Concentration between fecal levels of Gal-3 and CXCL11 (J) and IL-17 (K). Correlation between fecal level of Gal-3 and concentration of IFN-γ (L) and IL-17 (M) in supernatants of Con A-stimulated pbMNCs. Mean ± standard error of the mean; * p < 0.05.
Figure 10
Figure 10
Scheme of Gal-3-dependent modulation of chronic DSS-induced colitis. The main mechanism by which Gal-3 regulates immunosuppressive capacity of regulatory DCs in the gut is relied on the TLR-4-dependent activation of IDO-1/KYN pathway and consequent expansion of colon-infiltrated Tregs, which suppress Th1 and Th17 cell-driven colon inflammation.

References

    1. Strober W., Fuss I., Mannon P. The fundamental basis of inflammatory bowel disease. J. Clin. Investig. 2007;117:514–521. doi: 10.1172/JCI30587. - DOI - PMC - PubMed
    1. Naganuma M., Sakuraba A., Hibi T. Ulcerative colitis: Prevention of relapse. Expert. Rev. Gastroenterol. Hepatol. 2013;7:341–351. doi: 10.1586/egh.13.18. - DOI - PubMed
    1. Vilela E.G., Torres H.O., Martins F.P., Ferrari M.L., Andrade M.M., Cunha A.S. Evaluation of inflammatory activity in Crohn’s disease and ulcerative colitis. World J. Gastroenterol. 2012;18:872–881. doi: 10.3748/wjg.v18.i9.872. - DOI - PMC - PubMed
    1. Chang S., Malter L., Hudesman D. Disease monitoring in inflammatory bowel disease. World J. Gastroenterol. 2015;21:11246–11259. doi: 10.3748/wjg.v21.i40.11246. - DOI - PMC - PubMed
    1. Kopylov U., Rosenfeld G., Bressler B., Seidman E. Clinical utility of fecal biomarkers for the diagnosis and management of inflammatory bowel disease. Inflamm. Bowel. Dis. 2014;20:742–756. doi: 10.1097/01.MIB.0000442681.85545.31. - DOI - PubMed

Publication types