

Anticancer Function and ROS-Mediated Multi-Targeting Anticancer Mechanisms of Copper (II) 2-hydroxy-1-naphthaldehyde Complexes
- PMID: 31336900
- PMCID: PMC6680819
- DOI: 10.3390/molecules24142544
Anticancer Function and ROS-Mediated Multi-Targeting Anticancer Mechanisms of Copper (II) 2-hydroxy-1-naphthaldehyde Complexes
Erratum in
-
Correction: Khan et al. Anticancer Function and ROS-Mediated Multi-Targeting Anticancer Mechanisms of Copper (II) 2-hydroxy-1-naphthaldehyde Complexes. Molecules 2019, 24, 2544.Molecules. 2021 Oct 8;26(19):6070. doi: 10.3390/molecules26196070. Molecules. 2021. PMID: 34641633 Free PMC article.
Abstract
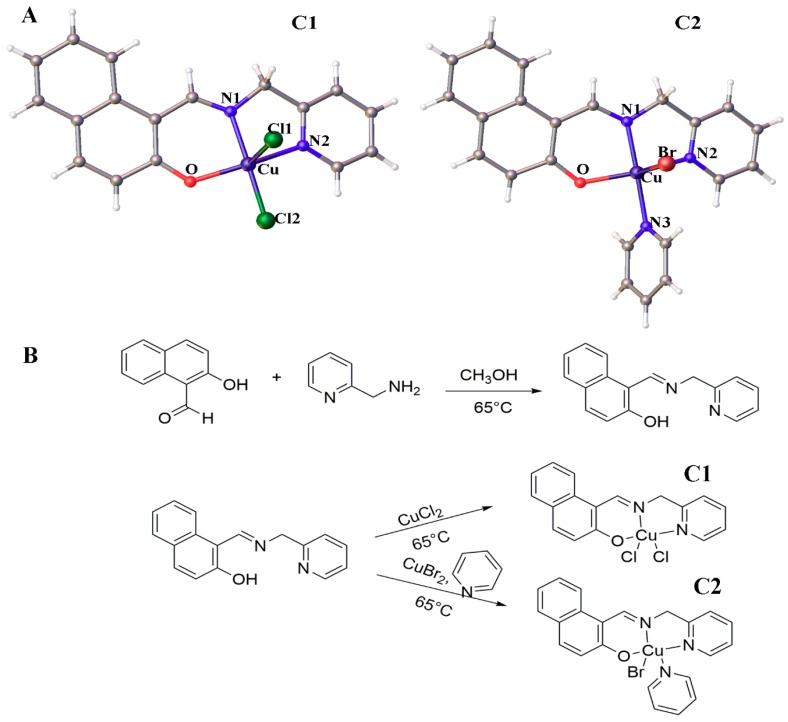
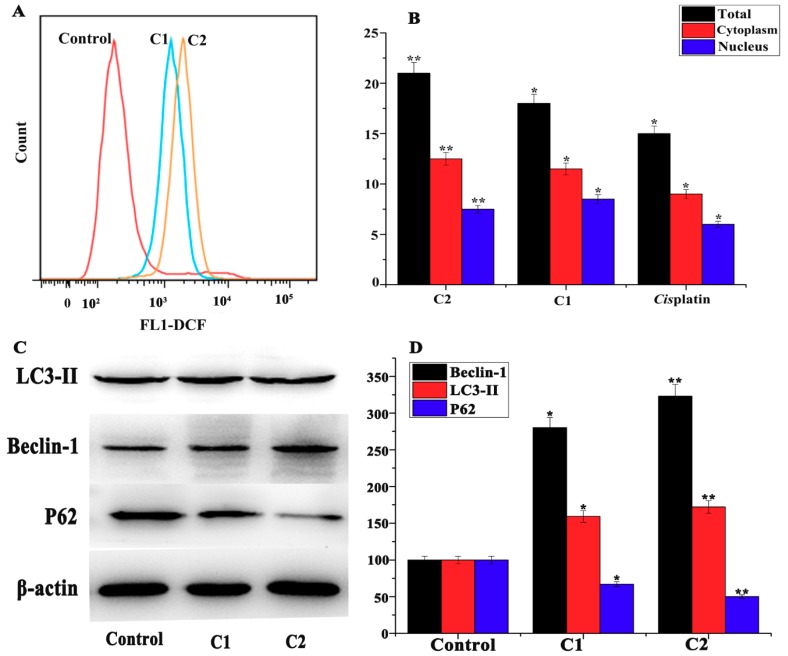
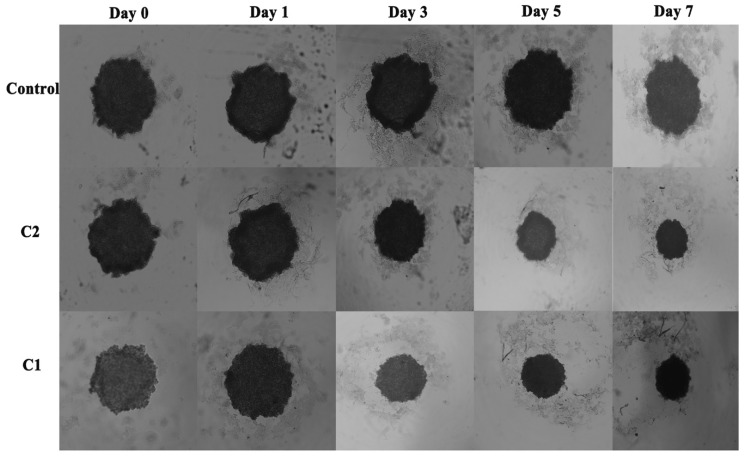
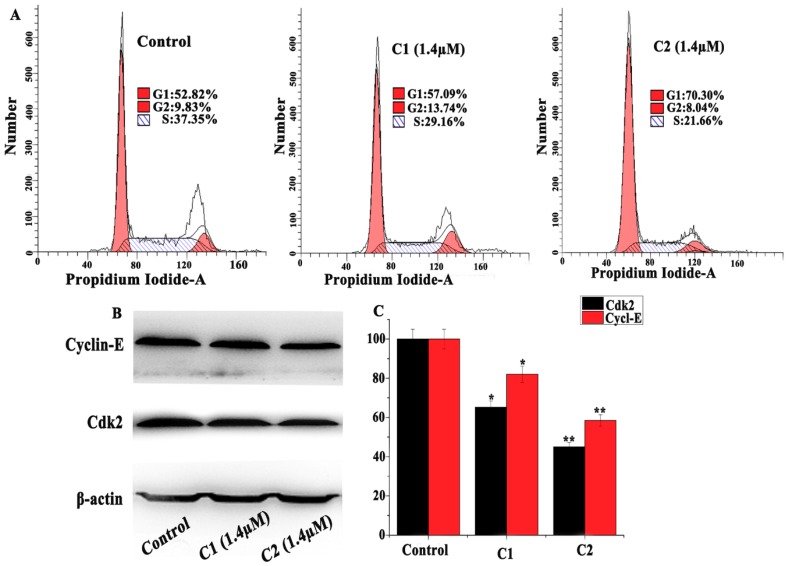
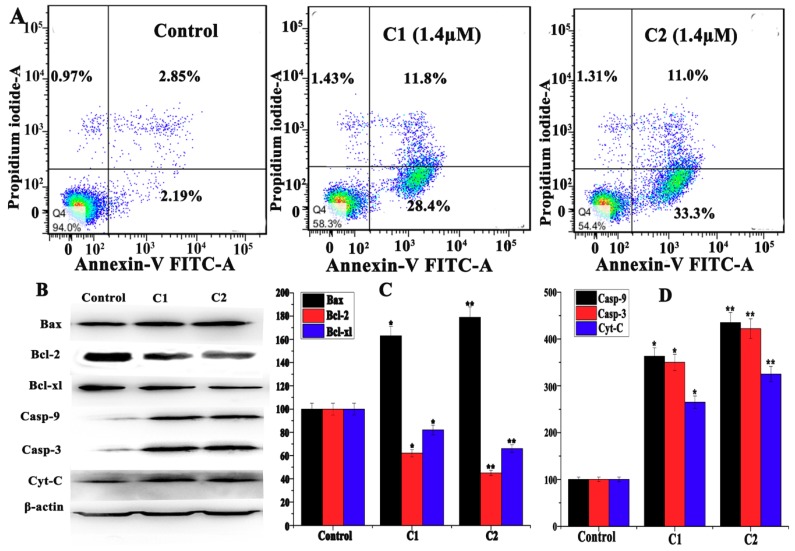
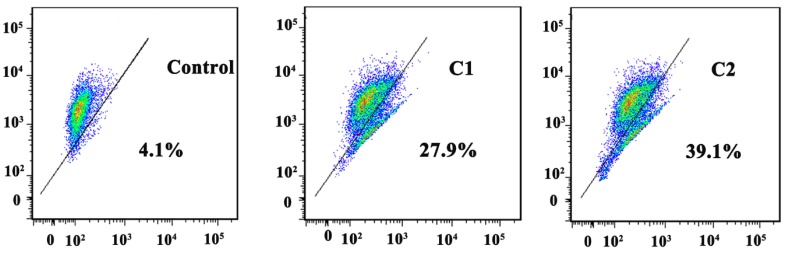
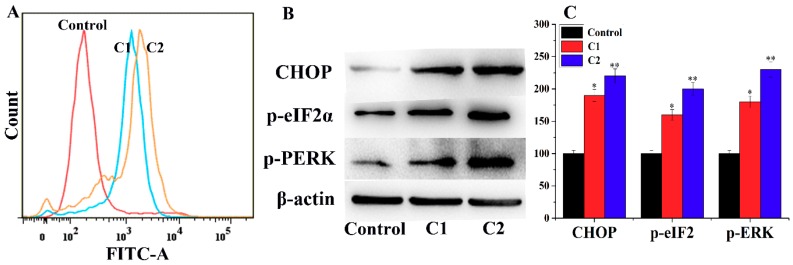
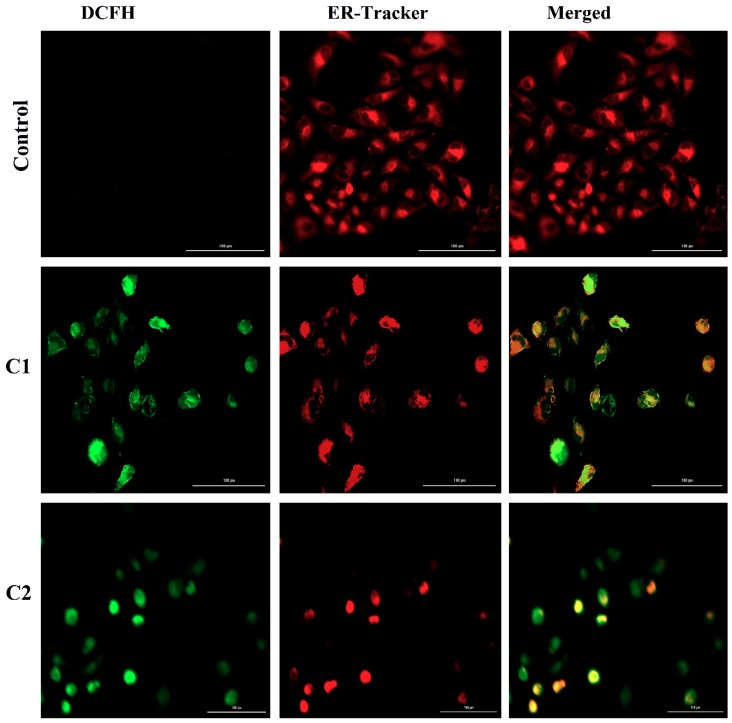
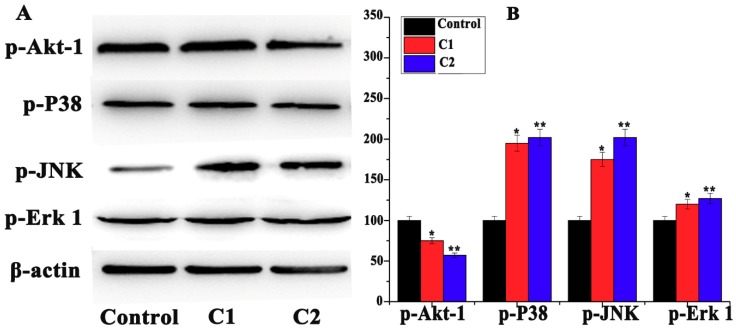
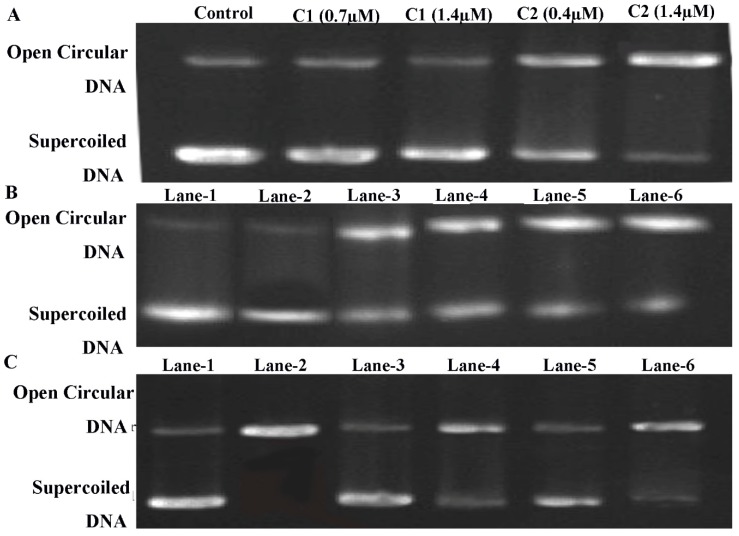
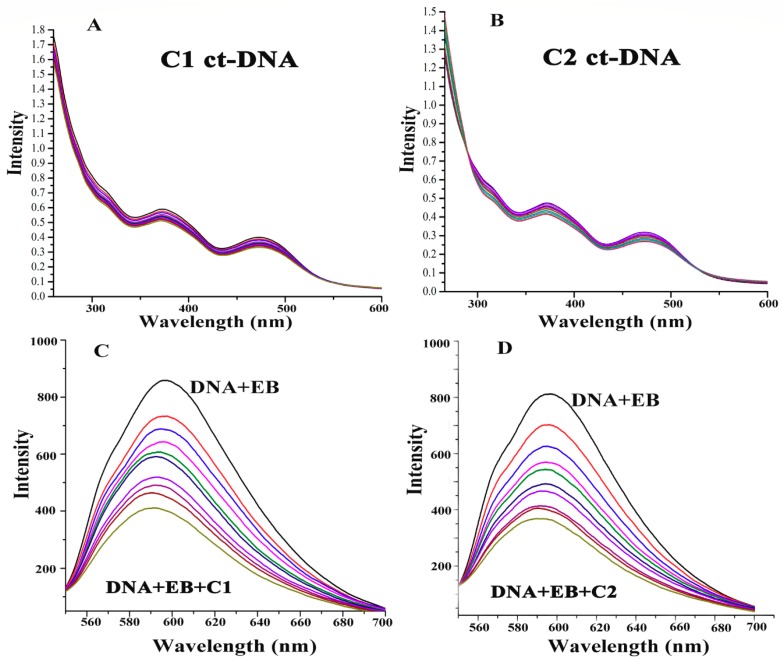
Multi-targeting of oncoproteins by a single molecule represents an effectual, rational, and an alternative approach to target therapy. We carried out a systematic study to reveal the mechanisms of action of newly synthesized Cu2+ compounds of 2-naphthalenol and 1-(((2-pyridinylmethyl)imino)methyl)- (C1 and C2). The antiproliferative activity of the as-synthesized complexes in three human cancer cell lines indicates their potential as multi-targeted antitumor agents. Relatively, C1 and C2 showed better efficacy in vitro relative to Cisplatin and presented promising levels of toxicity against A-549 cells. On the whole, the Cu2+ complexes exhibited chemotherapeutic effects by generating reactive oxygen species (ROS) and arresting the cell cycle in the G0/G1 phase by competent regulation of cyclin and cyclin-dependent kinases. Fascinatingly, the Cu2+ complexes were shown to activate the apoptotic and autophagic pathways in A-549 cells. These complexes effectively induced endoplasmic reticulum stress-mediated apoptosis, inhibited topoisomerase-1, and damaged cancer DNA through a ROS-mediated mechanism. The synthesized Cu2+ complexes established ROS-mediated targeting of multiple cell signaling pathways as a fabulous route for the inhibition of cancer cell growth.
Keywords: 2-hydroxy-1-naphthaldehyde; Cu(II) complex; anticancer mechanism; cytotoxicity.
Conflict of interest statement
There is no conflict of interest regarding this research work.
Figures
Similar articles
-
Synthesis of four binuclear copper(II) complexes: Structure, anticancer properties and anticancer mechanism.Eur J Med Chem. 2015;96:360-8. doi: 10.1016/j.ejmech.2015.04.031. Epub 2015 Apr 14. Eur J Med Chem. 2015. PMID: 25899339
-
Synthesis, DNA binding, antibacterial and anticancer properties of two novel water-soluble copper(II) complexes containing gluconate.Eur J Med Chem. 2021 Mar 5;213:113182. doi: 10.1016/j.ejmech.2021.113182. Epub 2021 Jan 15. Eur J Med Chem. 2021. PMID: 33486198
-
The Cu/ligand stoichiometry effect on the coordination behavior of aroyl hydrazone with copper(II): Structure, anticancer activity and anticancer mechanism.Bioorg Med Chem. 2016 May 15;24(10):2190-8. doi: 10.1016/j.bmc.2016.03.033. Epub 2016 Mar 19. Bioorg Med Chem. 2016. PMID: 27056799
-
Recent Advances in Copper Intercalators as Anticancer Agents.J Fluoresc. 2018 Sep;28(5):1195-1205. doi: 10.1007/s10895-018-2283-7. Epub 2018 Aug 31. J Fluoresc. 2018. PMID: 30171479 Review.
-
Copper-induced tumor cell death mechanisms and antitumor theragnostic applications of copper complexes.Nanomedicine (Lond). 2022 Feb;17(5):303-324. doi: 10.2217/nnm-2021-0374. Epub 2022 Jan 21. Nanomedicine (Lond). 2022. PMID: 35060391 Review.
Cited by
-
Strontium Attenuates Hippocampal Damage via Suppressing Neuroinflammation in High-Fat Diet-Induced NAFLD Mice.Int J Mol Sci. 2023 Jun 16;24(12):10248. doi: 10.3390/ijms241210248. Int J Mol Sci. 2023. PMID: 37373395 Free PMC article.
-
The Cytotoxic Effect of Copper (II) Complexes with Halogenated 1,3-Disubstituted Arylthioureas on Cancer and Bacterial Cells.Int J Mol Sci. 2021 Oct 22;22(21):11415. doi: 10.3390/ijms222111415. Int J Mol Sci. 2021. PMID: 34768844 Free PMC article.
-
Design, synthesis, anticancer activity and molecular docking of quinoline-based dihydrazone derivatives.RSC Adv. 2025 Jan 2;15(1):231-243. doi: 10.1039/d4ra06954d. eCollection 2025 Jan 2. RSC Adv. 2025. PMID: 39758910 Free PMC article.
-
In Vitro Evaluation of the Cytotoxic Potential of Thiosemicarbazide Coordinating Compounds in Hepatocyte Cell Culture.Biomedicines. 2023 Jan 26;11(2):366. doi: 10.3390/biomedicines11020366. Biomedicines. 2023. PMID: 36830902 Free PMC article.
-
Experimental and Computational Investigation of Cu(II) and Zn(II) complexes: DFT, Docking, and Anti-Lung Cancer Studies.Future Med Chem. 2025 Mar;17(6):669-679. doi: 10.1080/17568919.2025.2478815. Epub 2025 Mar 21. Future Med Chem. 2025. PMID: 40116476
References
-
- Shokohi-Pour Z., Chiniforoshan H., Momtazi-Borojeni A.A., Notash B. A novel Schiff base derived from the gabapentin drug and copper (II) complex: Synthesis, characterization, interaction with DNA/protein and cytotoxic activity. J. Photochem. Photobiol. B Biol. 2016;162:34–44. doi: 10.1016/j.jphotobiol.2016.06.022. - DOI - PubMed
-
- Abbasi Z., Salehi M., Khaleghian A., Kubicki M. In vitro cytotoxic activity of a novel Schiff base ligand derived from 2-hydroxy-1-naphthaldehyde and its mononuclear metal complexes. J. Mol. Struct. 2018;1173:213–220. doi: 10.1016/j.molstruc.2018.06.104. - DOI
MeSH terms
Substances
Grants and funding
LinkOut - more resources
Full Text Sources
Miscellaneous
