. 2019 Jul 14;8(7):722.
doi: 10.3390/cells8070722.

Acute Lymphoblastic Leukaemia Cells Impair Dendritic Cell and Macrophage Differentiation: Role of BMP4

Affiliations

Acute Lymphoblastic Leukaemia Cells Impair Dendritic Cell and Macrophage Differentiation: Role of BMP4

Jaris Valencia et al. Cells. .

Abstract

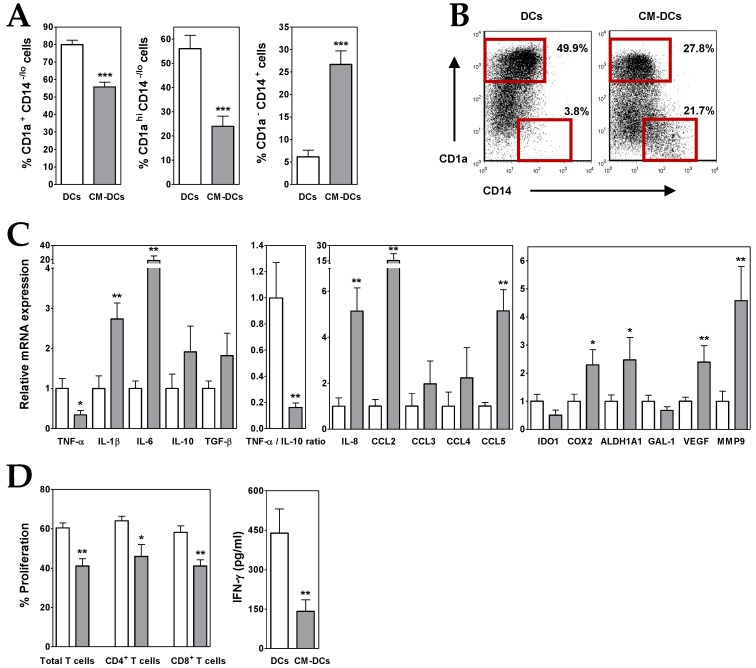
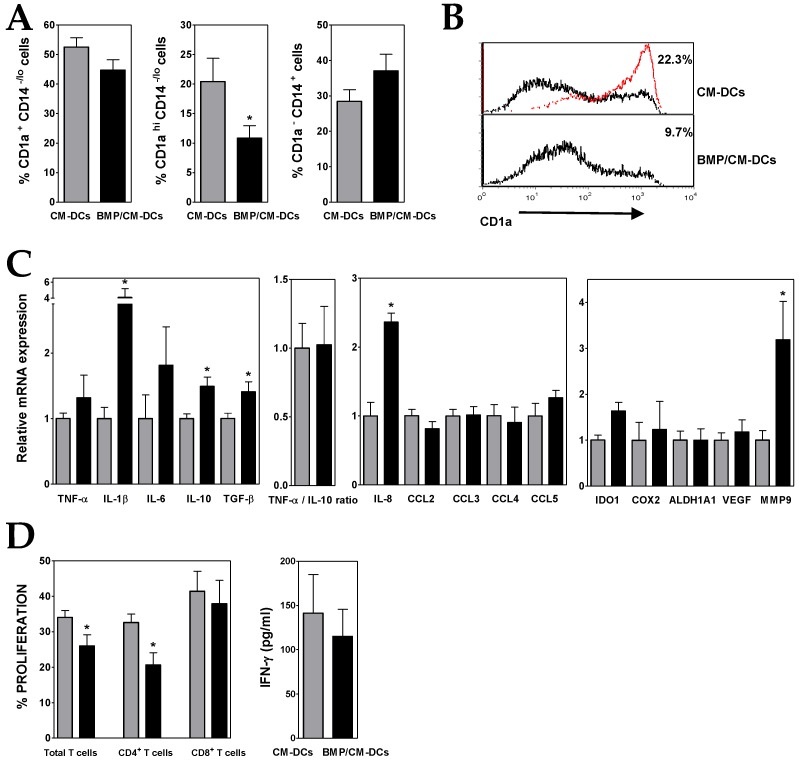
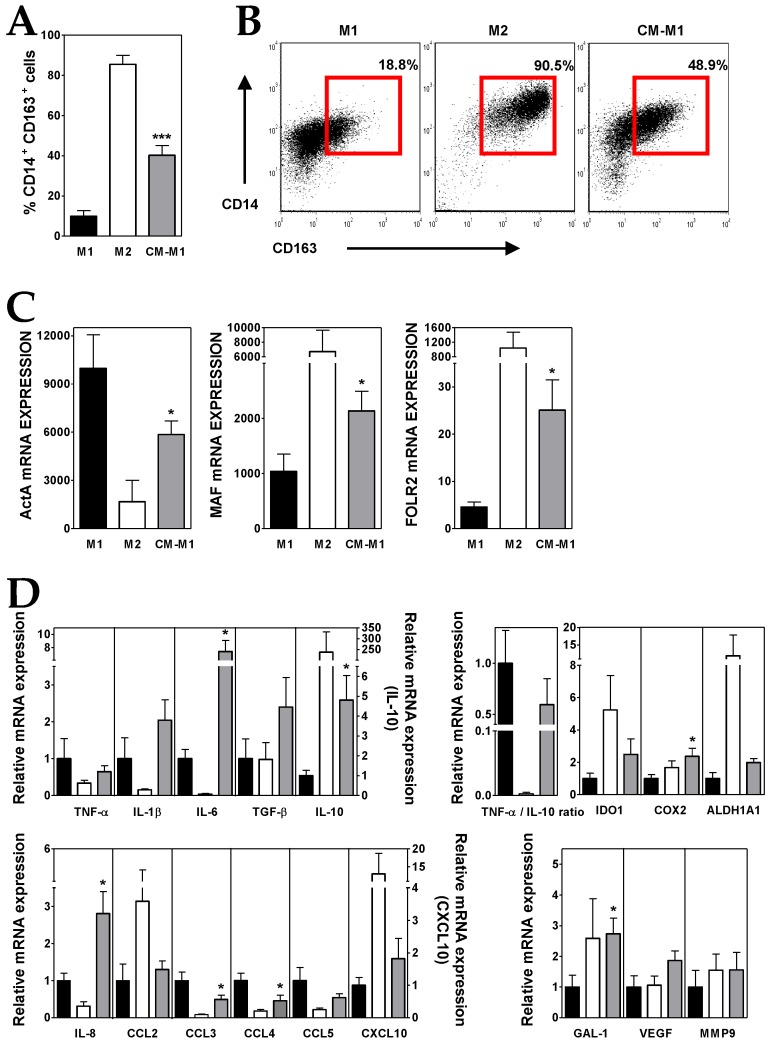
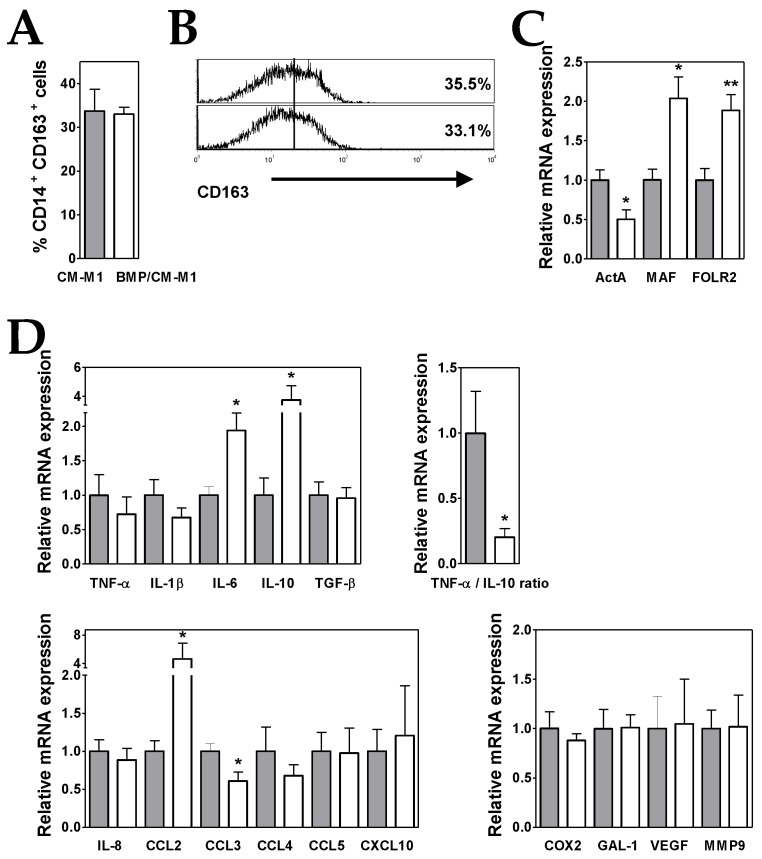
Dendritic cells and macrophages are common components of the tumour immune microenvironment and can contribute to immune suppression in both solid and haematological cancers. The Bone Morphogenetic Protein (BMP) pathway has been reported to be involved in cancer, and more recently in leukaemia development and progression. In the present study, we analyse whether acute lymphoblastic leukaemia (ALL) cells can affect the differentiation of dendritic cells and macrophages and the involvement of BMP pathway in the process. We show that ALL cells produce BMP4 and that conditioned media from ALL cells promote the generation of dendritic cells with immunosuppressive features and skew M1-like macrophage polarization towards a less pro-inflammatory phenotype. Likewise, BMP4 overexpression in ALL cells potentiates their ability to induce immunosuppressive dendritic cells and favours the generation of M2-like macrophages with pro-tumoral features. These results suggest that BMP4 is in part responsible for the alterations in dendritic cell and macrophage differentiation produced by ALL cells.

Keywords: BMP4; acute lymphoblastic leukaemia; dendritic cells; macrophages; tumour immune microenvironment.


Conflict of interest statement

The authors declare no conflict of interest.

Figures

Figure 1
Figure 1
ALL cells alter the differentiation of dendritic cells (DCs). (A) Percentages of CD1a+ CD14−/lo, CD1ahi CD14−/lo and CD1a CD14+ cells recovered after 5–6 days of culture in the absence (white bars; DCs) or presence (grey bars; CM-DCs) of conditioned media from ALL cells. Data represent the mean ± SEM of 12 to 15 independent experiments. (B) Representative dot plots showing CD14 versus CD1a expression. Percentages of CD1ahi CD14−/lo and CD1a CD14+ cell populations, delimited by red gates, are shown. (C) Real-time PCR quantification of mRNA levels in DCs differentiated from monocytes in the absence (white bars) or presence (grey bars) of conditioned media from ALL cells. Relative mRNA expression was calculated by dividing all individual data by the mean expression in control DCs. Results represent the mean ± SEM of five to seven independent experiments. (D) Histograms show the percentages of proliferating CD4+ and CD8+ T cells, gated on the CD3+ cell population and calculated by the CFSE dilution method in mixed lymphocyte reaction assays. Data are the mean ± SEM of seven independent experiments. Supernatants from DC/T cell co-cultures were harvested at day 5-6 and the amount of IFN-γ was quantified by ELISA. Data are the mean ± SEM of three to six independent experiments. Asterisks represent statistically significant differences between DCs and CM-DCs (* p ≤ 0.05, ** p ≤ 0.01 and *** p ≤ 0.001; by Mann–Whitney test).
Figure 2
Figure 2
BMP4-overexpressing ALL cells exhibit a higher capacity to generate immunosuppressive DCs. (A) Percentages of CD1a+ CD14−/lo, CD1ahi CD14−/lo and CD1a CD14+ cells recovered after 5–6 days of culture in the presence of conditioned media from control (grey bars; CM-DCs) and BMP4-transduced (black bars; BMP/CM-DCs) ALL cells. Data represent the mean ± SEM of 10 to 12 independent experiments. (B) Representative histograms showing CD1a expression in CM- and BMP/CM-DCs. Percentages of CD1ahi cells are shown. For comparison, red line shows CD1a expression in DCs grown in the absence of conditioned media. (C) Real-time PCR quantification of mRNA levels in DCs differentiated from monocytes in the presence of conditioned media from control (grey bars) and BMP4-transduced (black bars) ALL cells. Relative mRNA expression was calculated by dividing all individual data by the mean expression in CM-DCs. Results represent the mean ± SEM of three to six independent experiments. (D) Histograms show the percentages of proliferating CD4+ and CD8+ T cells, gated on the CD3+ cell population and calculated by the CFSE dilution method in mixed lymphocyte reaction assays. Data are the mean ± SEM of four to six independent experiments. Supernatants from DC/T cell co-cultures were harvested at day 5–6 and the amount of IFN-γ was quantified by ELISA. Data are the mean ± SEM of five to six independent experiments. Asterisks represent statistically significant differences between CM-DCs and BMP/CM-DCs (* p ≤ 0.05; by Mann–Whitney test).
Figure 3
Figure 3
ALL cells promote M2-like macrophage (MØ) differentiation. (A) Percentages of CD14+ CD163+ MØs generated from monocytes cultured for five days with GM-CSF (black bars; M1), M-CSF (white bars, M2) and GM-CSF plus conditioned media from ALL cells (grey bars; CM-M1). Data represent the mean ± SEM of 12 independent experiments. (B) Representative dot plots showing CD14 versus CD163 expression. Percentages of CD14+ CD163+ MØs, delimited by red gates, are shown. (C,D) Real-time PCR quantification of mRNA levels in MØs differentiated from monocytes after 3 days of culture with GM-CSF, M-CSF and GM-CSF plus conditioned media from ALL cells. Relative mRNA expression in (D) was calculated by dividing all individual data by the mean expression in M1 MØs. Results represent the mean ± SEM of three to ten independent experiments. Asterisks represent statistically significant differences between M1 and CM-M1 MØs (* p ≤ 0.05 and *** p ≤ 0.001; by Mann–Whitney test).
Figure 4
Figure 4
BMP4 overexpression in ALL cells potentiates their ability to generate M2-like MØs. (A) Percentages of CD14+ CD163+ MØs generated from monocytes cultured for five days with GM-CSF plus conditioned media from control (grey bars; CM-M1) and BMP4-transduced (white bars; BMP/CM-M1) ALL cells. Data represent the mean ± SEM of four independent experiments. (B) Representative histograms showing CD163 expression in CM-M1 and BMP/CM-M1 MØs. (C,D) Real-time PCR quantification of mRNA levels in MØs differentiated from monocytes after three days of culture with GM-CSF plus conditioned media from control (grey bars) and BMP4-transduced (white bars) ALL cells. Relative mRNA expression was calculated by dividing all individual data by the mean expression in CM-M1 MØs. Results represent the mean ± SEM of three to five independent experiments. Asterisks represent statistically significant differences between CM-M1 and BMP/CM-M1 MØs (* p ≤ 0.05 and ** p ≤ 0.01; by Mann–Whitney test).

References

    1. Shen M., Kang Y. Complex interplay between tumor microenvironment and cancer therapy. Front Med. 2018;12:426–439. doi: 10.1007/s11684-018-0663-7. - DOI - PubMed
    1. Wang M., Zhao J., Zhang L., Wei F., Lian Y., Wu Y., Gong Z., Zhang S., Zhou J., Cao K., et al. Role of tumor microenvironment in tumorigenesis. J. Cancer. 2017;8:761–773. doi: 10.7150/jca.17648. - DOI - PMC - PubMed
    1. Belli C., Trapani D., Viale G., D’Amico P., Duso B.A., Della Vigna P., Orsi F., Curigliano G. Targeting the microenvironment in solid tumors. Cancer Treat Rev. 2018;65:22–32. doi: 10.1016/j.ctrv.2018.02.004. - DOI - PubMed
    1. Roma-Rodrigues C., Mendes R., Baptista P.V., Fernandes A.R. Targeting Tumor Microenvironment for Cancer Therapy. Int. J. Mol. Sci. 2019;20 doi: 10.3390/ijms20040840. - DOI - PMC - PubMed
    1. Tabe Y., Konopleva M. Advances in understanding the leukaemia microenvironment. Br. J. Haematol. 2014;164:767–778. doi: 10.1111/bjh.12725. - DOI - PMC - PubMed

Publication types

MeSH terms

Substances

LinkOut - more resources