

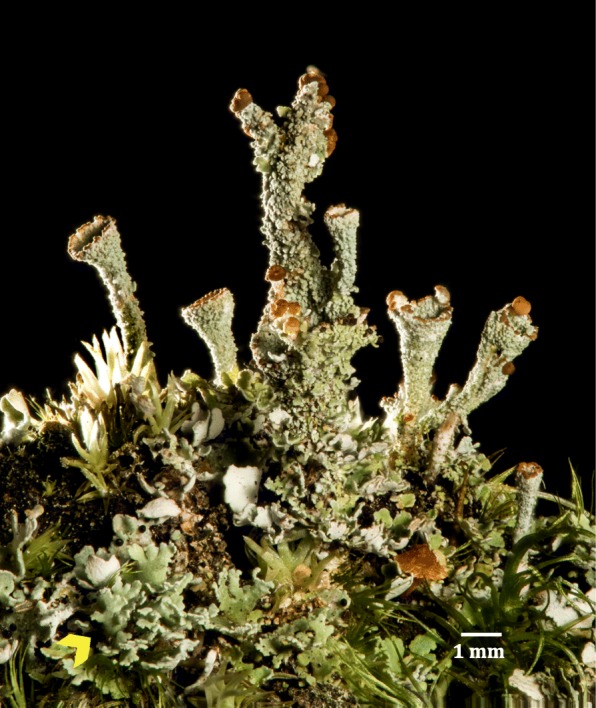
The lichen symbiosis re-viewed through the genomes of Cladonia grayi and its algal partner Asterochloris glomerata
- PMID: 31337355
- PMCID: PMC6652019
- DOI: 10.1186/s12864-019-5629-x
The lichen symbiosis re-viewed through the genomes of Cladonia grayi and its algal partner Asterochloris glomerata
Abstract
Background: Lichens, encompassing 20,000 known species, are symbioses between specialized fungi (mycobionts), mostly ascomycetes, and unicellular green algae or cyanobacteria (photobionts). Here we describe the first parallel genomic analysis of the mycobiont Cladonia grayi and of its green algal photobiont Asterochloris glomerata. We focus on genes/predicted proteins of potential symbiotic significance, sought by surveying proteins differentially activated during early stages of mycobiont and photobiont interaction in coculture, expanded or contracted protein families, and proteins with differential rates of evolution.
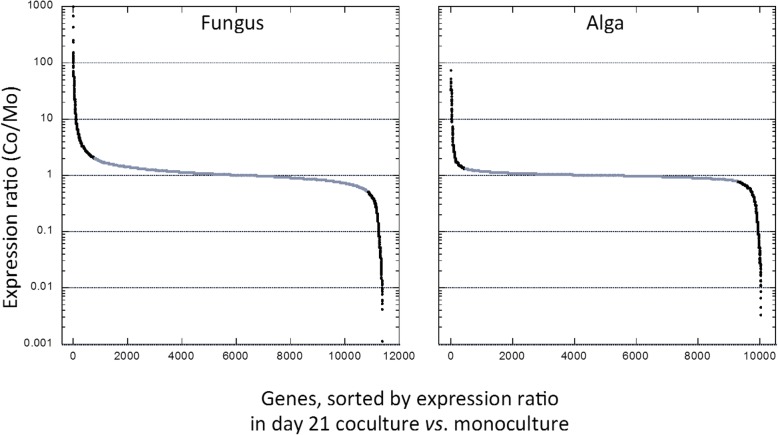
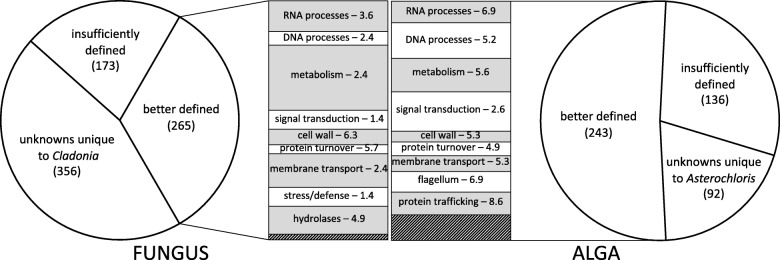
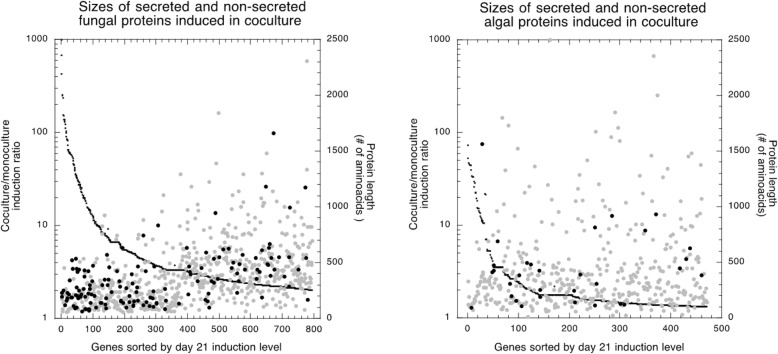
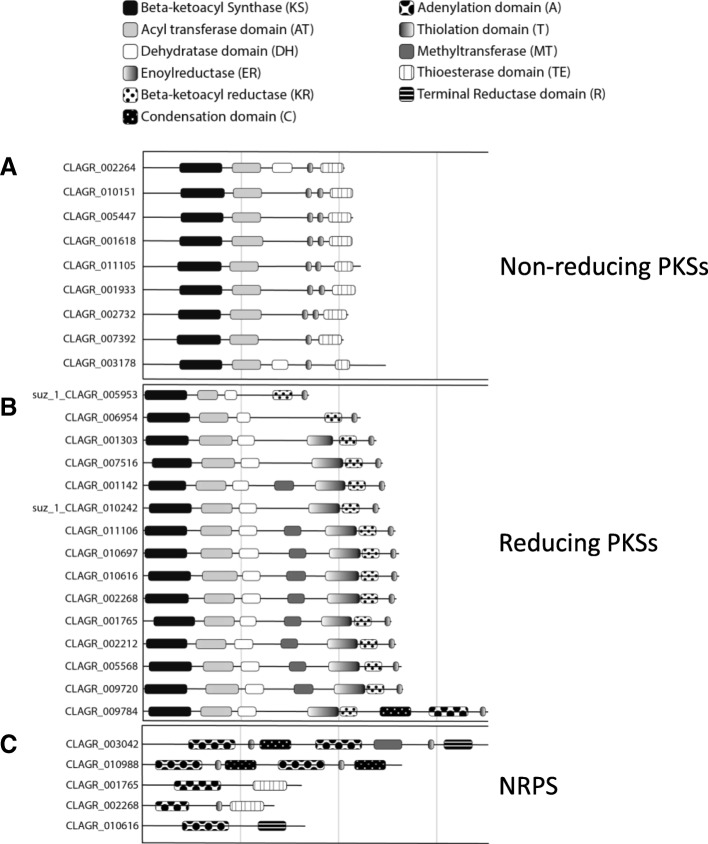
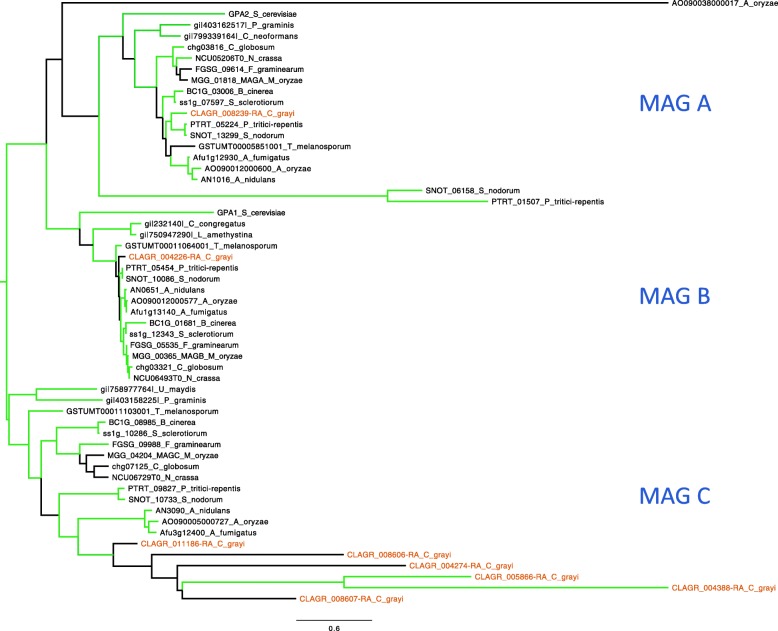
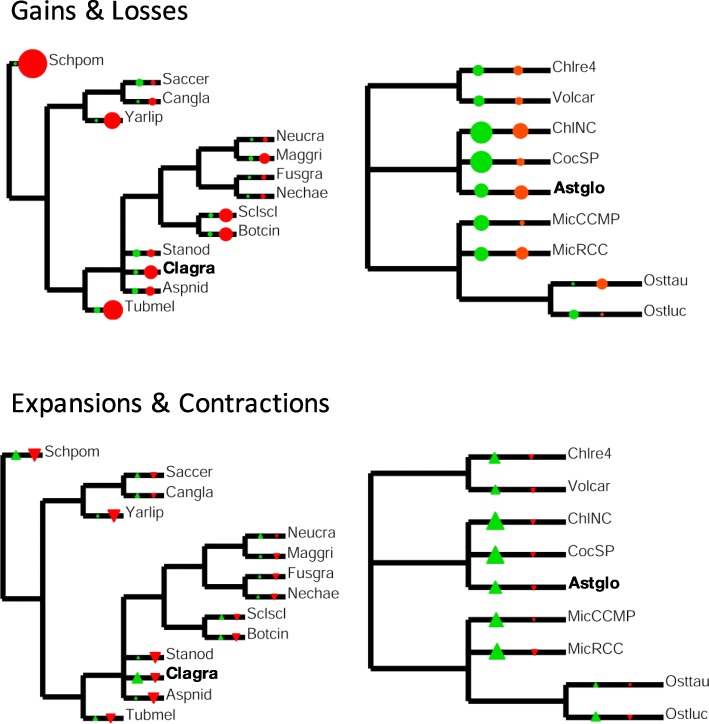
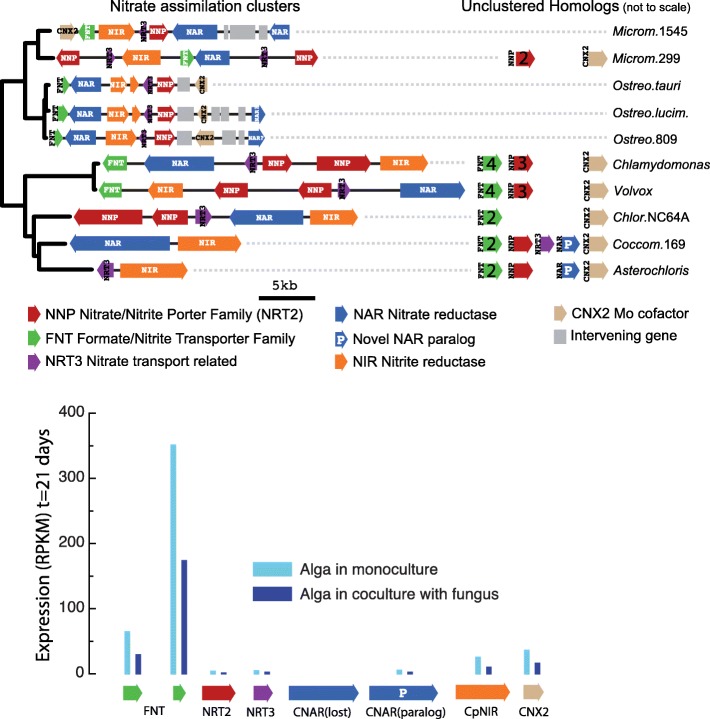
Results: A) In coculture, the fungus upregulated small secreted proteins, membrane transport proteins, signal transduction components, extracellular hydrolases and, notably, a ribitol transporter and an ammonium transporter, and the alga activated DNA metabolism, signal transduction, and expression of flagellar components. B) Expanded fungal protein families include heterokaryon incompatibility proteins, polyketide synthases, and a unique set of G-protein α subunit paralogs. Expanded algal protein families include carbohydrate active enzymes and a specific subclass of cytoplasmic carbonic anhydrases. The alga also appears to have acquired by horizontal gene transfer from prokaryotes novel archaeal ATPases and Desiccation-Related Proteins. Expanded in both symbionts are signal transduction components, ankyrin domain proteins and transcription factors involved in chromatin remodeling and stress responses. The fungal transportome is contracted, as are algal nitrate assimilation genes. C) In the mycobiont, slow-evolving proteins were enriched for components involved in protein translation, translocation and sorting.
Conclusions: The surveyed genes affect stress resistance, signaling, genome reprogramming, nutritional and structural interactions. The alga carries many genes likely transferred horizontally through viruses, yet we found no evidence of inter-symbiont gene transfer. The presence in the photobiont of meiosis-specific genes supports the notion that sexual reproduction occurs in Asterochloris while they are free-living, a phenomenon with implications for the adaptability of lichens and the persistent autonomy of the symbionts. The diversity of the genes affecting the symbiosis suggests that lichens evolved by accretion of many scattered regulatory and structural changes rather than through introduction of a few key innovations. This predicts that paths to lichenization were variable in different phyla, which is consistent with the emerging consensus that ascolichens could have had a few independent origins.
Keywords: Algal virus; Coculture; Fungi; Gene expression; Gene family evolution; Horizontal gene transfer; Plant-fungal interactions; Symbiont autonomy; Symbiosis genes.
Conflict of interest statement
The authors declare that they have no competing interests.
Figures
References
-
- Grube M, Wedin M. Lichenized Fungi and the Evolution of Symbiotic Organization. Microbiol Spectr. 2016;4(6):1–17. - PubMed
-
- Arnold AE, Miadlikowska J, Higgins KL, Sarvate SD, Gugger P, Way A, Hofstetter V, Kauff F, Lutzoni F. A Phylogenetic Estimation of Trophic Transition Networks for Ascomycetous Fungi: Are Lichens Cradles of Symbiotrophic Fungal Diversification? Syst Biol. 2009;58(3):283–297. doi: 10.1093/sysbio/syp001. - DOI - PubMed
