Randomized Controlled Trial
. 2019 Jul 23;16(1):95.
doi: 10.1186/s12984-019-0558-0.

Influences of the biofeedback content on robotic post-stroke gait rehabilitation: electromyographic vs joint torque biofeedback

Affiliations
Randomized Controlled Trial

Influences of the biofeedback content on robotic post-stroke gait rehabilitation: electromyographic vs joint torque biofeedback

Federica Tamburella et al. J Neuroeng Rehabil. .

Abstract

Background: Add-on robot-mediated therapy has proven to be more effective than conventional therapy alone in post-stroke gait rehabilitation. Such robot-mediated interventions routinely use also visual biofeedback tools. A better understanding of biofeedback content effects when used for robotic locomotor training may improve the rehabilitation process and outcomes.

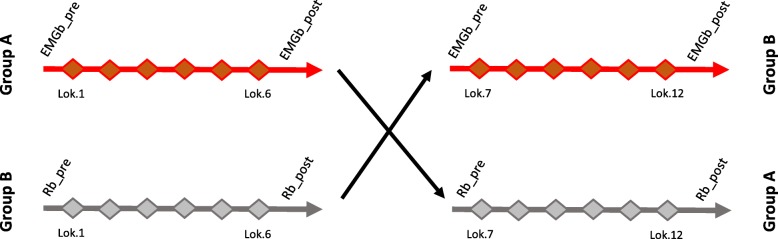
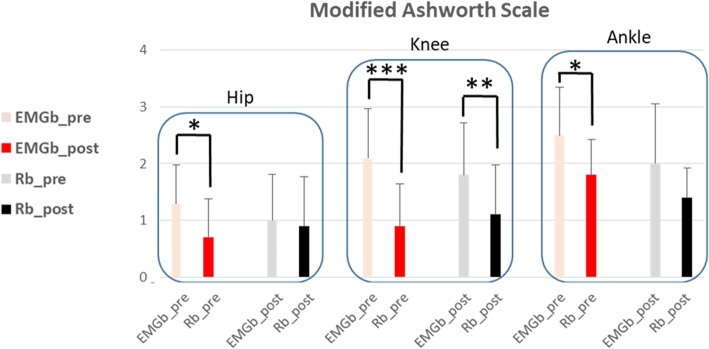
Methods: This randomized cross-over pilot trial aimed to address the possible impact of different biofeedback contents on patients' performance and experience during Lokomat training, by comparing a novel biofeedback based on online biological electromyographic information (EMGb) versus the commercial joint torque biofeedback (Rb) in sub-acute non ambulatory patients. 12 patients were randomized into two treatment groups, A and B, based on two different biofeedback training. For both groups, study protocol consisted of 12 Lokomat sessions, 6 for each biofeedback condition, 40 min each, 3 sessions per week of frequency. All patients performed Lokomat trainings as an add-on therapy to the conventional one that was the same for both groups and consisted of 40 min per day, 5 days per week. The primary outcome was the Modified Ashworth Spasticity Scale, and secondary outcomes included clinical, neurological, mechanical, and personal experience variables collected before and after each biofeedback training.

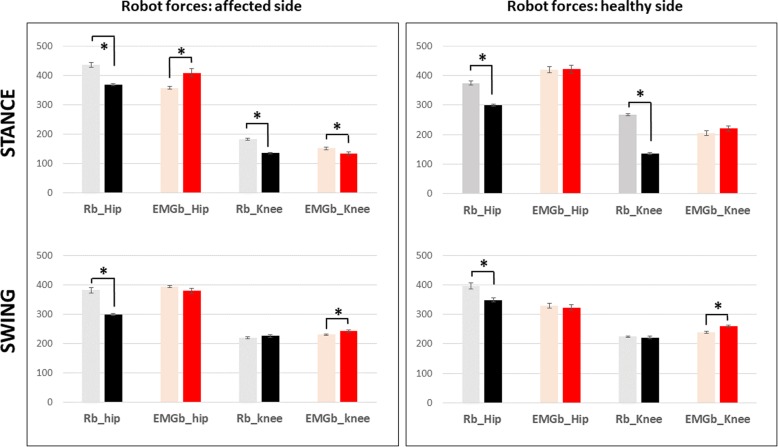
Results: Lokomat training significantly improved gait/daily living activity independence and trunk control, nevertheless, different effects due to biofeedback content were remarked. EMGb was more effective to reduce spasticity and improve muscle force at the ankle, knee and hip joints. Robot data suggest that Rb induces more adaptation to robotic movements than EMGb. Furthermore, Rb was perceived less demanding than EMGb, even though patient motivation was higher for EMGb. Robot was perceived to be effective, easy to use, reliable and safe: acceptability was rated as very high by all patients.

Conclusions: Specific effects can be related to biofeedback content: when muscular-based information is used, a more direct effect on lower limb spasticity and muscle activity is evidenced. In a similar manner, when biofeedback treatment is based on joint torque data, a higher patient compliance effect in terms of force exerted is achieved. Subjects who underwent EMGb seemed to be more motivated than those treated with Rb.

Keywords: Biofeedback; Biomechanics; Electromyography; Rehabilitation; Robot; Stroke; Top-down approach.


Conflict of interest statement

The authors declare that they have no competing interests.

Figures

Fig. 1
Fig. 1
Randomized cross-over case control clinical trial schema. Group A stroke patients underwent 6 EMGb followed by 6Rb Lokomat trainings. Group B stroke patients underwent 6 Rb followed by 6 EMGb Lokomat trainings. For each subject the total amount of training was of 12 sessions
Fig. 2
Fig. 2
Representative average muscle activation of biceps femori, gastrocnemius and soleus for the first (S1) and the last (S6) training session with EMGb and Rb for PT1 (shadowed area in yellow for Rb and green for EMGB). Reference activation pattern used to compare against to compute the biofeedback (dotted curves); 16 blocks of biofeedback during the gait cycle with colour representing the assessment of muscle activation (red is underactivation with respect to the reference, blue is overactivation with respect to the reference, transparent is no deviation)
Fig. 3
Fig. 3
Representative image of visual biofeedback provided to the patient (PT6) according to on-line EMG activity during first (a) and last (b) EMGb training session. EMG data were displayed on the screen with 4 colour stripes partitioned into 16 stages within the gait cycle. First stripe referred to VL-RF, second stripe refers to BF, third stripe referred to GM-SOL and last stripe referred to TA. Coloured lines in the patient’s feedback were generated as follows: i) Red colour means that the signal is higher than in the template, or ii) Blue means that the signal is lower than in the template. From Fig. 3-b is evident a more physiological muscle activity during the whole gait cycle
Fig. 4
Fig. 4
Standard display of commercial joint torque biofeedback (Rb) implemented in the Lokomat for gait training. BFB values are available for the right and left hip and knee joints as well as for stance and swing phases. Each point represents the BFB value of one stride. Data are displayed in a line diagram, which is updated for each stride and torque values are displayed in independent subplots for each one of the four joints. Swing and stance phase are color-coded. In this Figure a positive feedback is provided for all joints, especially for the knees, during stance phase indicating that the patient actively moves joints according to the reference trajectories, while during the swing phase, particularly for the hips, patient dos not contribute to the walking movement than the robot has to exert torque in order to maintain the desired reference trajectory
Fig. 5
Fig. 5
Modified Ashworth Scale (MAS) results at hip, knee and ankle, for the 10 patient’s cohort. Red columns refer to EMGb Lokomat trainings, while black one to Rb Lokomat trainings. For both EMGb and Rb groups, light columns represent MAS score before 6 Lokomat trainings (EMGb_pre or Rb_pre), while the darkest ones MAS score after 6 Lokomat trainings (EMGb_post or Rb_post). Statistical significance are reported for the comparison EMGb_pre vs EMGb_post and Rb_pre vs Rb_post (*: p < 0.05, **: p < 0.005, ***: p < 0.001)
Fig. 6
Fig. 6
Manual Muscle Test (MMT) results for the 10 patients’ cohort at hip, knee and ankle flexor and extensor muscles. Red columns refer to EMGb Lokomat trainings, while black one to Rb Lokomat trainings. For both EMGb and Rb groups, light columns represent MMT score before 6 Lokomat trainings, while the darkest ones MMT score after 6 Lokomat trainings. Statistical significance are reported for the comparison EMGb_pre vs EMGb_post and Rb_pre vs Rb_post (*: p < 0.05, **: p < 0.005, ***: p < 0.001)
Fig. 7
Fig. 7
Acceptability and usability data of patients’ experience about Lokomat treatment per the QUEST 2.0 results
Fig. 8
Fig. 8
Mood, satisfaction and motivation data are detailed. Upper part of the figure (a) reports visual Analogue Scale (VAS) scales results about motivation, mood and satisfaction for the 10 patients’ cohort, while lower part of the figure (b) reports Questionnaire of current motivation (QCM) data for the 10 patients’ cohort. Red columns refer to EMGb Lokomat trainings, while black one to Rb Lokomat trainings. For both EMGb and Rb groups, light columns represent data score before 6 Lokomat trainings, while the darkest ones scores after 6 Lokomat trainings. Statistical significance are reported for the comparison EMGb_pre vs EMGb_post and Rb_pre vs Rb_post (*: p < 0.05, **: p < 0.005, ***: p < 0.001)
Fig. 9
Fig. 9
Mean joint forces of stance and swing phase for the affected and not affected leg in the subgroup of patients. Red columns refer to EMGb Lokomat trainings, while black one to Rb Lokomat trainings. For both EMGb and Rb groups, light columns represent the average score before 6 Lokomat trainings, while the darkest ones the score after 6 Lokomat trainings. Statistical significances are reported for the comparison EMGb_pre vs EMGb_post and Rb_pre vs Rb_post (*: p < 0.05, **: p < 0.005, ***: p < 0.001)

Similar articles

Cited by

References

    1. Feigin VL, Krishnamurthi RV, Parmar P, Norrving B, Mensah GA, Bennett DA, et al. Update on the global burden of ischemic and hemorrhagic stroke in 1990-2013: the GBD 2013 study. Neuroepidemiology. 2015;45(3):161–176. doi: 10.1159/000441085. - DOI - PMC - PubMed
    1. Bruni MF, Melegari C, De Cola MC, Bramanti A, Bramanti P, Calabro RS. What does best evidence tell us about robotic gait rehabilitation in stroke patients: a systematic review and meta-analysis. J Clin Neurosci. 2018;48:11–17. doi: 10.1016/j.jocn.2017.10.048. - DOI - PubMed
    1. Harris JE, Eng JJ. Goal priorities identified through client-Centred measurement in individuals with chronic stroke. Physiother Can. 2004;56(3):171–176. doi: 10.2310/6640.2004.00017. - DOI - PMC - PubMed
    1. Portelli R, Lowe D, Irwin P, Pearson M, Rudd AG. Intercollegiate stroke working P. institutionalization after stroke. Clin Rehabil. 2005;19(1):97–108. doi: 10.1191/0269215505cr822oa. - DOI - PubMed
    1. Bohannon RW. Standing balance, lower extremity muscle strength, and walking performance of patients referred for physical therapy. Percept Mot Skills. 1995;80(2):379–385. doi: 10.2466/pms.1995.80.2.379. - DOI - PubMed

Publication types