. 2019 Sep;7(9):1412-1425.
doi: 10.1158/2326-6066.CIR-19-0258. Epub 2019 Jul 23.

Engineered Adoptive T-cell Therapy Prolongs Survival in a Preclinical Model of Advanced-Stage Ovarian Cancer

Affiliations

Engineered Adoptive T-cell Therapy Prolongs Survival in a Preclinical Model of Advanced-Stage Ovarian Cancer

Kristin G Anderson et al. Cancer Immunol Res. 2019 Sep.

Abstract

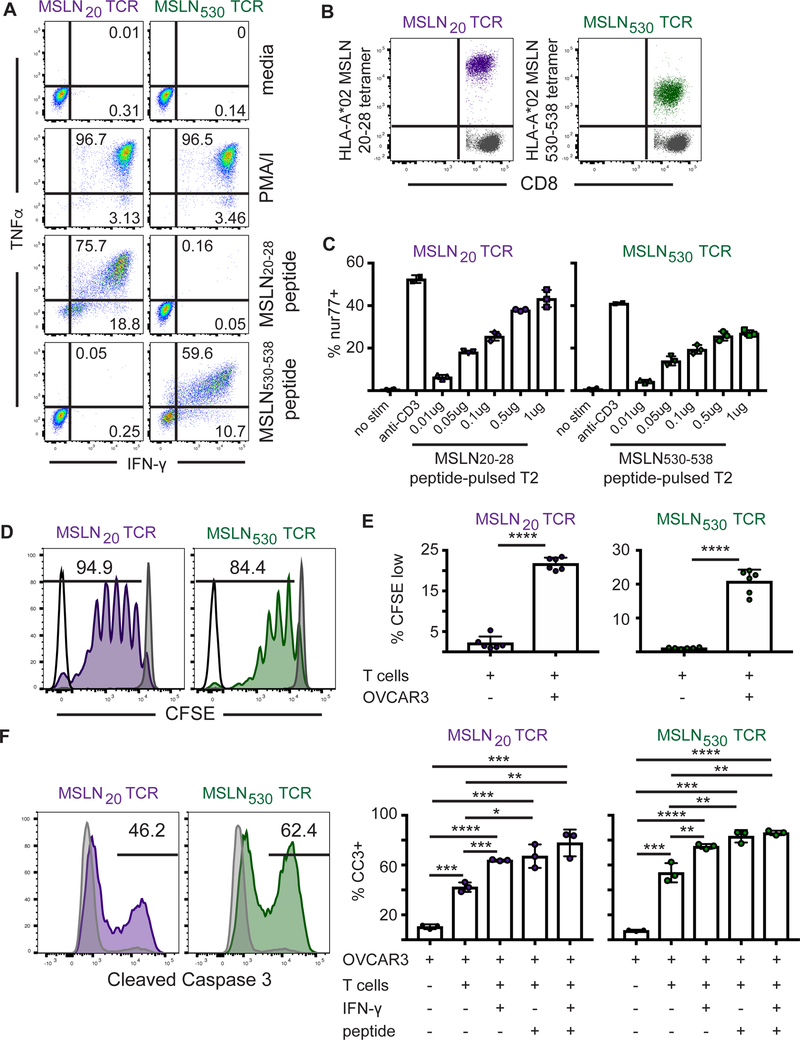
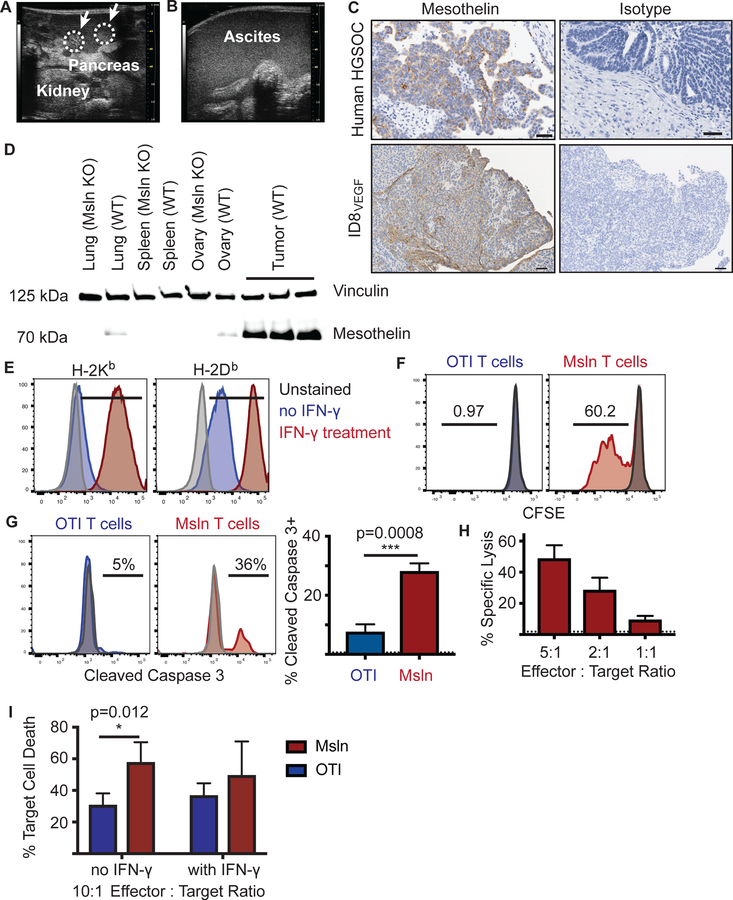
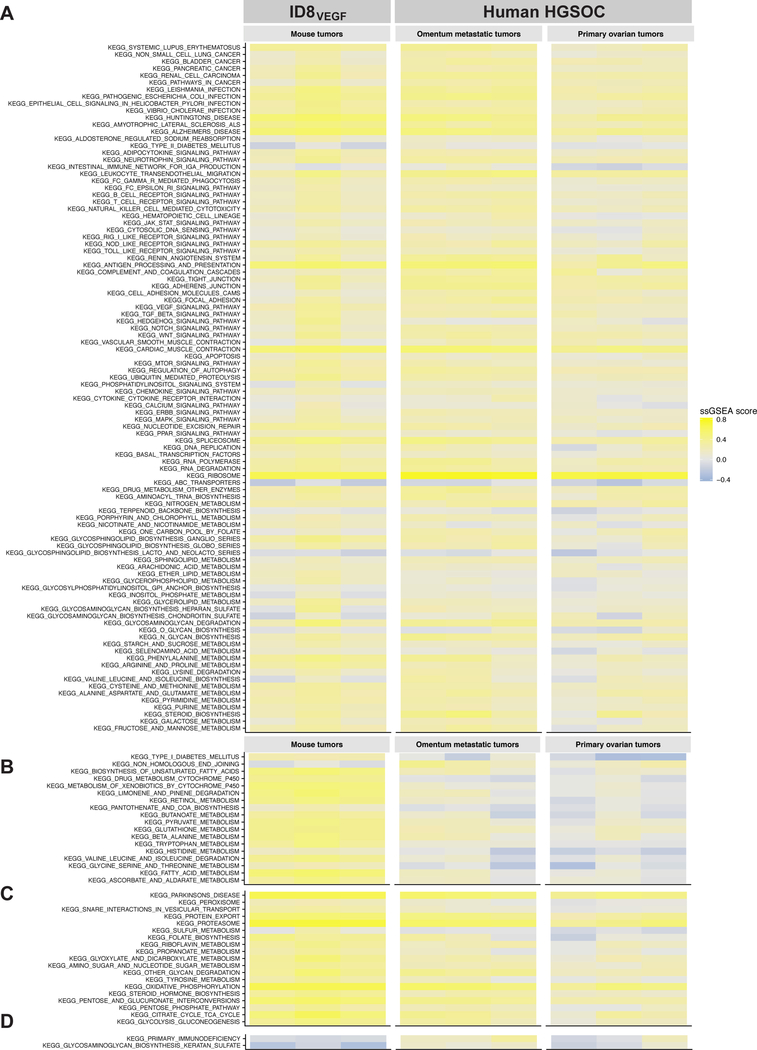
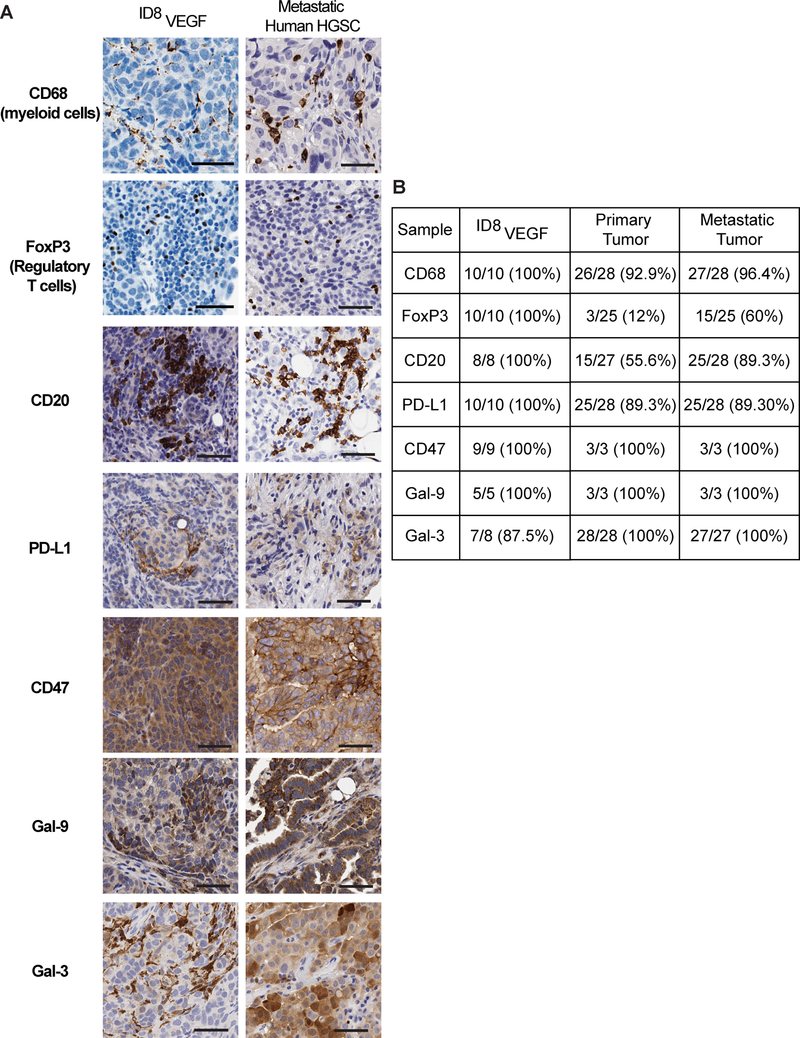
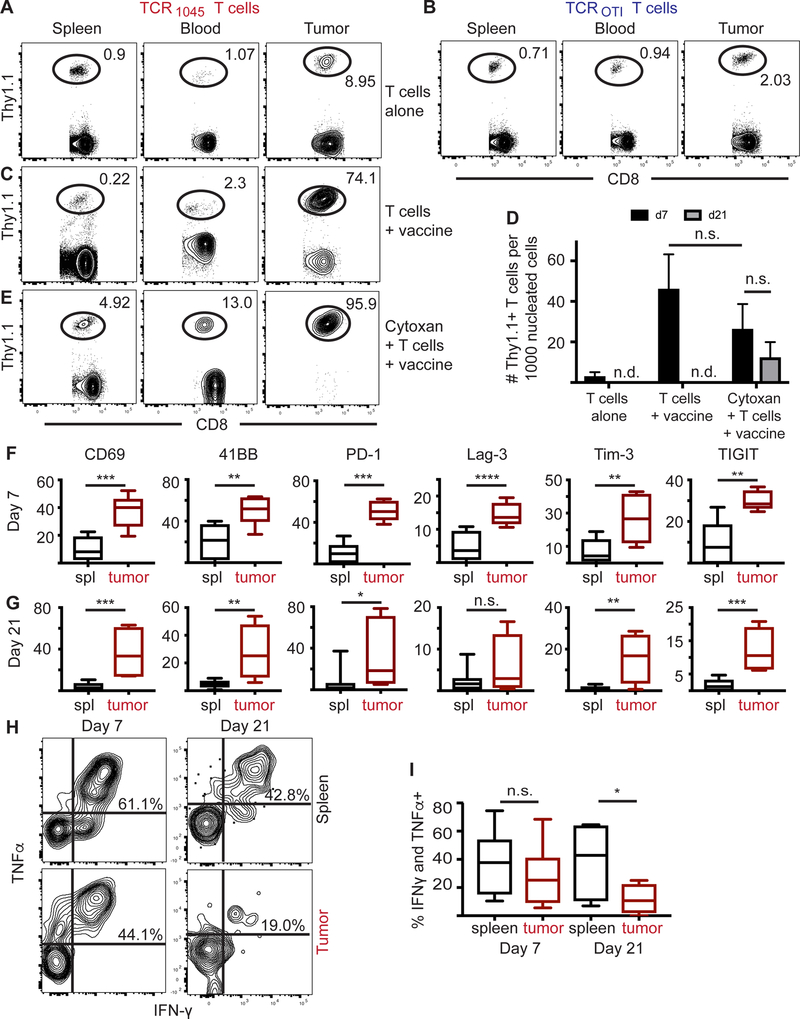
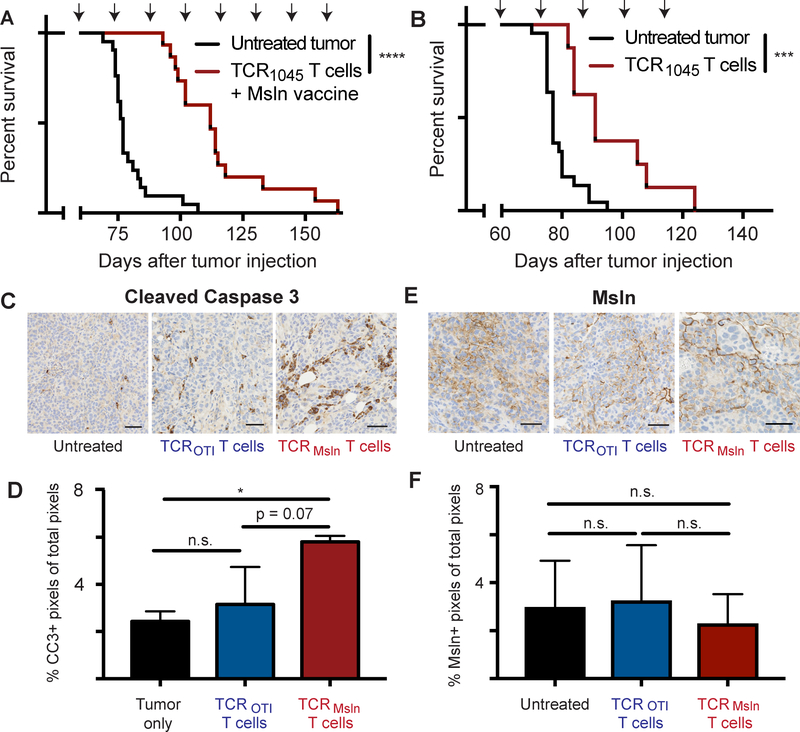
Adoptive T-cell therapy using high-affinity T-cell receptors (TCR) to target tumor antigens has potential for improving outcomes in high-grade serous ovarian cancer (HGSOC) patients. Ovarian tumors develop a hostile, multicomponent tumor microenvironment containing suppressive cells, inhibitory ligands, and soluble factors that facilitate evasion of antitumor immune responses. Developing and validating an immunocompetent mouse model of metastatic ovarian cancer that shares antigenic and immunosuppressive qualities of human disease would facilitate establishing effective T-cell therapies. We used deep transcriptome profiling and IHC analysis of human HGSOC tumors and disseminated mouse ID8VEGF tumors to compare immunologic features. We then evaluated the ability of CD8 T cells engineered to express a high-affinity TCR specific for mesothelin, an ovarian cancer antigen, to infiltrate advanced ID8VEGF murine ovarian tumors and control tumor growth. Human CD8 T cells engineered to target mesothelin were also evaluated for ability to kill HLA-A2+ HGSOC lines. IHC and gene-expression profiling revealed striking similarities between tumors of both species, including processing/presentation of a leading candidate target antigen, suppressive immune cell infiltration, and expression of molecules that inhibit T-cell function. Engineered T cells targeting mesothelin infiltrated mouse tumors but became progressively dysfunctional and failed to persist. Treatment with repeated doses of T cells maintained functional activity, significantly prolonging survival of mice harboring late-stage disease at treatment onset. Human CD8 T cells engineered to target mesothelin were tumoricidal for three HGSOC lines. Treatment with engineered T cells may have clinical applicability in patients with advanced-stage HGSOC.


Conflict of interest statement

Conflict of Interest statement: P.D.G. and S.K.O. have patents with and P.D.G. is a scientific consultant for Juno Therapeutics.

Figures

Figure 1.
Figure 1.. Engineered human MSLN-specific T cells recognize and lyse human ovarian cancer cells.
A). Intracellular cytokine staining of primary T cells engineered to express MSLN20 or MSLN530 TCRs. Engineered T cells were stimulated for 5 hours with PMA/I or cognate peptide and cytokine production was measured. B) HLA-A2 tetramer staining of MSLN20 or MSLN530 TCR-expressing primary T cells. The gray population represents untransduced control CD8 T cells from PBMC. C) Jurkat reporter T cells expressing MSLN20- or MSLN530-specific TCRs were co-cultured with peptide-pulsed HLA-A2+ T2 cells for 24 hours and evaluated for induction of nur77-mCherry+ expression. D) Representative plot of CFSE dilution of MSLN20- or MSLN530 TCR-expressing primary T cells after co-culture with peptide-pulsed HLA-A2+ T2 cells for 7 days. MSLN20–28-specific T cells in purple. MSLN530–538-specific T cells in green. E) Quantitation of CFSE dilution of MSLN20 or MSLN530-specific TCR-expressing primary T cells after co-culture with OVCAR3 tumor cells for 7 days. F) OVCAR3 tumor cells (with or without exposure to IFNγ at 10ng/ml for 24 hours) were pulsed with media or 1μg peptide for 90 minutes and co-cultured at a 5:1 E:T ratio with MSLN20–28- or MSLN530–538-specific T cells for 24 hours. Following co-culture, OVCAR3 cells were stained for Cleaved Caspase 3. Killing by MSLN20–28-specific T cells in purple. Killing by MSLN530–538-specific T cells in green. Gray histograms represent CC3 staining in control tumor cells. Data are shown +/− SD. All data are representative of 2–3 independent experiments.
Figure 2.
Figure 2.. Engineered murine TCR1045 T cells lyse murine ovarian cancer cells.
A) High-resolution ultrasound of ID8VEGF tumor development in the peritoneal cavity (8 weeks after injection). White arrows with circles demarcate tumor nodules in the pancreas. B) High resolution ultrasound of advanced disease. Anechoic ultrasound pattern indicates ascites development in the peritoneal cavity and obscures tissue landmarks. C) Immunohistochemistry for MSLN/Msln in human high-grade serous ovarian cancer or ID8VEGF tumors. Images are representative of 15 ID8VEGF tumors and 31 HGSOC samples. D) Immunoblot analyses of wild type or Msln knockout mouse tissues and ID8VEGF tumors for Msln protein expression. Vinculin was used as the loading control. Representative of 2 independent experiments. E) MHC I expression on ID8VEGF tumor cells with or without IFNγ exposure (10ng/ml for 24 hours). F) CFSE dilution of TCR1045 or control TCROTI T cells after co-culture with ID8VEGF tumor cells for 5 days. G) Cleaved Caspase 3 expression in ID8VEGF tumor cells after co-culture with TCR1045 or control TCROTI T cells for 16 hours. Dotted line at 0.64% represents average frequency of CC3+ staining in ID8VEGF tumor cells at the equivalent time after plating without co-culture. H) Cytolysis of ID8VEGF tumor cells after co-culture with TCR1045 or irrelevant TCROTI T cells for 16 hours, measured by impedance of an electrical signal by target cells (xCELLigence platform). Dotted line at 1.89% represents the average background lysis by TCROTI T cells. I) Percent of ID8VEGF target cell death by live cell quantification after co-culture with TCR1045 or control TCROTI T cells for 16 hours. All data are representative of 2–3 independent experiments. White arrows indicate tumor nodules. Scale bar = 50 microns. Data are shown +/− SD.
Figure 3.
Figure 3.. Deep transcriptome profiling of ID8VEGF and HGSOC tumors reveals very similar gene expression profiles.
A) 98 of 177 total KEGG pathways contain genes related to T-cell function. No significant expression differences were found in these genes between mouse tumor samples, human primary ovarian tumors, or human metastatic omental tumors. B) 18 KEGG pathways revealed significant differences (FDR 1%) between mouse tumor samples and human ovarian cancer (both primary ovarian tumors and metastatic omental tumors). C) 19 KEGG pathways revealed significant differences (FDR 1%) between mouse tumor samples and human primary ovarian tumors but not with human metastatic omental tumors. D) 2 KEGG pathways were significantly different (FDR 1%) between mouse tumor samples and human metastatic omental tumors but not with human primary ovarian tumors. No KEGG pathways were declared as significantly different between human primary ovarian tumors and human metastatic omental tumors.
Figure 4.
Figure 4.. ID8VEGF tumors recapitulate immunosuppressive features of the human HGSOC TME.
A) IHC of ID8VEGF tumors or human metastatic HGSOC tumors for CD68, FoxP3, CD20, PD-L1, CD47, Galectin-9, or Galectin-3. IHC images are representative of 6 mice or 28 human tumor samples. Scale bar = 50 microns. B) Proportion of samples in which positive staining for each protein was observed.
Figure 5.
Figure 5.. TCR1045 T cells accumulate and become dysfunctional in ID8VEGF tumors
Flow plots in A-C and E are representative flow plots from 2–3 independent experiments with 5–9 mice per treatment. Mice were euthanized and analyzed by flow cytometry 7 days after T-cell injection for donor T-cell infiltration (Thy1.1+ in Thy1.2+ host). A, B) 1×10⁷ TCR1045 or TCROTI Thy1.1+ T cells were injected i.v. into tumor-bearing mice. C) 1×10⁷ TCR1045 Thy1.1+ T cells were injected i.p. with peptide-pulsed irradiated splenocytes (5:1 APC:T-cell ratio). Note: for injections that include T cells and peptide-pulsed irradiated splenocytes, mice were injected i.p. due to respiratory distress if administered i.v. D) Quantification from all mice of donor TCR1045 Thy1.1+ T cells in tumors 7 or 21 days after T-cell transfer. n.d. = not detectable. E) Tumor-bearing mice received cyclophosphamide pre-treatment and, after >6-hour delay to allow for drug clearance, were injected i.p. with 1×10⁷ TCR1045 Thy1.1+ T cells and peptide-pulsed irradiated splenocytes (5:1 APC:T-cell ratio). F, G) Frequency of TCR1045 T cells expressing indicated molecules, isolated from spleen (black) or tumor (red) F) 7 days or (G) 21 days after transfer. n.s. = not significant H, I) 7 or 21 days after T-cell transfer, TCR1045 T cells were isolated from spleen or tumor, stimulated with Msln peptide for 5 hours in vitro, and evaluated for cytokine production. H) Representative flow plots or I) quantitation of double-producing IFNγ+ TNFα+ Thy1.1+ donor T cells isolated from spleen or tumor. Data from D, F, G, and I are aggregated from 3 independent experiments (n=3–8 mice per group). Statistical analysis performed using a student t test. * p<0.05, ** p<0.01, *** p<0.001, **** p<0.0001. n.s. = not significant.
Figure 6.
Figure 6.. TCR1045 T cells prolong survival in ID8VEGF tumor-bearing mice.
A) Tumor-bearing mice received a single dose of cyclophosphamide before the 1st T-cell infusion followed by injections of 1×10⁷ TCR1045 T cells and peptide-pulsed irradiated splenocytes (5:1 APC:T-cell ratio) i.p. every 14 days with 1×10⁴ U IL2 s.c. for 10 days after each infusion. Treatment was initiated 45–52 days after tumor injection, when tumors were detectable by ultrasound. Survival data are aggregated from 4 independent experiments (n=15–21 total per group). B) Tumor-bearing mice received 1×10⁷ TCR1045 T cells i.v. without a vaccine every 14 days with 1×10⁴ U IL2 s.c. for 10 days after each infusion. Therapy was started 45–52 days after tumor injection. Survival data was aggregated from 3 independent experiments (n=8–23 total per group). Survival curve comparison using the Log-rank (Mantel-Cox) or Gehan-Breslow-Wilcoxon tests yielded the same statistical results. *** p<0.0005 **** p < 0.0001. Arrows above survival curves in A and B indicate the timing of T-cell infusions. C) IHC of tumor for Cleaved Caspase 3 following 3 doses of T cells. Untreated tumor-bearing mice were euthanized at the same stage of tumor development to serve as controls. D) Quantitation of CC3 expression by IHC from mice euthanized in panel C above. E) IHC of tumor for Msln following 3 doses of T cells, in mice from panels C and D. Untreated tumor-bearing mice were euthanized at the same stage of tumor development to serve as controls. F) Quantitation of Msln expression by IHC from mice euthanized in panel E above. IHC experiments are representative of 2 independent experiments (n=3 mice per group per experiment). Scale bar = 50 microns. Data are shown +/− SD. Statistical analysis performed using one-way Anova with post-hoc analysis pairwise for multiple comparisons. * p<0.05, n.s. = not significant

References

    1. Lheureux S, Karakasis K, Kohn EC, Oza AM. Ovarian cancer treatment: The end of empiricism? Cancer. 2015;121:3203–11. - PMC - PubMed
    1. Vaughan S, Coward JI, Bast RC, Berchuck A, Berek JS, Brenton JD, et al. Rethinking ovarian cancer: recommendations for improving outcomes. Nat Rev Cancer. Nature Publishing Group; 2011. pages 719–25. - PMC - PubMed
    1. Zsiros E, Tanyi J, Balint K, Kandalaft LE. Immunotherapy for ovarian cancer: recent advances and perspectives. Curr Opin Oncol. 2014;26:492–500. - PubMed
    1. Santoiemma PP, Powell DJ. Tumor infiltrating lymphocytes in ovarian cancer. Cancer Biol Ther. 2015;16:807–20. - PMC - PubMed
    1. Dembić Z, Haas W, Weiss S, McCubrey J, Kiefer H, Boehmer von H, et al. Transfer of specificity by murine alpha and beta T-cell receptor genes. Nature. 1986;320:232–8. - PubMed

Publication types

MeSH terms