. 2019 Aug 6;116(32):15784-15791.
doi: 10.1073/pnas.1900886116. Epub 2019 Jul 23.

A stepwise mechanism for aqueous two-phase system formation in concentrated antibody solutions

Affiliations

A stepwise mechanism for aqueous two-phase system formation in concentrated antibody solutions

Bradley A Rogers et al. Proc Natl Acad Sci U S A. .

Abstract

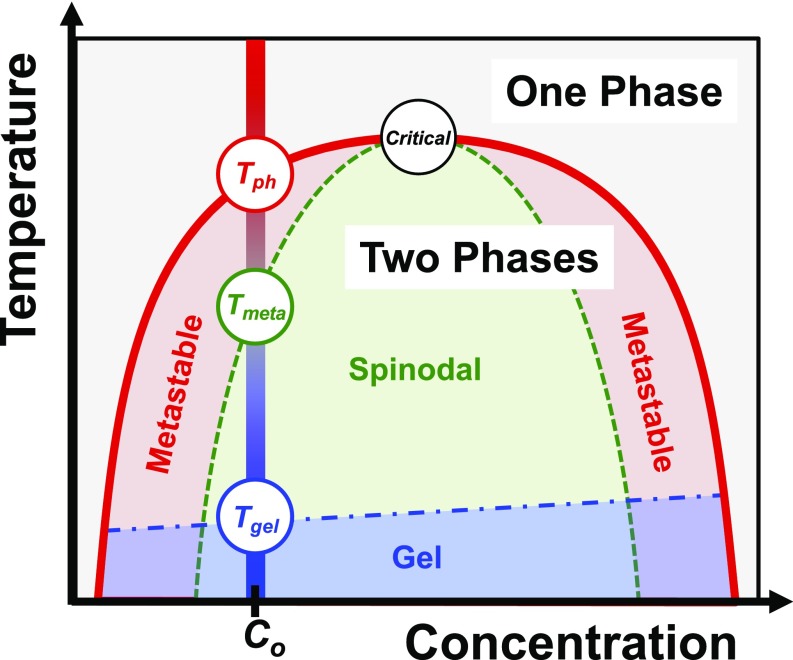
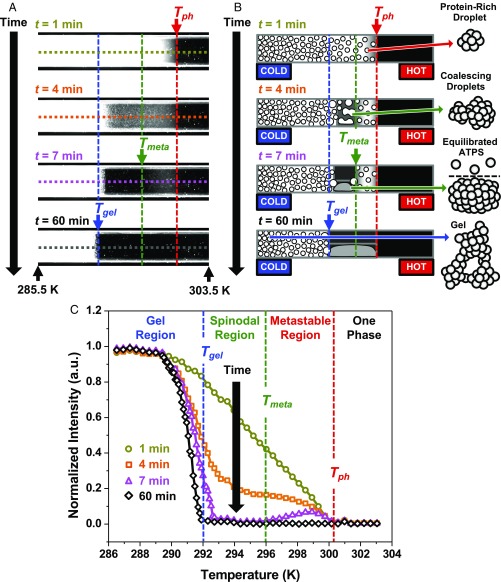
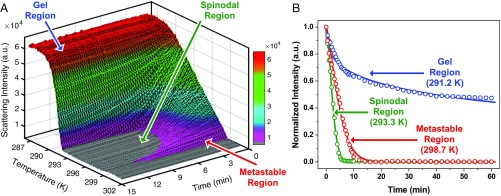
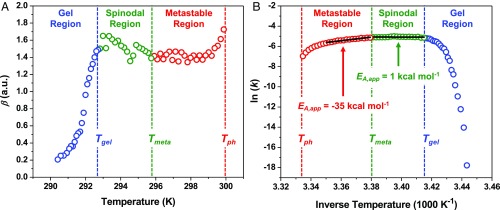
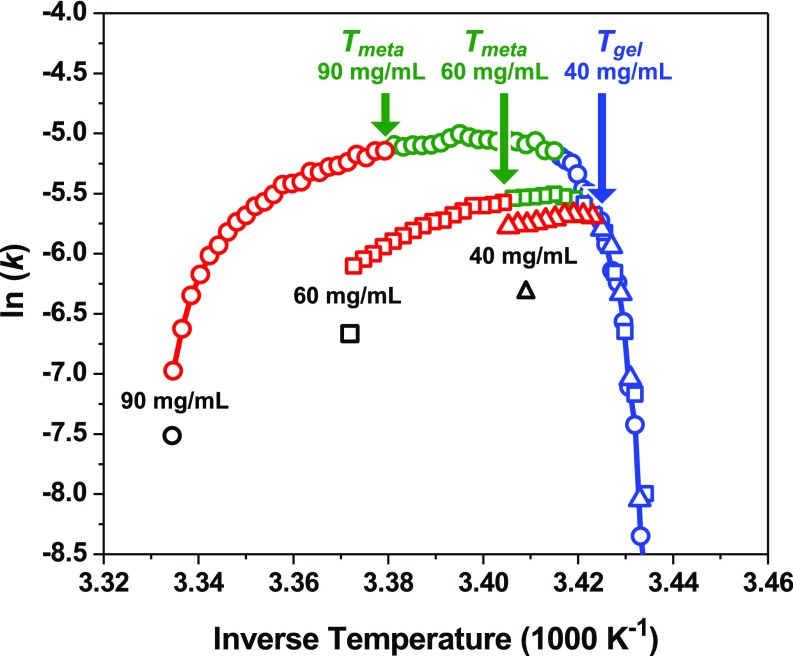
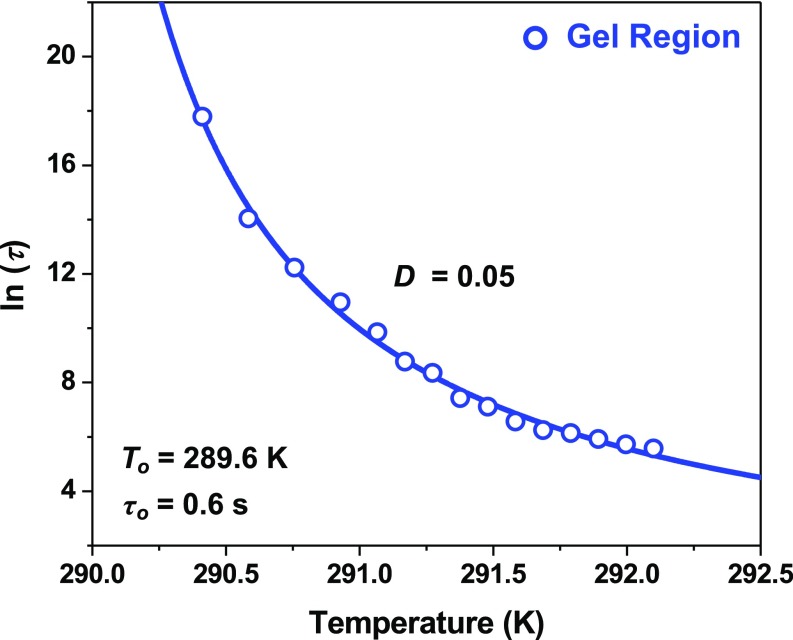
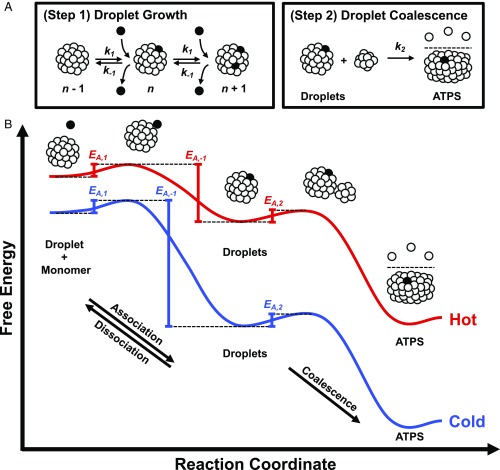
Aqueous two-phase system (ATPS) formation is the macroscopic completion of liquid-liquid phase separation (LLPS), a process by which aqueous solutions demix into 2 distinct phases. We report the temperature-dependent kinetics of ATPS formation for solutions containing a monoclonal antibody and polyethylene glycol. Measurements are made by capturing dark-field images of protein-rich droplet suspensions as a function of time along a linear temperature gradient. The rate constants for ATPS formation fall into 3 kinetically distinct categories that are directly visualized along the temperature gradient. In the metastable region, just below the phase separation temperature, Tph , ATPS formation is slow and has a large negative apparent activation energy. By contrast, ATPS formation proceeds more rapidly in the spinodal region, below the metastable temperature, Tmeta , and a small positive apparent activation energy is observed. These region-specific apparent activation energies suggest that ATPS formation involves 2 steps with opposite temperature dependencies. Droplet growth is the first step, which accelerates with decreasing temperature as the solution becomes increasingly supersaturated. The second step, however, involves droplet coalescence and is proportional to temperature. It becomes the rate-limiting step in the spinodal region. At even colder temperatures, below a gelation temperature, Tgel , the proteins assemble into a kinetically trapped gel state that arrests ATPS formation. The kinetics of ATPS formation near Tgel is associated with a remarkably fragile solid-like gel structure, which can form below either the metastable or the spinodal region of the phase diagram.

Keywords: gelation; liquid–liquid phase separation; monoclonal antibody; temperature gradient microfluidics; upper critical solution temperature.


Conflict of interest statement

The authors declare no conflict of interest.

Figures

Fig. 1.
Fig. 1.
Schematic phase diagram of a colloidal system with attractive interactions displaying an upper critical solution temperature. The binodal (red), spinodal (green), and gelation (blue) curves delineate the various regions of the diagram. Temperature gradient experiments were performed at concentrations below the critical point (open black circle at the top of the binodal and spinodal curves), as illustrated by the vertical bar at Co (red to blue gradient with decreasing temperature). Tph, Tmeta, and Tgel values were extracted from each experiment and are denoted by open colored circles.
Fig. 2.
Fig. 2.
ATPS formation of a mAb solution on the temperature gradient device. (A) Dark-field images at time points ranging from t = 1 to t = 60 min during the experiment. The 2, short upward-pointing black arrows at the bottom of the image denote the temperatures at each of these 2 points, respectively, while the colored arrows denote the positions of the 3 transition temperatures. (B) Schematic diagrams of ATPS formation along the temperature gradient device corresponding to the time points in A. The schematics on the right are drawn from a side-on perspective of the rectangular capillary tube. The droplet cartoons on the far-right side depict more detailed structures corresponding, in descending order, to a protein-rich droplet, 2 coalescing droplets, an equilibrated ATPS, and the gel state, respectively. The protein molecules are depicted as gray spheres in each droplet cartoon. (C) Line scans of scattering intensity versus temperature. The line scans plotted in C correspond to the dashed horizontal lines in the images in A, which are color coded accordingly. The dashed vertical lines denote the 3 phase transition temperatures.
Fig. 3.
Fig. 3.
Kinetic analysis of the light scattering data obtained in Fig. 2. (A) The scattering intensity is plotted as a function of both time and temperature. The data are shown at 15-s time intervals for clarity. (B) Three isothermal decays of the normalized scattering intensity as a function of time from the 3 distinct kinetic regions along the temperature gradient. The open circles are data points and the solid lines are fits to the data using Eq. 1.
Fig. 4.
Fig. 4.
Temperature-dependent KWW parameters for the kinetics of ATPS formation in a solution of 90 mg/mL mAb and 20 mg/mL PEG-3350. (A) The cooperativity exponent, β, is plotted as a function of temperature. The values of β are colored to indicate the gel region from 290.4 to 292.8 K (blue data points), the spinodal region from 293.0 to 295.8 K (green data points), and the metastable region from 295.9 to 299.9 K (red data points). (B) The natural log of the rate constants, ln(k), are presented in an Arrhenius plot. The ln(k) data points are colored according to the regions defined in A. The 2 solid black lines are linear fits to the data on either side of Tmeta, which were used to determine the apparent activation energies, EA,app, for ATPS formation in the metastable and spinodal regions.
Fig. 5.
Fig. 5.
Arrhenius plots for the kinetics of ATPS formation in solutions containing 90 mg/mL (circle data points), 60 mg/mL (square data points), and 40 mg/mL (triangle data points) mAb in the presence of 20 mg/mL PEG-3350. The natural log of the rate constants, ln(k), for each mAb concentration versus inverse temperature is divided into metastable (red data points), spinodal (green data points), and gel (blue data points) regions. The solid red and blue curves are provided as guides to the eye.
Fig. 6.
Fig. 6.
Time constants for ATPS formation as a function of temperature near Tgel for a solution of 90 mg/mL mAb and 20 mg/mL PEG-3350. The natural log values of the time constants, ln(τ), in the gel region, where β < 1, are plotted as blue data points along with the fit to the VFT model, shown as a solid blue curve.
Fig. 7.
Fig. 7.
Two-step mechanism for ATPS formation. (A) ATPS formation begins with droplet growth (Step 1 in A) involving the sequential, reversible association of protein monomers with protein-rich droplets, characterized by the association, k1, and dissociation, k−1. The circles represent folded protein monomers, several of which have been colored in black to highlight the growth mechanism. The number of monomers in the droplets, n, are not drawn to scale. The final stage of ATPS formation is the irreversible coalescence of droplets (Step 2 in A), characterized by the coalescence rate constant, k2. (B) The reaction coordinate diagrams for ATPS formation at hot (red curve) and cold (blue curve) temperatures relate the apparent activation energies measured in Fig. 4B to the 2-step mechanism in A. The activation energies for the elementary steps are not drawn to scale in B.

References

    1. Asherie N., Protein crystallization and phase diagrams. Methods 34, 266–272 (2004). - PubMed
    1. Wang Y., et al. , Pathological crystallization of human immunoglobulins. Proc. Natl. Acad. Sci. U.S.A. 109, 13359–13361 (2012). - PMC - PubMed
    1. Ahamed T., et al. , Phase behavior of an intact monoclonal antibody. Biophys. J. 93, 610–619 (2007). - PMC - PubMed
    1. Trilisky E., Gillespie R., Osslund T. D., Vunnum S., Crystallization and liquid-liquid phase separation of monoclonal antibodies and fc-fusion proteins: Screening results. Biotechnol. Prog. 27, 1054–1067 (2011). - PubMed
    1. Mason B. D., Zhang L., Remmele R. L. Jr, Zhang J., Opalescence of an IgG2 monoclonal antibody solution as it relates to liquid-liquid phase separation. J. Pharm. Sci. 100, 4587–4596 (2011). - PubMed

Publication types

LinkOut - more resources