. 2019 Sep 13;294(37):13638-13656.
doi: 10.1074/jbc.RA119.008903. Epub 2019 Jul 23.

Magnesium transporter 1 (MAGT1) deficiency causes selective defects in N- linked glycosylation and expression of immune-response genes

Affiliations

Magnesium transporter 1 (MAGT1) deficiency causes selective defects in N- linked glycosylation and expression of immune-response genes

Mami Matsuda-Lennikov et al. J Biol Chem. .

Abstract

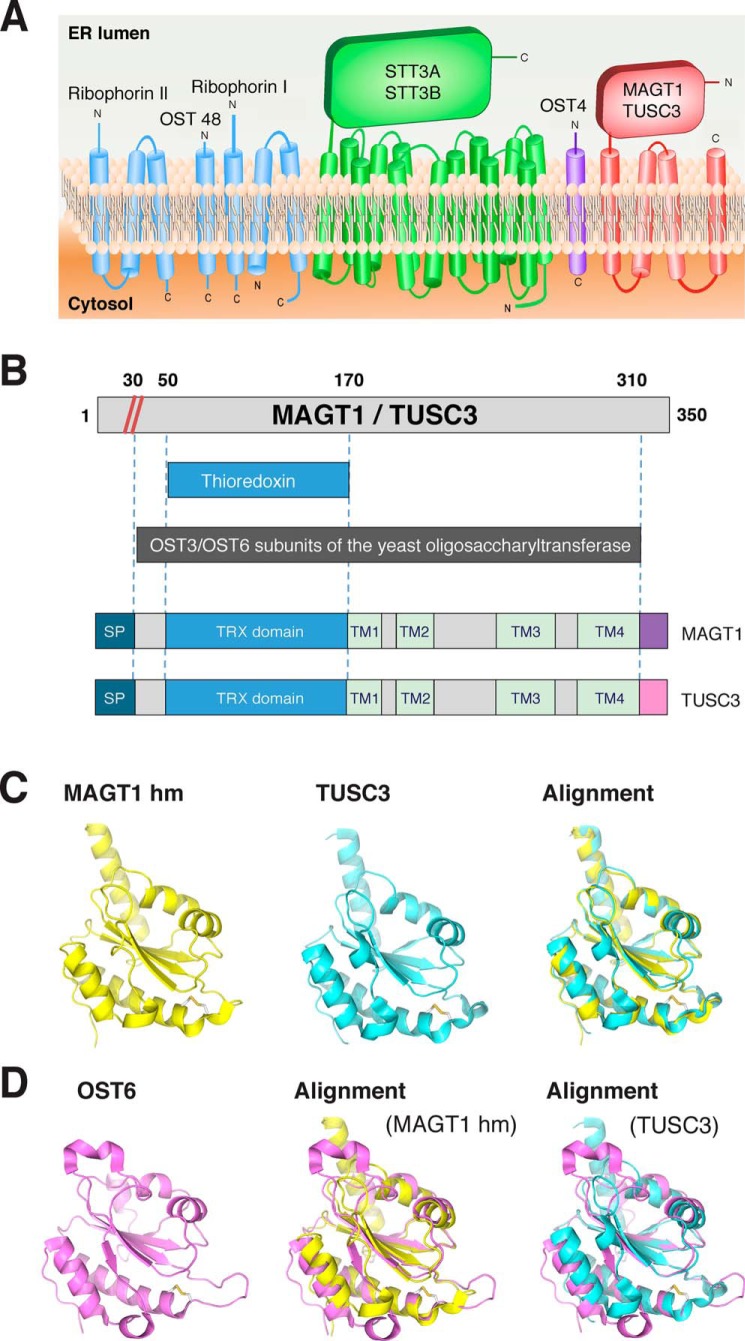
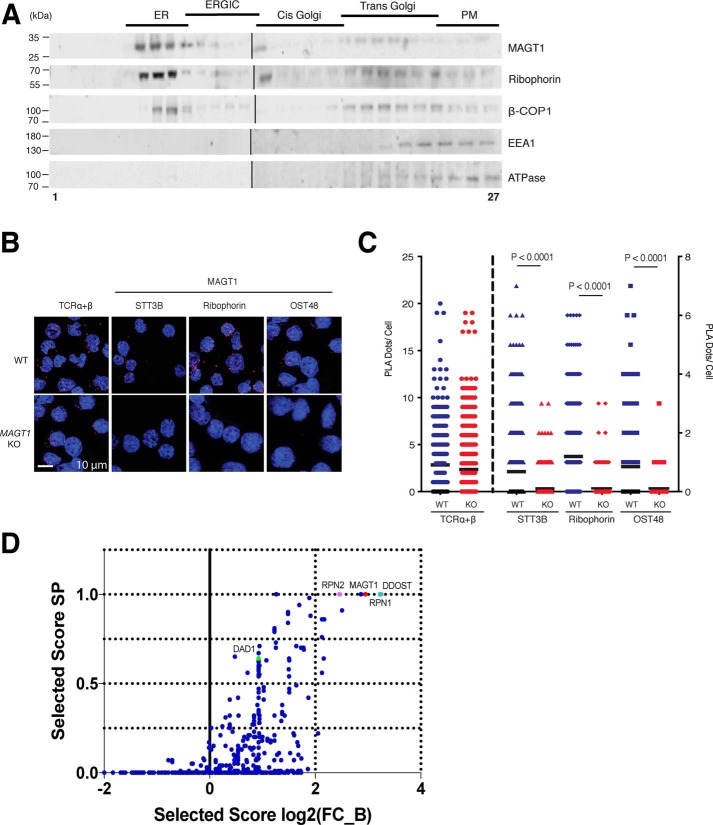
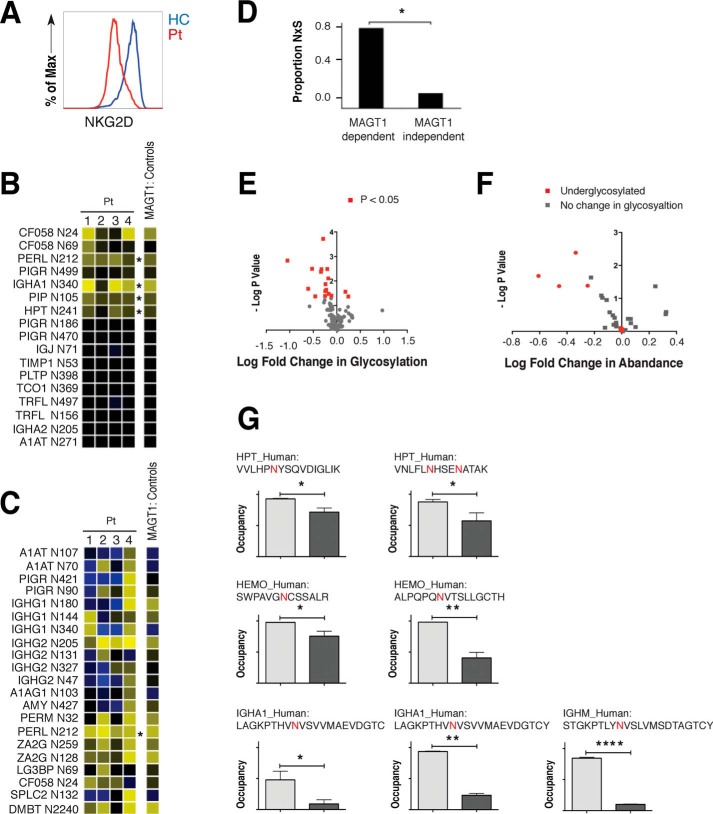
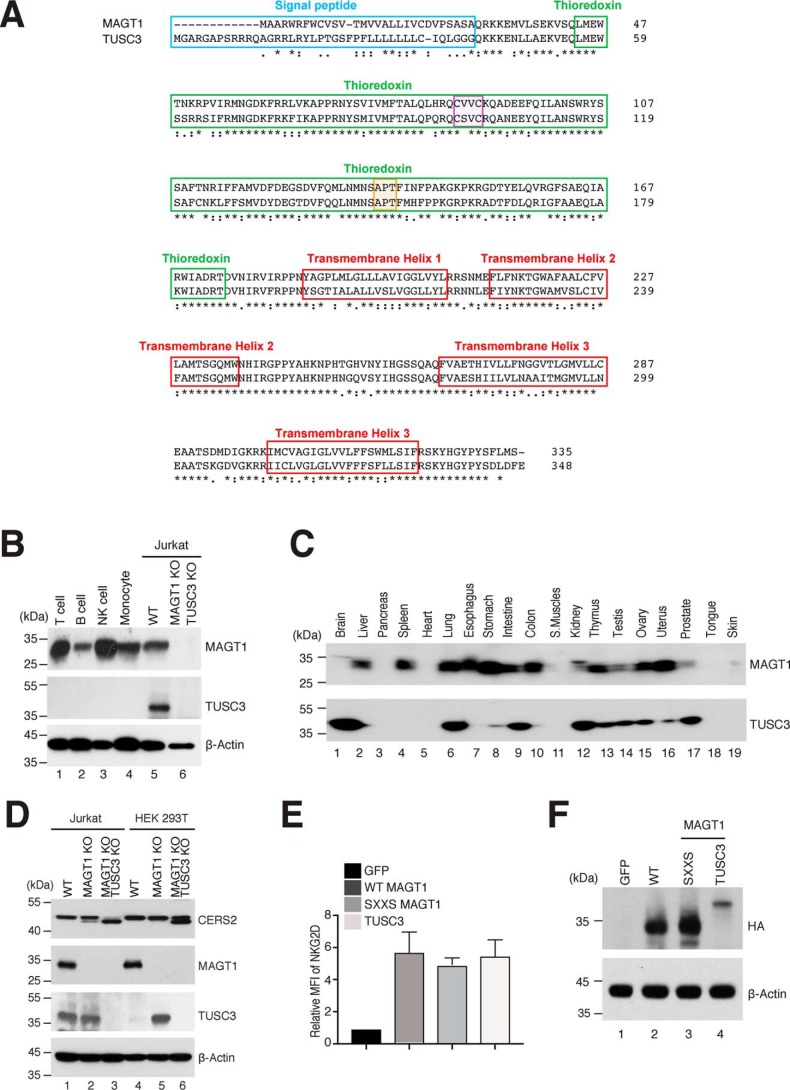
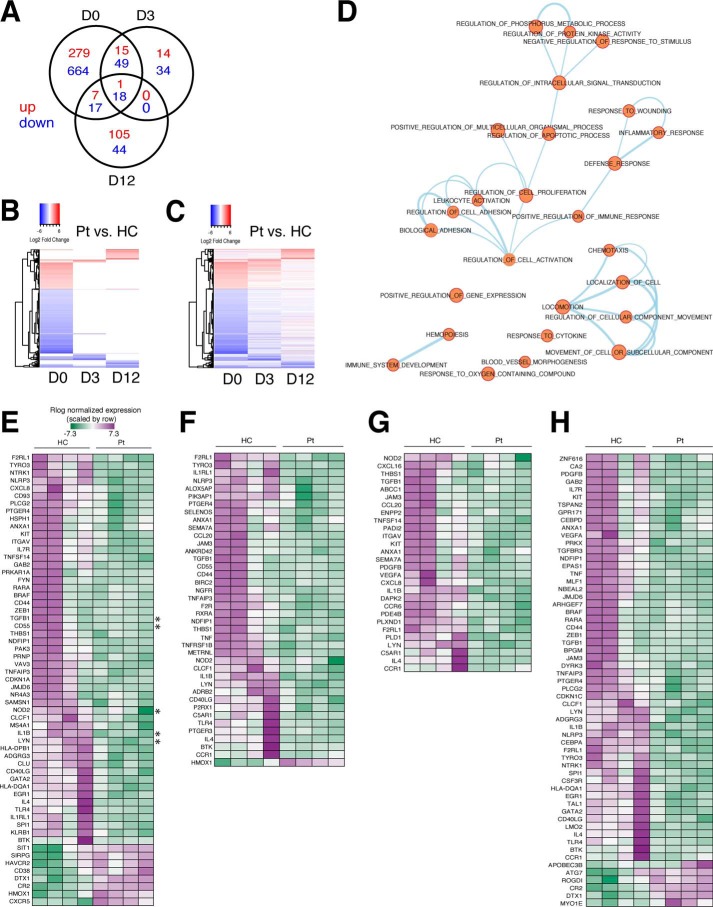
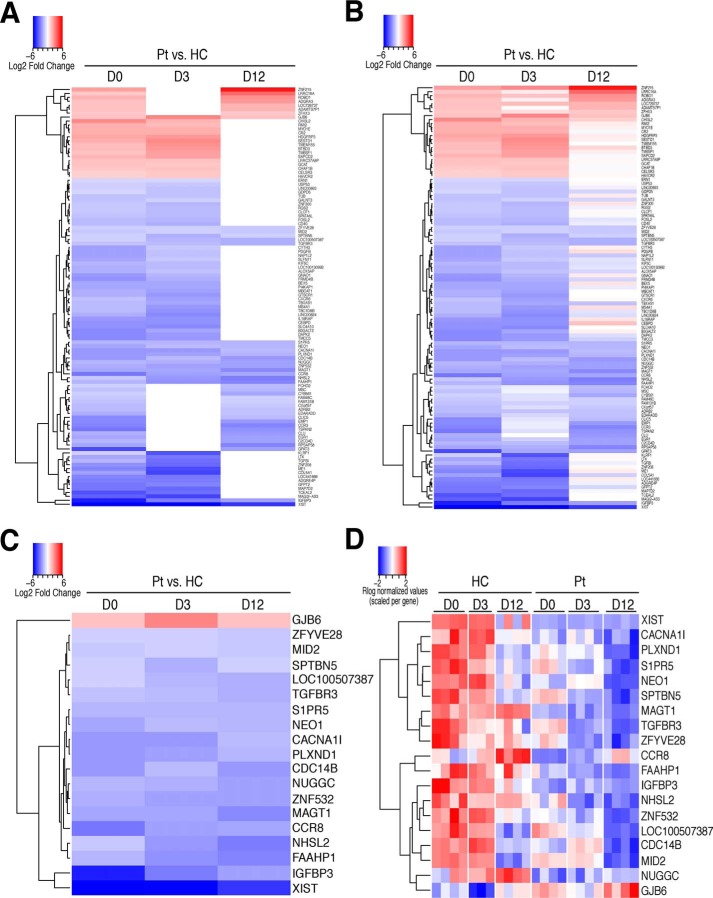
Magnesium transporter 1 (MAGT1) critically mediates magnesium homeostasis in eukaryotes and is highly-conserved across different evolutionary branches. In humans, loss-of-function mutations in the MAGT1 gene cause X-linked magnesium deficiency with Epstein-Barr virus (EBV) infection and neoplasia (XMEN), a disease that has a broad range of clinical and immunological consequences. We have previously shown that EBV susceptibility in XMEN is associated with defective expression of the antiviral natural-killer group 2 member D (NKG2D) protein and abnormal Mg2+ transport. New evidence suggests that MAGT1 is the human homolog of the yeast OST3/OST6 proteins that form an integral part of the N-linked glycosylation complex, although the exact contributions of these perturbations in the glycosylation pathway to disease pathogenesis are still unknown. Using MS-based glycoproteomics, along with CRISPR/Cas9-KO cell lines, natural killer cell-killing assays, and RNA-Seq experiments, we now demonstrate that humans lacking functional MAGT1 have a selective deficiency in both immune and nonimmune glycoproteins, and we identified several critical glycosylation defects in important immune-response proteins and in the expression of genes involved in immunity, particularly CD28. We show that MAGT1 function is partly interchangeable with that of the paralog protein tumor-suppressor candidate 3 (TUSC3) but that each protein has a different tissue distribution in humans. We observed that MAGT1-dependent glycosylation is sensitive to Mg2+ levels and that reduced Mg2+ impairs immune-cell function via the loss of specific glycoproteins. Our findings reveal that defects in protein glycosylation and gene expression underlie immune defects in an inherited disease due to MAGT1 deficiency.

Keywords: Epstein-Barr virus (EBV) infection; N-linked glycosylation (NLG) complex; X-linked magnesium deficiency with Epstein–Barr virus infection and neoplasia (XMEN); glycoprotein; glycosylation; immunodeficiency; immunology; infection; magnesium; magnesium transporter 1 (MAGT1); oligosaccharyltransferase (OST); transporter.


Conflict of interest statement

The authors declare that they have no conflicts of interest with the contents of this article

Figures

Figure 1.
Figure 1.
MAGT1 and TUSC3 have conserved structural similarities with OST subunits. A, symbolic representation of OST subunits characterized in the yeast S. cerevisiae. B, domain architecture of MAGT1, TUSC3, and OST3/OST6 subunits. The numeric annotations are for MAGT1, although the analogous numbers for TUSC3 can be approximated by uniformly adding 12 to all numbers or after the signal peptide cleavage site (red diagonal lines). The domains are signal peptide (SP) (teal), thioredoxin domain (blue), TM (green), C termini that are distinct between the two proteins, including two different versions in TUSC3 (purple and pink). C, homology model of Homo sapiens MAGT1 and TUSC3 TRX domain; H. sapiens MAGT1 TRX domain (homology model, left); H. sapiens TUSC3 TRX domain (homology model, middle); alignment of the structures shown in MAGT1 and TUSC3 (right). D, structure of H. sapiens MAGT1 and TUSC3, compared against that predicted from homology modeling and the S. cerevisiae OST6.
Figure 2.
Figure 2.
MAGT1 localizes to the ER and Golgi and has a role as a glycosylation accessory protein in human lymphocytes. A, representative Western blot analysis of protein fractions obtained from Jurkat supernatants subjected to density gradient fractionation. Markers for different cell compartments are as follows: ribophorin I for ER, ERGIC, and part of the cis-Golgi; β-COP1 for trans-Golgi; EEA1 and ATPase for plasma membrane (PM). B, PLA confocal photomicrographs. Either WT or MAGT1 KO Jurkat cells were interrogated with the indicated antibodies. Red dots show angstrom proximity. The scale, as indicated, is uniform across all images. C, quantification of the number of PLA dots using >300 cells per condition for images in B. Data in A–C are representative of three independent experiments. Error bars represent the standard error of the mean of X independent experiments, and p values were calculated with a paired t test. D, graph of the SAINT (Significance Analysis of INTeractome) probability scoring versus stringent fold change score (FC_B) for MS for MAGT1 interactors in HEK 293T cells.
Figure 3.
Figure 3.
Defective glycosylation in XMEN patient cells. A, flow cytometry analysis of surface expression of NKG2D in cycling T cells from an XMEN patient (Pt) and HC. B, ratio of salivary protein glycosylation site occupancy in XMEN patients after PNGase F and trypsin digestion relative to their HC parents. The N-linked glycosylation site corresponding to each row is indicated at left. C, ratio of salivary protein glycosylation site occupancy in XMEN patients after PNGase F and AspN digestion. B and C; yellow, decreased glycosylation; black, no change in glycosylation; blue, increased glycosylation; *, p < 0.05. D, proportion of the NXS sequons in MAGT1-dependent and -independent glycosylation sites. *, p = 0.02. E, volcano plot of the log fold change in glycosylation versus the negative log of the p value. F, volcano plot of the log fold change in abundance versus the negative log of the p value. G, underglycosylation of glycosites in particular plasma proteins in XMEN patients. *, p < 0.05; **, p < 0.01; ****, p < 0.001.
Figure 4.
Figure 4.
Molecular structure and biochemical characteristic of MAGT1 and TUSC3. A, comparison of the amino acid sequences of MAGT1 and TUSC3. The signal peptide, TRX domain, and transmembrane regions are highlighted in blue, green, and red, respectively. The CXXC and cis-proline motifs are highlighted in purple and orange, respectively. B, representative Western blot analysis showing MAGT1 and TUSC3 expressions in isolated primary human T cells, CD19+ B cells, CD56+ NK cells, CD14+ monocytes as well as Jurkat lines that are WT or harbor CRISPR KOs of both MAGT1 and TUSC3 (MAGT1/TUSC3 KO). C, immunoblotting of MAGT1 and TUSC3 expression in a commercially-prepared human tissue sample membrane. D, representative Western blot analysis of CERS2, MAGT1, TUSC3, and β-actin (loading control) in MAGT1 KO and MAGT1/TUSC3 KO from Jurkat and HEK 293T cells. E, quantification of the mean fluorescent intensity (MFI) of surface NKG2D in MAGT1 KO and MAGT1/TUSC3 KO from Jurkat and HEK 293T cells. Cells were transfected with mRNA encoding HA-tagged versions of GFP, WT MAGT1, the thioredoxin domain mutant of MAGT1 (SXXS), or WT TUSC3 along with NKG2D/DAP10-encoding plasmids. Error bars represent the standard error of the mean of three independent experiments; p values were calculated with a paired t test. F, representative Western blot analysis of MAGT1 and TUSC3 expression in transfected MAGT1/TUSC3 KO HEK 293T cells. The expressions of MAGT1 and TUSC3 were probed by HA antibody with actin as a loading control.
Figure 5.
Figure 5.
Mg2+ regulates glycosylation and plays a unique role in T-cell–mediated immunity, especially in immune protection against EBV. A, flow cytometry histograms of surface expression of NKG2D, CD70, HLA-DR, and CD5 in cycling T cells from HCs cultured either in cRPMI for 5 days, dRPMI for 5 days, or cells that were cultured in dRPMI for 3 days followed by the addition of Mg2+ (0.5 mm) back into the dRPMI for 2 days. B, quantification of the MFI in A. Error bars represent the standard error of the mean of eight independent experiments, and p values were calculated with a paired t test. C, representative Western blot analysis of NKG2D, CD70, TCR-β, and β-actin in cycling T cells from a HC as described in A. Numbers at left indicate kDa standards. Glycosylation patterns are shown at right: fully-glycosylated (2); partially-glycosylated (1); and unglycosylated (0). Data are mean of eight (A and B) or are representative of three (C) independent replicates. D, schematic diagram for killing pathway with NK cells (top) and EBV-721.221(target; bottom) cells. E, flow cytometry analysis of surface expression of NKG2D in EBV-specific NK cells from a HC with cRPMI and dRPMI. F, quantification of the MFI in F. G, percent lysis of autologous EBV-LCLs by EBV-specific NK cells from HC with a different dose of the Mg2+ with significance determined by one-way ANOVA. n indicates the number of independent samples. H, quantification from G. Data are representative of three independent biological replicates. NS, nonsignificant.
Figure 6.
Figure 6.
DEGs and functional enrichment in CD8+ T cells from XMEN and healthy controls before and after activation. A, Venn diagram of the number of DEGs found in CD8+ T cells from XMEN patients (Pts) versus HCs on day 0 (D0) before activation, and day 3 (D3) or day 12 (D12) after activation. DEGs are separated into up-regulated (red) and down-regulated (blue) expression status for each time point. B and C, heatmap of log2 fold change for patients versus HCs for DEGs found in at least one time point (n = 1238 genes), with up-regulated expression as red and down-regulated expression as blue. Genes are represented on the y axis, organized by unsupervised hierarchical clustering. B, heatmap showing only data passing significance threshold of adjusted p value <0.05 and log2 ratio >1. C, heatmap corresponding to B showing all data points (including nonsignificant values) to illustrate trends in direction of expression of genes across time points. D, enrichment map of biological processes enriched in DEGs arranged as a network, with connections between nodes signifying at least 50% overlap among the genes assigned to each node. E–H, representative heatmaps of Rlog normalized counts for genes common to all nodes in various subgroupings within the enrichment Map in D (nodes selected for each heatmap are indicated above each table), including the following themes: E, leukocyte activation; F, defense response; G, cell locomotion; and H, hematopoiesis. The color key in E is used across all heatmaps; up-regulated expression is purple and down-regulated expression is green. Asterisks in E mark genes specifically mentioned under “Results.”
Figure 7.
Figure 7.
Differentially expressed genes in CD8+ T cells from XMEN and healthy controls present in multiple time points. A and B, heatmap of log2 fold change for XMEN patients versus HCs for DEGs found in at least two time points (n = 106 genes). A, heatmap showing only data passing significance threshold of adjusted p value <0.05 and log2 ratio >1. B, heatmap corresponding to A showing all data points (including nonsignificant values) to illustrate trends in direction of expression of genes across time points. C and D, heatmap of log2 fold change (C) and Rlog normalized counts for DEGs (D) found in all three time points (n = 19). For all heatmaps, up-regulated expression is red, and down-regulated expression is blue.

References

    1. Goytain A., and Quamme G. A. (2005) Identification and characterization of a novel mammalian Mg2+ transporter with channel-like properties. BMC Genomics 6, 48 10.1186/1471-2164-6-48 - DOI - PMC - PubMed
    1. Zhou H., and Clapham D. E. (2009) Mammalian MagT1 and TUSC3 are required for cellular magnesium uptake and vertebrate embryonic development. Proc. Natl. Acad. Sci. U.S.A. 106, 15750–15755 10.1073/pnas.0908332106 - DOI - PMC - PubMed
    1. Li F., Chaigne-Delalande B., Su H., Uzel G., Matthews H., and Lenardo M. J. (2014) XMEN disease: a new primary immunodeficiency affecting Mg2+ regulation of immunity against Epstein-Barr virus. Blood 123, 2148–2152 10.1182/blood-2013-11-538686 - DOI - PMC - PubMed
    1. Li F.-Y., Chaigne-Delalande B., Kanellopoulou C., Davis J. C., Matthews H. F., Douek D. C., Cohen J. I., Uzel G., Su H. C., and Lenardo M. J. (2011) Second messenger role for Mg2+ revealed by human T-cell immunodeficiency. Nature 475, 471–476 10.1038/nature10246 - DOI - PMC - PubMed
    1. Grubbs R. D., and Maguire M. E. (1987) Magnesium as a regulatory cation: criteria and evaluation. Magnesium 6, 113–127 - PubMed

Publication types