. 2019 Sep 6;294(36):13487-13501.
doi: 10.1074/jbc.RA118.006772. Epub 2019 Jul 23.

S-Palmitoylation of junctophilin-2 is critical for its role in tethering the sarcoplasmic reticulum to the plasma membrane

Affiliations

S-Palmitoylation of junctophilin-2 is critical for its role in tethering the sarcoplasmic reticulum to the plasma membrane

Min Jiang et al. J Biol Chem. .

Abstract

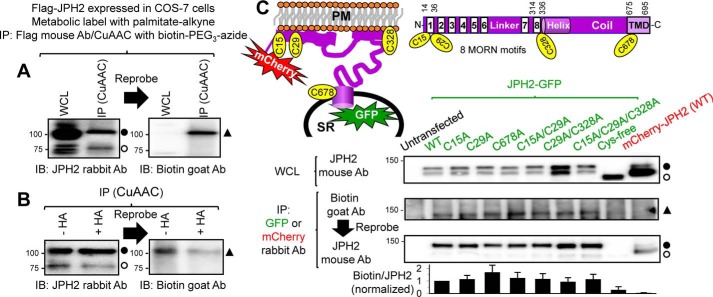
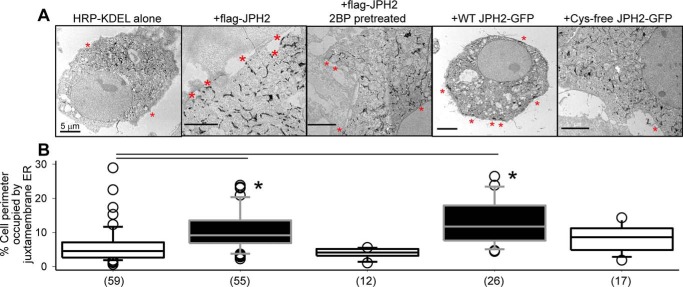
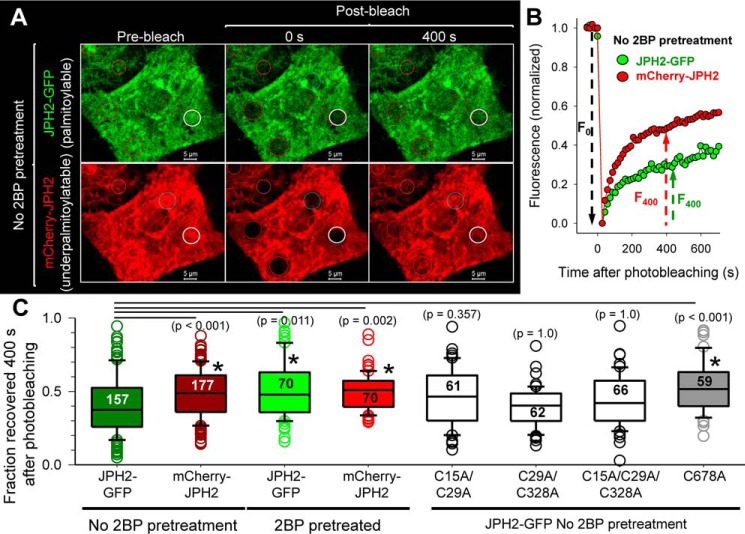
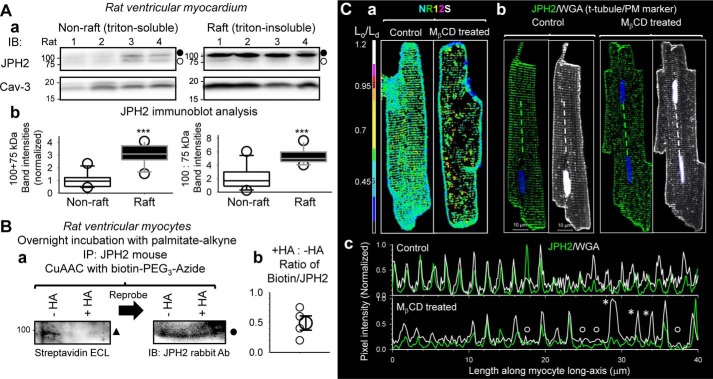
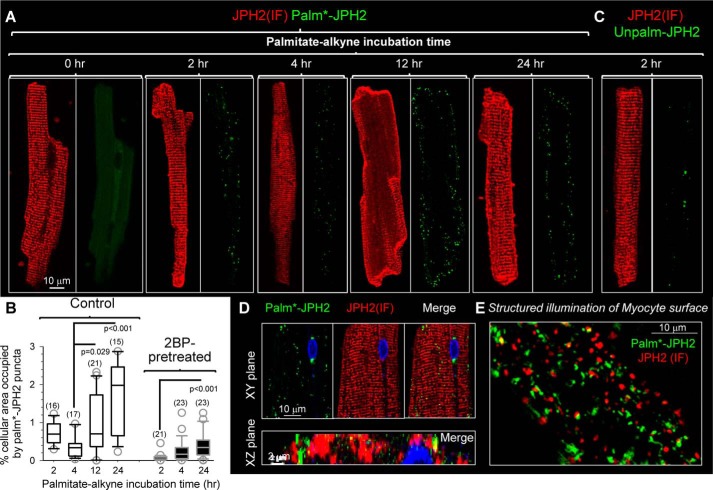
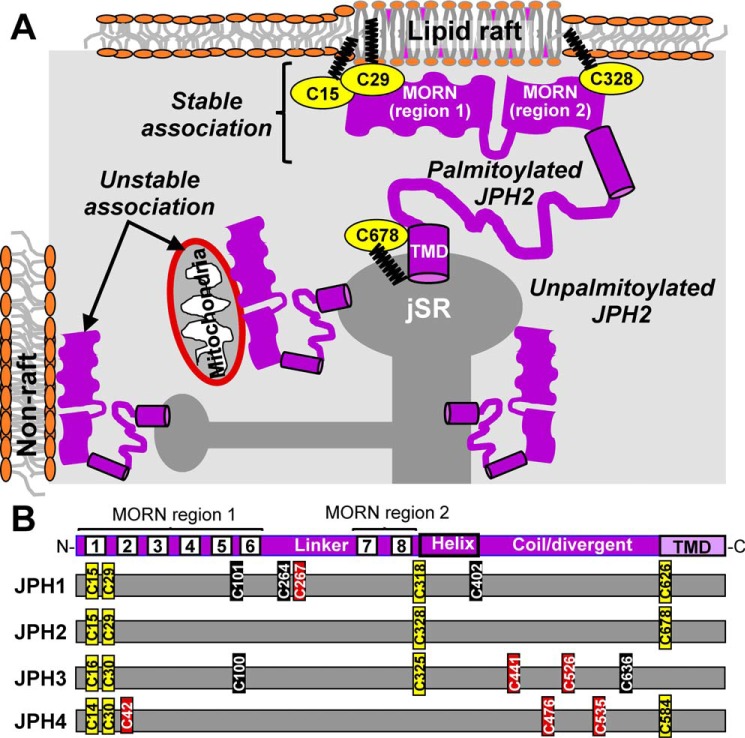
Junctophilins (JPH1-JPH4) are expressed in excitable and nonexcitable cells, where they tether endoplasmic/sarcoplasmic reticulum (ER/SR) and plasma membranes (PM). These ER/SR-PM junctions bring Ca-release channels in the ER/SR and Ca as well as Ca-activated K channels in the PM to within 10-25 nm. Such proximity is critical for excitation-contraction coupling in muscles, Ca modulation of excitability in neurons, and Ca homeostasis in nonexcitable cells. JPHs are anchored in the ER/SR through the C-terminal transmembrane domain (TMD). Their N-terminal Membrane-Occupation-Recognition-Nexus (MORN) motifs can bind phospholipids. Whether MORN motifs alone are sufficient to stabilize JPH-PM binding is not clear. We investigate whether S-palmitoylation of cysteine (Cys), a critical mechanism controlling peripheral protein binding to PM, occurs in JPHs. We focus on JPH2 that has four Cys residues: three flanking the MORN motifs and one in the TMD. Using palmitate-alkyne labeling, Cu(I)-catalyzed alkyne-azide cycloaddition reaction with azide-conjugated biotin, immunoblotting, proximity-ligation-amplification, and various imaging techniques, we show that JPH2 is S-palmitoylatable, and palmitoylation is essential for its ER/SR-PM tether function. Palmitoylated JPH2 binds to lipid-raft domains in PM, whereas palmitoylation of TMD-located Cys stabilizes JPH2's anchor in the ER/SR membrane. Binding to lipid-raft domains protects JPH2 from depalmitoylation. Unpalmitoylated JPH2 is largely excluded from lipid rafts and loses the ability to form stable ER/SR-PM junctions. In adult ventricular myocytes, native JPH2 is S-palmitoylatable, and palmitoylated JPH2 forms distinct PM puncta. Sequence alignment reveals that the palmitoylatable Cys residues in JPH2 are conserved in other JPHs, suggesting that palmitoylation may also enhance ER/SR-PM tethering by these proteins.

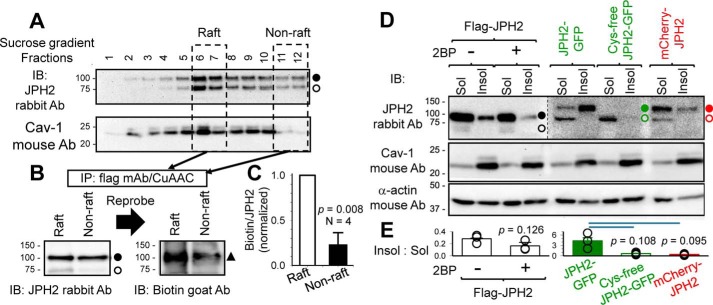
Keywords: ER–PM junction; endoplasmic reticulum (ER); excitation–contraction coupling (E-C coupling); lipid raft; palmitoylation; plasma membrane; post-translational modification.


Conflict of interest statement

The authors declare that they have no conflicts of interest with the contents of this article

Figures

Figure 1.
Figure 1.
JPH2 can be S-palmitoylated, and all four Cys side chains are involved. A and B, FLAG–JPH2 expressed in COS-7 cells was labeled with palmitate–alkyne and immunoprecipitated (IP) from WCL with FLAG mouse Ab and protein A/G magnetic beads. Protein-bound beads were reacted with biotin–PEG3–azide in CuAAC. WCL and CuAAC-reacted immunoprecipitate were analyzed by sequential immunoblot (IB), first with JPH2 rabbit Ab and then with biotin goat Ab. A, FLAG–JPH2 migrated as 75- and 100-kDa bands in both WCL and IP lanes. Biotinylation (i.e. palmitoylation) signal was detected at 100-kDa position in CuAAC-reacted IP but not in WCL. The experiment shown in B was similar to A, except that CuAAC-reacted beads were divided into two halves: one treated with neutral hydroxylamine (+HA, cleaving thioester bonds), and the other treated with Tris (−HA, preserving thioester bonds). Densitometry quantification shows that HA treatment reduced palmitoylation signal (biotin band intensity divided by JPH2 band intensity) by 62%, indicating that JPH2 was S-palmitoylated. C, top right, domain structure of JPH2, showing eight MORN motifs at the N terminus, followed by helical and coil domains, and a TMD at the C terminus. Domains are not drawn to the scale. The locations of four Cys side chains are noted. Top left, JPH2 topology, depicting SR, PM, JPH2 domains, including four Cys side chains, and fluorescent protein reporters (mCherry or GFP, fused to the N and C termini, respectively). Cys to Ala mutations in the JPH2–GFP background are noted as C#A, where # is position number, except when all four Cys side chains were mutated (Cys-free). JPH2–GFP, WT or mutants, and mCherry–JPH2 were expressed in COS-7 cells, labeled with palmitate–alkyne, and immunoprecipitated with GFP or mCherry rabbit Ab. Untransfected COS-7 cells served as negative control for IP with GFP Ab. First row: whole-cell lysates probed with JPH2 mouse Ab. Second and third rows: CuAAC-reacted immunoprecipitates analyzed by sequential immunoblot with biotin goat Ab, and then JPH2 mouse Ab. Fourth row: histogram of palmitoylation signal (biotin band intensity divided by JPH2 band intensity) normalized to that of JPH2–GFP WT. Data are pooled from three to six independent experiments. In this figure and Figs. 3B, 4B, and 7B, Reprobe and arrow between adjacent immunoblot images indicate that the PVDF membrane was probed with the first Ab, stripped, and reprobed with the second Ab. The open and closed circles next to JPH2 immunoblot images denote the expected JPH2 band based on its molecular weight and the putative palmitoylated JPH2 band (increase in molecular mass by 25 kDa). The closed triangles next to biotin Ab immunoblot images (or streptavidin ECL image in Fig. 7B) denote the band of palmitoylated JPH2 biotinylated through the CuAAC reaction.
Figure 2.
Figure 2.
palm*–JPH2 forms distinct puncta close to the plasma membrane, although the majority of JPH2 is in cytoplasmic ER. COS-7 cells expressing FLAG–JPH2 and ER markers (dsRed2–ER-5) were subject to metabolic labeling with palmitate–alkyne, CuAAC reaction with biotin–PEG3–azide, Palm–PLA, IF labeling of JPH2, and viewed by confocal, TIRF, and SIM. Protocol for Palm–PLA and its validation are presented in Figs. S1 and S2, respectively. In all cases, palm*–JPH2 was detected by green fluorophore, and JPH2 (IF) and ER marker were pseudo-colored red and white, respectively.
Figure 3.
Figure 3.
JPH2 in lipid–raft domain is enriched with palmitoylated form, and inhibiting JPH2 palmitoylation reduces its presence in the lipid–raft domains. A, raft and nonraft components of cell membranes from COS-7 cells expressing FLAG–JPH2 labeled with palmitate–alkyne were separated by detergent-free purification/sucrose-gradient fractionation. Fractions were analyzed by immunoblots (IB) with JPH2 and caveolin-1 (Cav-1, raft marker) Abs. Fractions 6 and 7 with high Cav-1 contents were combined as “Raft” component, and fractions 11 and 12 with the lowest Cav-1 contents were combined as “Non-raft” component. Both components were solubilized, and FLAG–JPH2 was immunoprecipitated and reacted with biotin–PEG3–azide in the CuAAC reaction. B, immunoblot images of CuAAC reacted IPs from raft and nonraft components probed with JPH2 Ab and then biotin Ab. C, degree of JPH2 palmitoylation was quantified by dividing the biotinylation band intensity (100 kDa) by the total JPH2 band intensity at 100 kDa. D, Triton-soluble and -insoluble fractions (Sol and Insol) were isolated from COS-7 cells expressing FLAG–JPH2 (without or with 2BP pretreatment), WT, and Cys-free JPH2–GFP or mCherry–JPH2, and analyzed by immunoblot with JPH2, Cav-1, and α-actin Abs (the latter as loading control). FLAG–JPH2 migrated as 100- and 75-kDa bands in Sol lanes (closed and open circles), but as a single 100-kDa band in Insol lanes. JPH2–GFP and mCherry–JPH2 migrated as 125- and 100-kDa bands in Sol lanes, but as single 125 kDa in Insol lanes. Cys-free JPH2–GFP migrated as a single 100-kDa band in the Sol lane and was barely detectable in the Insol lane. Image of the right six lanes from the same membrane is shown in high contrast to better illustrate the differential banding pattern described above. E, bar plot of distribution of JPH2 variants between Insol and Sol components, estimated by dividing the JPH2 band intensity in the Insol lane by the combined JPH2 band intensities in the Sol lane.
Figure 4.
Figure 4.
Disrupting cholesterol-rich lipid rafts in the plasma membrane by extracting cholesterol with MβCD reduces JPH2 palmitoylation and shrinks the cortical ER compartment. A and B, COS-7 cells expressing FLAG–JPH2 were incubated with palmitate–alkyne overnight and then treated with MβCD (2 mm, 36 °C, 2 h) or not before experiments. A depicts distribution of palmitoylated JPH2 by Palm–PLA. Top: representative fluorescence images of palm*–JPH2 and JPH2 IF in cells without or with MβCD treatment. Bottom, data summary. Degree of JPH2 palmitoylation was quantified by ratio of palm*–JPH2 to JPH2 (IF). Data were pooled from three experiments, t test: p < 0.001. B depicts quantification of JPH2 palmitoylation by immunoblotting (IB) of immunoprecipitated and CuAAC-reacted JPH2. Top, immunoblot images of FLAG–JPH2 in WCL (not CuAAC-reacted) and IP (CuAAC-reacted), probed first with JPH2 Ab (100 and 75 kDa, closed and open circles), and then with biotin Ab (100 kDa, closed triangle). Bottom, densitometry summary from three experiments. Degree of JPH2 palmitoylation was quantified by ratio of biotin band intensity to the 100-kDa JPH2 band intensity (biotin/JPH2). A and B together show that MβCD treatment markedly reduced the degree of JPH2 palmitoylation without affecting the total JPH2 protein level. C, direct observation of effect of MβCD on juxtamembrane WT JPH2–GFP and Cys-free JPH2–GFP using live cell TIRF imaging. Top left: selected images before and at 60 and 90 min after MβCD application. ROI indicates the regions of interest where pixel contents were measured. Top right, enlarged views of rectangle areas in the left panels marked by white dotted lines. Bottom, time courses of changes in ROI pixel contents normalized by signals at the beginning of imaging.
Figure 5.
Figure 5.
Palmitoylation of JPH2 stabilizes ER–PM junctions assessed by quantifying juxtamembrane ER elements using transmission EM. COS-7 cells were transfected with horseradish peroxidase (HRP)-conjugated-KDEL, alone or with specified JPH2 variants. In the case of FLAG–JPH2, cells were incubated under the control conditions or in the presence of 2BP (100 μm) overnight before experiment. The ER lumen was marked by amplification of HRP–KDEL followed by peroxidase reaction with DAB in 0.01% H2O2 (16). A, representative TEM images. Red asterisks mark juxtamembrane ER. All scale bars refer to 5 μm. B, summary of percent cell perimeter occupied by juxtamembrane ER. Data were pooled from three independent experiments; numbers of cells analyzed are listed in parentheses. One-way ANOVA of all five groups, p < 0.001, followed by Dunn's tests versus HRP–KDEL alone; *, p < 0.05. Both FLAG–JPH2 and JPH2–GFP increased juxtamembrane ER elements. Inhibiting FLAG–JPH2 palmitoylation by 2BP or replacing all four Cys side chains with Ala in Cys-free JPH2–GFP nullified this effect.
Figure 6.
Figure 6.
Palmitoylation of JPH2 at Cys-678 slows its lateral mobility in the ER network assessed by FRAP experiments. A, representative fluorescence images of coexpressed JPH2–GFP (palmitoylatable) and mCherry–JPH2 (under-palmitoylatable) before and at 0 and 400 s after photobleaching of small circular areas (marked by circles). White circles denote the areas where the recovery time courses are plotted in B. B, time courses of fluorescence recovery, with signals normalized so that prebleach level equals 1, and first scan after bleach equals 0. The fraction of fluorescence recovered at 400 s after photobleaching (F400/F0) is used for quantification as shown in C. C, box plots of summary data. Data were pooled from four independent experiments. Numbers of ROIs analyzed are listed inside the boxes. One-way ANOVA, p < 0.001, followed by Dunn's tests against “JPH2–GFP without 2BP pretreatment.” All p values are listed in parentheses, with p < 0.05 marked with *. JPH2 mobility in the ER was accelerated by reducing palmitoylation: 2BP pretreatment of JPH2–GFP or fusing mCherry to the N terminus. In the case of mCherry–JPH2, 2BP pretreatment did not cause a further increase in its mobility in the ER. Replacing Cys-678 by Ala accelerated JPH2–GFP mobility to that of JPH2–GFP after 2BP pretreatment or mCherry–JPH2. However, double or triple mutations of the other three Cys side chains did not increase JPH2–GFP mobility.
Figure 7.
Figure 7.
Native JPH2 in rat ventricular myocytes is concentrated in lipid–raft domains in palmitoylated form and stabilizes dyads. A, panel a, immunoblot images of JPH2 and caveolin-3 (Cav-3) in nonraft and raft domains (Triton-soluble and -insoluble, respectively) isolated from left ventricular myocardium of rats. Loading was 45 μg/lane. The two fractions were run on separate SDS-polyacrylamide gels. After the proteins were transferred to PVDF membranes, for each of the immunoblots, the two membranes were incubated with the same Ab solutions and subject to ECL reaction/imaging side–by–side to allow quantitative comparison of immunoreactive band intensities between the nonraft and raft domains. Immunoblot of Cav-3 (raft marker) confirms enrichment of raft domains in Triton-insoluble fraction. Filled and open circles next to the JPH2 immunoblots denote putative palmitoylated and unpalmitoylated forms. Panel b, box plots of densitometry analysis of JPH2 immunoblot. Left, combined 100- and 75-kDa band intensities normalized by the mean value of nonraft lanes. Right, ratio of 100:75-kDa band intensities in nonraft and raft domains. t test, nonraft versus raft, ***, p < 0.001. B, testing whether native JPH2 in rat ventricular myocytes is S-palmitoylatable. The experimental procedures and graph format are similar to those of Fig. 1B. Native JPH2 was immunoprecipitated from WCL with JPH2 mouse Ab. On-bead CuAAC reaction linked biotin–PEG3–azide to palmitate–alkyne. Beads were divided into two halves, one reacted with hydroxylamine (+HA) to cleave thioester bonds, and the other incubated with Tris as control (−HA). Proteins were eluted from beads, fractionated by SDS-PAGE, transferred to PVDF membrane, incubated with JPH2 rabbit Ab, and analyzed by sequential ECL reactions as shown in panel a, HRP-conjugated streptavidin (left, to detect biotinylated proteins) and, after stripping, HRP-conjugated secondary Ab targeting rabbit Ab (right, to detect JPH2 bands). Solid triangle and circle denote the 100-kDa palmitoylated JPH2 bands. The PVDF membrane was cut above the 75-kDa size marker because of a strong biotin-positive band at 75-kDa position unrelated to palmitoylated JPH2 (seen in WCL that was not reacted with biotin-azide). Panel b, scatter plot of densitometry analysis. The degree of JPH2 palmitoylation was quantified by dividing biotinylated band intensity to JPH2 band intensity (biotin/JPH2), and the values of +HA/−HA from four independent experiments are plotted as small symbols. The large symbol denotes average (0.49 ± 0.12). C, disrupting lipid rafts by MβCD treatment (2 mm, 36 °C, 2 h) caused disarray of JPH2 and t-tubule organization in rat ventricular myocytes. Panel a, confirming the effectiveness of MβCD treatment in disrupting lipid rafts using a membrane lipid environment-sensitive fluorescent dye, Nile Red 12S (NR12S) (18). Live myocytes were incubated with NR12S (50 nm, in normal Tyrode's solution) at room temperature for 7 min, rinsed, and imaged by confocal microscopy. NR12S was excited by 514-nm laser. Its emission was sensitive to the lipid environment (18): we defined emission in the 523–581-nm range as “liquid-ordered, Lo, channel” and emission in the 591–698 nm range as “liquid-disordered, Ld, channel.” Shown are Lo/Ld ratio images of NR12S in myocytes without (control) or with MβCD treatment. Color scale of Lo/Ld is shown on the left. Panel b, fluorescence images of JPH2 (detected by rabbit Ab/Alexa488 anti-rabbit) and Alexa647-wheat germ agglutinin (WGA, marker of t-tubules and PM, pseudo-colored white) in control and Mβd-treated myocytes. Dashed lines mark where pixel profiles were determined. Panel c, pixel profiles of JPH2 and WGA in the control and MβCD-treated myocytes. Alexa488 and Alexa647 fluorescence signals were background-subtracted and normalized by respective maxima in the profile. Open circles mark missing JPH2 and t-tubules, and asterisks mark missing JPH2 where t-tubule was present. Images in panels a and b are shown at the same magnification as the one with the scale bars.
Figure 8.
Figure 8.
Native JPH2 in rat ventricular myocytes has slow palmitoyl turnover in the junctional SR–PM junctions. The procedures of detecting Palm–PLA and Unpalm–PLA are described in Figs. S1 and S7, respectively. A, modest increase in palm*–JPH2 signals after palmitate–alkyne incubation from 2 to 24 h. The palm*–JPH2 signals clustered to the lateral cell surface, although JPH2 (IF) confirmed JPH2 localization along the z-line (jSR–PM junctions). The 0-h time point (no palmitate–alkyne incubation) serves as a negative control. Images are shown at the same magnification as the left one with scale bar. B, quantification of palm*–JPH2 signals after specified palmitate–alkyne incubation times under the control conditions or after 2BP pretreatment (100 μm, 2 h). The quantification procedure is described in Fig. S6. Shown are box plots of % cellular area occupied by palm*–JPH2 puncta. Numbers of myocytes analyzed are listed in parentheses. One-way ANOVA p < 0.001, followed by Dunn's all-pairwise tests. Groups showing significant differences are marked. C, Unpalm–PLA procedure detected very few Unpalm–JPH2 signals in myocytes after a 2-h incubation with palmitate–alkyne. D, detection of palm*–JPH2 in cytoplasm along the z-lines. Top, XY plane images from the myocyte center. Bottom, merged image of palm*–JPH2 and JPH2 (IF) in an XZ plane along a z-line. E, structured illumination image of myocyte surface. Both palm*–JPH2 and JPH2 (IF) manifested as distinct puncta with little overlap.
Figure 9.
Figure 9.
A, working hypothesis for how palmitoylation directs JPH2 to SR/ER–PM junctions. Unpalmitoylated JPH2 in SR/ER has its MORN motifs exposed to the cytoplasm and may form unstable/transient associations with nonraft domains in plasma membrane or organelle (e.g. mitochondria). Palmitoylation of JPH2 promotes its binding to lipid–raft domains in PM, and binding to lipid–raft domains protects JPH2 from depalmitoylation. This synergism creates a stable association between palmitoylated JPH2 and PM. Palmitoylation of Cys-678 stabilizes JPH2 anchor in SR/ER membrane. B, Cys residues present in JPH1 (human sequence, accession no. Q9HDC5.2), JPH2 (Q9BR39.2), JPH3 (Q8WXH2.2), and JPH4 (NP_001139500.1) are marked relative to the shared JPH structural domains (top) and color-coded based on sequence alignment with JPH2 (yellow), high score (brown), or low score (black) as S-palmitoylation sites. Sequence alignment of JPH1–4 was done using Clustal Omega (https://www.ebi.ac.uk/Tools/msa/clustalo/) (32, 33) (Please note that the JBC is not responsible for the long-term archiving and maintenance of this site or any other third party hosted site.), and prediction of Cys residues as potential S-palmitoylation sites was done using CSS-Palm 4.0 (http://csspalm.biocuckoo.org/online.php (Please note that the JBC is not responsible for the long-term archiving and maintenance of this site or any other third party hosted site.)).

Similar articles

Cited by

References

    1. Manford A. G., Stefan C. J., Yuan H. L., Macgurn J. A., and Emr S. D. (2012) ER-to-plasma membrane tethering proteins regulate cell signaling and ER morphology. Dev. Cell 23, 1129–1140 10.1016/j.devcel.2012.11.004 - DOI - PubMed
    1. Fox P. D., Haberkorn C. J., Akin E. J., Seel P. J., Krapf D., and Tamkun M. M. (2015) Induction of stable ER-plasma-membrane junctions by Kv2.1 potassium channels. J. Cell Sci. 128, 2096–2105 10.1242/jcs.166009 - DOI - PMC - PubMed
    1. Takeshima H., Komazaki S., Nishi M., Iino M., and Kangawa K. (2000) Junctophilins: a novel family of junctional membrane complex proteins. Mol. Cell 6, 11–22 10.1016/S1097-2765(05)00005-5 - DOI - PubMed
    1. Takeshima H., Hoshijima M., and Song L.-S. (2015) Ca2+ microdomains organized by junctophilins. Cell Calcium 58, 349–356 10.1016/j.ceca.2015.01.007 - DOI - PMC - PubMed
    1. van Oort R. J., Garbino A., Wang W., Dixit S. S., Landstrom A. P., Gaur N., De Almeida A. C., Skapura D. G., Rudy Y., Burns A. R., Ackerman M. J., and Wehrens X. H. (2011) Disrupted junctional membrane complexes and hyperactive ryanodine receptors after acute junctophilin knockdown in mice. Circulation 123, 979–988 10.1161/CIRCULATIONAHA.110.006437 - DOI - PMC - PubMed

Publication types