. 2019 Jul 23;10(4):e01376-19.
doi: 10.1128/mBio.01376-19.

Chromatin Profiling of the Repetitive and Nonrepetitive Genomes of the Human Fungal Pathogen Candida albicans

Affiliations

Chromatin Profiling of the Repetitive and Nonrepetitive Genomes of the Human Fungal Pathogen Candida albicans

Robert Jordan Price et al. mBio. .

Abstract

Eukaryotic genomes are packaged into chromatin structures that play pivotal roles in regulating all DNA-associated processes. Histone posttranslational modifications modulate chromatin structure and function, leading to rapid regulation of gene expression and genome stability, key steps in environmental adaptation. Candida albicans, a prevalent fungal pathogen in humans, can rapidly adapt and thrive in diverse host niches. The contribution of chromatin to C. albicans biology is largely unexplored. Here, we generated the first comprehensive chromatin profile of histone modifications (histone H3 trimethylated on lysine 4 [H3K4me3], histone H3 acetylated on lysine 9 [H3K9Ac], acetylated lysine 16 on histone H4 [H4K16Ac], and γH2A) across the C. albicans genome and investigated its relationship to gene expression by harnessing genome-wide sequencing approaches. We demonstrated that gene-rich nonrepetitive regions are packaged into canonical euchromatin in association with histone modifications that mirror their transcriptional activity. In contrast, repetitive regions are assembled into distinct chromatin states; subtelomeric regions and the ribosomal DNA (rDNA) locus are assembled into heterochromatin, while major repeat sequences and transposons are packaged in chromatin that bears features of euchromatin and heterochromatin. Genome-wide mapping of γH2A, a marker of genome instability, identified potential recombination-prone genomic loci. Finally, we present the first quantitative chromatin profiling in C. albicans to delineate the role of the chromatin modifiers Sir2 and Set1 in controlling chromatin structure and gene expression. This report presents the first genome-wide chromatin profiling of histone modifications associated with the C. albicans genome. These epigenomic maps provide an invaluable resource to understand the contribution of chromatin to C. albicans biology and identify aspects of C. albicans chromatin organization that differ from that of other yeasts.IMPORTANCE The fungus Candida albicans is an opportunistic pathogen that normally lives on the human body without causing any harm. However, C. albicans is also a dangerous pathogen responsible for millions of infections annually. C. albicans is such a successful pathogen because it can adapt to and thrive in different environments. Chemical modifications of chromatin, the structure that packages DNA into cells, can allow environmental adaptation by regulating gene expression and genome organization. Surprisingly, the contribution of chromatin modification to C. albicans biology is still largely unknown. For the first time, we analyzed C. albicans chromatin modifications on a genome-wide basis. We demonstrate that specific chromatin states are associated with distinct regions of the C. albicans genome and identify the roles of the chromatin modifiers Sir2 and Set1 in shaping C. albicans chromatin and gene expression.

Keywords: Candida albicans; chromatin; epigenetics; euchromatin; genome instability; heterochromatin.


Figures

FIG 1
FIG 1
Histones and RNA polymerase II occupancy. (A) Correlation between H3 and H4 occupancy (log10 counts at 1-kb bins) across the C. albicans genome. (B) Correlation between RNAPII occupancy (log10 counts) and transcriptional levels (RNA-seq; log10 counts) at protein-coding genes. (C) Histone H3 is depleted at centromeric regions. Data indicate fold enrichment (log2) of histone H3 relative to unmodified H4 across CEN1 (Chr1) and CEN5 (Chr5) centromeric and pericentromeric regions in C. albicans. The Cse4CENP-A enrichment profile (72) is shown for comparison. The blue bar indicates statistically significantly depleted regions for histone H3.
FIG 2
FIG 2
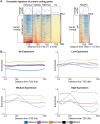
C. albicans chromatin modifications mirror their transcriptional state. (A) Chromatin signature of C. albicans genes (n = 6,408). Average profiles and heat maps of histone modification signatures around the Transcriptional Start Sites (TSS) of genes. The relative fold enrichment (log2) levels for each histone modification normalized to unmodified histone H4 or for aligned reads of immunoprecipitated (IP) sample normalized to aligned reads of input (I) sample (for RNAPII ChIP-seq) are displayed within a region spanning ±0.5 kb around the TSS. The blue-to-red color gradient indicates high to low levels of enrichment in the corresponding region. MIN (minimum), −1.5 log2; MAX (maximum), +1.5 log2. (B) Average profiles of histone modifications and RNAPII occupancy across gene sets with different expression levels (no [n = 416], low [n = 1,369], medium [n = 3,570], and high [n = 983] expression). For each histone modification, the fold enrichment (log2) relative to unmodified H4 is shown. For RNAPII, enrichment (log2) levels are shown as IP/I data (aligned reads of immunoprecipitated [IP] sample normalized to aligned reads of input [I] sample). TES, transcriptional end site.
FIG 3
FIG 3
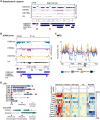
Chromatin signature of C. albicans repetitive elements. (A) (Top) Fold enrichment (log2) of H3K4me3, H3K9Ac, H4K16Ac, and H3 relative to unmodified H4 across the 20-kb right terminal region of chromosome 6 (Chr6). (Middle) Diagram of coding genes found at these regions, according to assembly 22. (Bottom) Diagram depicting statistically significantly enriched (red) or depleted (blue) domains for each histone modification. (B) (Top) Fold enrichment (log2) of H3K4me3, H3K9Ac, H4K16Ac, and H3 relative to unmodified H4 at the rDNA locus and flanking regions (ChrR). (Middle) Diagram of coding genes (white) and ncRNAs (gray) found at this region, according to assembly 22. (Bottom) Diagram depicting statistically significantly enriched (red) or depleted (blue) domains for each histone modification. (C) Average profiles of histone modifications at MRSs and at upstream and downstream sequences. The gray arrow indicates the location of the FGR gene. For each histone modification, the fold enrichment (log2) relative to unmodified H4 is shown. (D) (Left) Diagrams of the structure of the C. albicans LTR and non-LTR retrotransposons. (Right) Chromatin signature of LTR and non-LTR retrotransposons. Average profiles and heat maps of histone modification signatures across each sequence are shown. The relative fold enrichment (log2) levels for each histone modification normalized to unmodified histone H4 or for aligned reads of immunoprecipitated (IP) sample normalized to aligned reads of input (I) sample (for RNAPII ChIP-seq) are displayed. The blue-to-red color gradient indicates high to low levels of enrichment in the corresponding region. MIN (minimum), −1.5 log2; MAX (maximum), +1.5 log2.
FIG 4
FIG 4
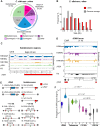
Identification of C. albicans γ-sites (n = 171). (A) Locations and frequencies of γ-sites throughout the C. albicans genome. (B) γ-sites map to longer genes. The histogram shows the gene lengths of γ-sites (red) compared to the genome average (gray). (C) (Top) Fold enrichment (log2) of H3K4me3, H3K9Ac, H4K16Ac, γH2A, and H3 relative to unmodified H4 across the 20-kb right terminal region of chromosome 6 (Chr6). (Middle) Diagram of coding genes found at these regions, according to assembly 22. (Bottom) Diagram depicting statistically significantly enriched (red) domains for γH2A. (D) (Top) Fold enrichment (log2) of H3K4me3, H3K9Ac, H4K16Ac, γH2A, and H3 relative to unmodified H4 at the rDNA locus and flanking regions (ChrR). (Middle) Diagram of coding genes (white) and ncRNAs (gray) found at this region, according to assembly 22. (Bottom) Diagram depicting statistically significantly enriched (red) domains for γH2A. (E) Schematic of strains (1 to 11) used to measure genome instability in relation to γ-sites (red box). The positions of URA3 insertions (one per strain) are indicated (arrow). (F) Frequency of URA3 loss in strains (1 to 11) containing URA3 heterozygous insertions.
FIG 5
FIG 5
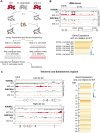
The Sir2 HDAC controls the chromatin state of subtelomeres and the rDNA locus. (A) Schematic of the quantitative ChIP-seq experimental and analytical workflow. (B) (Top) Fold enrichment (log2) of H3K9Ac and H4K16Ac relative to unmodified H4 in WT cells, and relative to the WT in sir2Δ/Δ cells, across the rDNA loci of chromosome R (ChrR). (Middle) Diagram of transcripts found at this region, according to assembly 22. (Bottom) Heat map depicting changes in gene and ncRNA expression levels across the rDNA region in sir2Δ/Δ cells relative to the WT. The yellow-to-blue color gradient indicates high to low levels of expression. MIN (minimum), −2 log2; MAX (maximum), +2 log2. (C) (Left) Fold enrichment (log2) of H3K9Ac and H4K16Ac relative to unmodified H4 in WT cells, and relative to the WT in sir2Δ/Δ cells, across the 20-kb left and right terminal regions of chromosome 3 (Chr3). Diagrams of coding genes (TLO: gray) found at these regions, according to assembly 22, are shown at the bottom. (Right) Heat map depicting changes in gene and ncRNA expression levels in sir2Δ/Δ cells relative to the WT at the 10-kb terminal regions of all C. albicans chromosomes. The yellow-to-blue color gradient indicates high to low levels of expression. MIN (minimum), −2 log2; MAX (maximum), +2 log2.
FIG 6
FIG 6
Chromatin and gene expression changes of set1Δ/Δ strain. (A) Heat map depicting changes in expression of genes and ncRNAs associated with statistically significant changes in H3K4me3 enrichment in set1Δ/Δ cells relative to the WT cells. The yellow-to-blue color gradient indicates high to low levels of enrichment/expression. MIN (minimum), −4 log2; MAX (maximum), +4 log2. (B) (Top) Fold enrichment (log2) of H3K4me3 relative to unmodified H4 in WT cells, and relative to the WT in set1Δ/Δ cells, across the 20-kb left and right terminal regions of chromosome 3 (Chr3). Diagrams of coding genes (TLO: gray) found at these regions, according to assembly 22, are shown below the fold enrichment data. (Bottom) Heat map depicting changes in gene and ncRNA expression levels in set1Δ/Δ cells relative to the WT at the 10-kb terminal regions of all C. albicans chromosomes. The yellow-to-blue color gradient indicates high to low levels of expression. MIN (minimum), −2 log2; MAX (maximum), +2 log2. (C) (Left) Fold enrichment (log2) of H3K4me3 relative to unmodified H4 in WT cells, and relative to the WT in set1Δ/Δ cells, across the rDNA loci of chromosome R (ChrR). Diagrams of coding genes and ncRNAs (gray) found at this region, according to assembly 22, are shown at the bottom. (Right) Heat map depicting changes in gene and ncRNA expression levels across the rDNA region in set1Δ/Δ cells relative to the WT. The yellow-to-blue color gradient indicates high to low levels of expression. MIN (minimum), −2 log2; MAX (maximum), +2 log2. (D) (Left) Profiles of fold enrichment (log2) of H3K4me3 relative to unmodified H4 in WT cells, and relative to the WT in set1Δ/Δ cells averaged across the MRSs, and the upstream and downstream sequences. The gray arrow indicates the location of the FGR gene. (Right) Heat map depicting changes in gene and ncRNA expression levels across all of the MRS regions in set1Δ/Δ cells relative to the WT. The yellow-to-blue color gradient indicates high to low levels of expression. MIN (minimum), −2 log2; MAX (maximum), +2 log2.

Similar articles

Cited by

References

    1. Allshire RC, Madhani HD. 2018. Ten principles of heterochromatin formation and function. Nat Rev Mol Cell Biol 19:229–244. doi:10.1038/nrm.2017.119. - DOI - PMC - PubMed
    1. Strahl BD, Allis CD. 2000. The language of covalent histone modifications. Nature 403:41–45. doi:10.1038/47412. - DOI - PubMed
    1. Allis CD, Jenuwein T. 2016. The molecular hallmarks of epigenetic control. Nat Rev Genet 17:487–500. doi:10.1038/nrg.2016.59. - DOI - PubMed
    1. Van HT, Santos MA. 2018. Histone modifications and the DNA double-strand break response. Cell Cycle 17:2399–2410. doi:10.1080/15384101.2018.1542899. - DOI - PMC - PubMed
    1. Ernst J, Kheradpour P, Mikkelsen TS, Shoresh N, Ward LD, Epstein CB, Zhang X, Wang L, Issner R, Coyne M, Ku M, Durham T, Kellis M, Bernstein BE. 2011. Mapping and analysis of chromatin state dynamics in nine human cell types. Nature 473:43–49. doi:10.1038/nature09906. - DOI - PMC - PubMed

Publication types

LinkOut - more resources